Abstract
Toll-like receptors (TLRs) are a family of proteins that act as the primary sensors of microbial products. Many TLRs require accessory molecules in order to recognize these microbial products and initiate signal transduction cascades. We have identified TRIL (TLR4 interactor with leucine-rich repeats) as a novel modulator of TLR4 signaling showing high expression in the brain. We now show that TRIL also plays a role in TLR3 signaling. TRIL is expressed intracellularly in the astrocytoma cell line U373 and in the monocytic cell line THP1. TRIL co-localizes with the endosomal compartment. These data are consistent with a role for TRIL in TLR3 signaling and endosomal TLR4 signaling. TRIL was induced by the TLR3 ligand poly(I:C). Overexpression of TRIL enhanced cytokine production and interferon-stimulated response element (ISRE) luciferase activity following poly(I:C) stimulation in U373. TRIL interacted with TLR3, and this interaction was enhanced following poly(I:C) stimulation. Transient knockdown of TRIL with siRNA or stable knockdown using shRNA in U373 cells inhibited TLR3 signaling, reducing ISRE luciferase, RANTES, and type I interferon production. Knockdown of TRIL did not affect TLR2 signaling. Most accessory molecules identified to date, such as CD14, gp96, PRAT4a, and Unc93B, all play roles in multiple TLR signaling pathways, and we now show that this is also the case for TRIL.
Keywords: Cytokine, Inflammation, Innate Immunity, Signal Transduction, Toll-like Receptors (TLR)
Introduction
Toll-like receptors (TLRs)3 are pattern recognition receptors essential for the recognition of a wide range of microbial products (2). TLR4, -1, -2, and -6 are expressed on the surface of cells and recognize microbial products, such as LPS and lipopeptides, whereas TLR3, -7, -8, and -9 are expressed intracellularly and are involved in the recognition of nucleic acids (3). The subcellular localization of TLRs is optimized for recognition of microbial products and results in the activation of a specific type of transcriptional response. TLRs activated at the plasma membrane engage MyD88, leading to the activation of NFκB, resulting in the production of proinflammatory cytokines. In contrast, the intracellular TLRs (TLR7, -8, and -9) all associate with MyD88 and lead to the activation of IRF7, resulting in the production of type I interferons. TLR3 engages the adaptor molecule TRIF in order to activate the production of type I interferons (4). In addition, TLR4 has been found to traffic to the early endosome. At the plasma membrane, TLR4 engages with MyD88 and signals to activate NFκB. When TLR4 is endocytosed, it binds TRIF, resulting in the production of type 1 interferons (5).
In order for the TLR signaling complexes to function, they require a number of accessory molecules (6). Some accessory proteins function at the level of regulation at the cell surface, such as MD-2. Both MD-2 and TLR4 bind to LPS and initiate signaling (7). MD-2 knock-out mice fail to respond to LPS, further emphasizing the important role MD-2 plays in this response (8). RP-105 also functions at the cell surface, where it appears to have contrasting roles, which are cell type-specific. RP105 is required by TLR4 and TLR2 for responses in B cells (9). In contrast, in macrophages and dendritic cells, RP105 plays the role of a negative regulator (10). Unc93B, PRAT4A, and gp96 have all been shown to be involved in the regulation of TLRs at the endoplasmic reticulum (11–14). PRAT4A was initially identified as only playing a role in the cell surface expression of TLR4; however, it has more recently been shown that PRAT4A also has a role in TLR7 and TLR9 signaling but interestingly not TLR3 (12, 15). gp96 has been shown to be required for the functional expression of both cell surface and intracellular TLRs (13).
We identified TRIL (TLR4 interactor with leucine rich repeats) as a novel modulator of TLR4 signaling showing high expression in the brain (1). We now show that TRIL also plays a role in TLR3 signaling. As mentioned above, most accessory molecules identified to date play roles in multiple TLR pathways. We show that this is also the case for TRIL. Our data are consistent with a role for TRIL in TLR3 signaling as well as TLR4 signaling, identifying TRIL as an important component in endosomal signaling by these TLRs.
EXPERIMENTAL PROCEDURES
Reagents
The anti-TLR3 antibody was purchased from Santa Cruz Biotechnology, Inc. (Santa Cruz, CA). The anti-rabbit IgG (whole molecule) peroxidase conjugate antibodies were all purchased from Jackson Immunoresearch Laboratories, Inc. Poly(I:C) was obtained from Invivogen. Recombinant IL-6 and RANTES enzyme-linked immunosorbent assays were obtained from R&D Systems. U373 parental cells are an astrocytoma cell line. U373, THP1, and HEK 293 cells were obtained from the European Collection of Animal Cell Cultures (ECACC). GFP, YFP, and RFP TRIL were obtained from Origene Technologies, Inc. CFP-EEA1 was a kind gift from H. Stanmark, and Rab5 was obtained through Addgene from A. Helenius. Puromycin, doxycycline, and Polybrene were obtained from Sigma-Aldrich.
Cell Culture and Stable Cell Line Generation
HEK293 cells and U373 parental cells were maintained in DMEM, supplemented with FCS and 1% (v/v) penicillin-streptomycin solution. Primary rat mixed glia cells were obtained from 1-day-old neonatal brains as described previously (1). Cells were cultured in DMEM for 10 days prior to treatment. U373 parental cells were used for stable cell line generation. U373 cells were transfected using GeneJuice® (Novagen). Cells were maintained in DMEM supplemented with FCS and 1% (v/v) penicillin-streptomycin solution. Cells stably transfected with pcDNA3.1 TRIL-V5 were selected and cloned using 300 μg/ml neomycin analog G418 (Invivogen). Overexpression of TRIL was confirmed by immunoblotting and confocal analysis.
Membrane Fractionation
U373 WT and U373/TRIL cells were seeded at 2 × 10⁵ cells/ml in 10-cm dishes. After 24 h, cells were harvested and placed in membrane resuspension buffer (20 mm Tris·Cl, pH 7.5, 10 mm MgCl2, 1 mm EDTA, 250 μm sucrose, and 200 μm PMSF) and subjected to 30 strokes of a tight fitting Dounce homogenizer. In order to separate the cytosolic and membrane fractions, the homogenate was centrifuged at 90,000 × g for 1 h. 5× sample buffer was added to both the cytosolic and membrane fractions, which were then immunoblotted for TRIL expression using a V5 antibody.
RT-PCR, Small Interfering RNA (siRNA), and shRNA
For quantitative real-time PCR, cDNA was transcribed using the High Capacity cDNA Reverse Transcription kit (Applied Biosystems). Primers and probes for human cDNA were purchased from Applied Biosystems (assay ID Hs00274460_s1). siRNA was carried out in U373 cells as previously described (1). The shRNAmir individual clone was purchased from Open Biosystems (ID V2THS_95531, RHS4743). 293T cells were seeded at 2 × 10⁵ cells/ml in 10-cm dishes. Plasmids encoding shRNA, TRIL (4 μg), or non-silencing control (4 μg) and viral proteins pSPAX2 (3 μg) and pMD2 (1 μg) were transfected into 293T cells using GeneJuice according to the manufacturer's protocol. After 48 h post-transfection, viruses containing supernatants were harvested and replaced with fresh media. Collected supernatants were centrifuged, filtrated with 0.2-μm filters, and stored at 4 °C. The harvesting step was repeated after 24 h, and supernatants were mixed together. U373 or THP1 target cells were plated at 2 × 10⁵ cells/ml in 10-cm dishes. After 24 h, cells were replated with 50% DMEM (U373) or RPMI (THP1) culture medium with 10% (v/v) FCS and 1% (v/v) penicillin-streptomycin solution and 50% harvested virus-containing supernatants. 4 μg of Polybrene (Sigma) was added into the cells. Transduced cells were cultured for 48 h. Puromycin selection (3 μg/ml) was initiated after another 48 h. U373 stable TRIL knockdown cells and the non-silencing control cell line were maintained in DMEM. THP1-stable TRIL knockdown cells were maintained in RMPI. All media contained 10% (v/v) FCS, 1% (v/v) penicillin-streptomycin solution, and 3 μg/ml puromycin. Cells were stimulated for 48 h using 1 or 2 μg of doxycycline in order to activate the shRNA.
IFNα/β Production
U373 cells were seeded at 2 × 10⁵ cells/ml in 12-well plates. Plasmids encoding TLR3 (10 pg), TRIL (10 pg), or both together were transfected into U373 cells using GeneJuice. After 24 h, cells were stimulated with 25 μg/ml poly(I:C). Supernatants were removed. HEKblue cells (Invivogen) are a specially designed cell line containing a reporter gene expressing a secreted embryonic alkaline phosphatase under the control of the IFN-α/β-inducible ISG54 promoter. Stimulation of the cells results in the activation of the JAK-STAT pathway and subsequently the expression of the reporter gene. Secreted embryonic alkaline phosphatase is secreted in the supernatant and is easily detectable when using QUANTI-BlueTM, a medium that turns purple/blue in the presence of secreted embryonic alkaline phosphatase. Measurements were taken at 625 nm.
ISRE and κB Luciferase Assay
U373 cells were seeded in 24-well plates at 1 × 10⁵ cells/ml, incubated overnight, and transfected using GeneJuice transfection reagent (Novagen) according to the manufacturer's instructions. 160 ng of ISRE or κB luciferase plasmid and 80 ng of Renilla luciferase, with the indicated amount of TRIL pcDNA, TLR3 pcDNA, or both together were transfected into each well of a 24-well plate. The equivalent amount of empty pcDNA3.1 vector was added as a control in addition to ensuring equal quantities of DNA in each well. Cells were lysed in 100 μl of passive lysis buffer (Promega) for 15 min. Firefly luciferase activity was assayed by the addition of 40 μl of luciferase assay mix (20 mm Tricine, 1.07 mm (MgCO3)4Mg(OH)2·5H2O, 2.67 m MgSO4, 0.1 mm EDTA, 33.3 mm dithiothreitol, 270 mm coenzyme A, 470 mm luciferin, 530 mm ATP) to 20 μl of the lysed sample. Renilla luciferase was read by the addition of 40 μl of a 1:1000 dilution of coelentrazine (Argus Fine Chemicals) in phosphate-buffered saline. Luminescence was read using the Reporter microplate luminometer (Turner Designs). The Renilla luciferase plasmid was used to normalize for transfection efficiency in all experiments.
Immunoprecipitation
U373 cells were seeded at 2 × 10⁵ cells/ml in 10-cm dishes. FLAG-TLR3 (pcDNA3.1), FLAG-TLR2 (pcDNA3.1), or empty vector control (pcDNA3.1) was transfected in using GeneJuice transfection reagent (Novagen). Cells were treated as outlined in the figure legends. Cells were washed in ice-cold phosphate-buffered saline and lysed in 500 μl of high stringency lysis buffer (50 mm HEPES, pH 7.5, 100 mm NaCl, 1 mm EDTA, 10% glycerol, 1% Nonidet P-40). Supernatants were removed and added to the relevant precoupled antibody. 50 μl of each lysate was retained to confirm expression of TRIL and TLR3. Samples were incubated overnight at 4 °C. Following incubation, the immune complexes were washed twice with 1 ml of lysis buffer and once with ice-cold PBS. All supernatants were removed, and beads were resuspended in 30 μl of 5× sample buffer. The samples were boiled for 5 min, and SDS-PAGE analysis was performed as described previously.
Live Cell Imaging
U373 cells were cultured in DMEM supplemented with 10% (v/v) FCS and 1% (v/v) penicillin-streptomycin solution. Cells were seeded on 35-mm glass-bottomed tissue cell dishes (MatTek) and were transfected with expression plasmids using GeneJuice (Novagene), prior to a 2h stimulation with poly(I:C) (Invivogen). Poly(I:C) was used at a concentration of 25 μg/ml. A point scanning confocal microscope with a heated stage was used for imaging (Olympus FV1000 LSM confocal microscope (numerical aperture, 1.4; ×60)).
THP-1 cells were seeded at 2.5 million cells/ml (Matek dish). Phorbol 12-myristate 13-acetate was added (1:80,000), and cells were incubated for 24 h. Cells were transfected using Lipofectamine (Lipofectamine 2000, Invitrogen). 24 h following transfection, cells were treated with Hoechst 1:20,000 (30-min incubation) and CellMask 1:1000 (plasma membrane stain) (Invitrogen). A point scanning confocal microscope with a heated stage was used for imaging (Olympus FV1000 LSM confocal microscope (numerical aperture, 1.4; ×60)).
Quantitative Colocalization Analysis
Confocal images were analyzed using FluoView FV1000 confocal microscope software. Colocalization of TRIL-V5 (green channel) and endogenous TLR3 (red channel) was described quantitatively. Pearson's correlation coefficient, overlap coefficient, and colocalization coefficient for both red and green channels were employed to evaluate colocalization. Pearson's correlation coefficient is one of the standard measures in pattern recognition. It is used to describe the correlation of the intensity distributions between channels. Pearson's correlation coefficient estimates the correlation based on similarity between shapes. It ranges in value from 1 to −1. A value of 1 represents perfect correlation, −1 represents perfect exclusion, and 0 represents random localization. Values close to 1 indicate that there is reliable colocalization. The overlap coefficient represents an overlap of the signals from red and green channels. Values of the overlap coefficient are defined from 0 to 1, with 1 being high and 0 being low colocalization.
Fixed Cell Imaging
U373 cells were cultured in DMEM supplemented with 10% (v/v) FCS and 1% (v/v) penicillin-streptomycin solution. Cells were seeded on coverslips coated with poly-l-lysine (Sigma). Cells were transfected with 1 μg of expression plasmid TRIL/RFP using GeneJuice (Novagen) and after 24 h were stimulated for 2 h with 25 μg/ml poly(I:C) (Invivogen). U373 cells were permeabilized and fixed using the FIX&PERM® cell permeabilization kit (ADG). Cells were then stained using primary goat anti-human endogenous TLR3 antibody (Santa Cruz Biotechnology, Inc.) and secondary donkey anti-goat 488 antibody (Invitrogen).
U373-TRIL V5 stables were seeded on poly-l-lysine-coated slides 24 h prior to stimulation at a concentration of 0.1 × 10⁶/well. Cells were stimulated with 25 μg/ml PIC for 0, 1, 4, and 24 h, respectively. Medium was removed, and samples were fixed using 3.7% formaldehyde at pH 7.0 for 10 min. Samples were permeabilized using 0.2% Triton X-100 for 5 min. Cells were stained using anti-V5 FITC (rabbit polyclonal antibody to V5-FITC (Abcam) (green) and anti-TLR3 (goat polyclonal antibody to TLR3; Santa Cruz Biotechnology, Inc.). Slides were mounted with ProLong Gold antifade reagent with DAPI (Invitrogen).
THP-1 cells were seeded at 1 × 10⁶ cells/ml in 6-well plates. Cells were transfected using Lipofectamine with 1 μg of FLAG-TLR2 and 1 μg of TRIL RFP. 24 h following transfection, cells were transferred to fibronectin (Sigma)-coated slides. Samples were fixed and permeabilized using the fix and perm kit. FLAG-TLR2 staining was carried out using anti-Flag (murine monoclonal antibody M2, Sigma), followed by Alexa-488 (green) anti-mouse antibody. Slides were mounted with ProLong Gold antifade reagent with DAPI (Invitrogen). The Olympus FV1000 LSM confocal microscope (numerical aperture, 1.4; ×60) was used to take images.
Flow Cytometry
1 × 10⁷ U373/TRIL cells were resuspended in FACS buffer (PBS, 5% FCS, 0.05% sodium azide). 1 ml of blocking buffer (50% FCS, 50% FACS buffer) was added to the cells at room temperature for 30 min. Cells were centrifuged and resuspended in 1 ml of FACS buffer. 100 μl of cell suspension was added to a FACS tube. For each sample to be analyzed, a 1:250 dilution of midregion, C-terminal anti-TRIL antibody was added or the appropriate isotype control. N-terminal, C-terminal, and midregion antibodies were obtained from 21st Century Biochemicals and were affinity-purified. The use of TRIL antibodies has been described previously (1). Samples were kept on ice for 20 min. 3 ml of FACS buffer was added to each sample and centrifuged for 5 min at 1,200 rpm. Supernatants were removed, and this procedure was repeated three times. 100 μl of FACS buffer was added to each sample. 100 μl of conjugated secondary antibody (anti-rabbit) was added to each sample and kept on ice for 20 min. Samples were washed as described previously, resuspended in 500 μl of sheath fluid, analyzed on a FACSCaliber flow cytometer. For intracellular staining, additional fixation and permeabilization steps were included (using the FIX&PERM kit as described by the manufacturer, Calbiochem).
RESULTS
Localization of TRIL
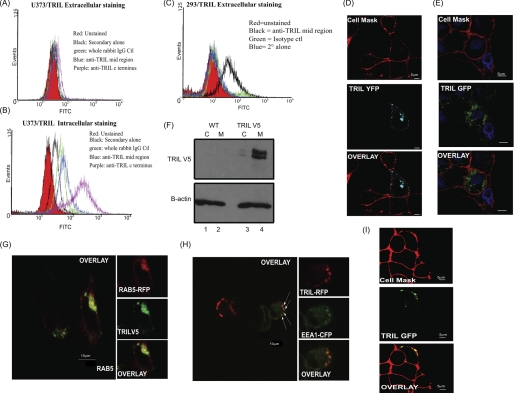
We have previously shown that TRIL contains 13 leucine rich repeats, a type III fibronectin domain, a signal peptide, and a putative transmembrane domain (1). Following on from this work, we decided to investigate the subcellular localization of TRIL in more detail using antibodies we raised to the N terminus, C terminus, and midregion of TRIL (1). Unfortunately, the N-terminal antibody was not sensitive enough for FACS analysis or Western blotting of endogenous or overexpressed protein and therefore was not used. The C-terminal and midregion antibodies were not sensitive enough to pick up endogenous protein by FACS analysis; therefore, we examined localization in U373 cells stably overexpressing TRIL. We can see in Fig. 1A that TRIL was not detected on the cell surface by FACS. Permeabilizing the cells, however, revealed TRIL internally in Fig. 1B. Although both the midregion and C-terminal antibody detect TRIL by flow cytometry, it appears that C-terminal antibody (in purple) is a more sensitive antibody for detecting TRIL in U373 cells compared with the midregion antibody (blue). Surprisingly, in HEK 293 cells, overexpressed TRIL localizes to the cell surface, as observed using the midregion antibody to TRIL (Fig. 1C).
FIGURE 1.
Localization of TRIL. Expression of TRIL was assessed by FACS either to the cell surface of U373/TRIL cells (A) or intracellularly (B) and to the cell surface of 293/TRIL cells (C). D, U373 cells were transfected with TRIL-YFP expressing plasmid for 24 h. Live cell imaging was carried out following the addition of the cell mask stain. E, THP1 cells were transfected with a TRIL-GFP-expressing plasmid for 24 h. Live cell imaging was carried out following the addition of cell mask stain. F, cytosolic (C) and membrane fractions (M) were separated from wild type (WT) and V5-TRIL-overexpressing U373 cells. Lysates were immunblotted for TRIL expression using an anti-V5 antibody. G, U373/TRIL cells were transfected with RAB5-RFP-expressing vector, and samples were fixed and permeabilized. H, live cell imaging of the cellular colocalization (yellow) of TRIL and EEA1 in U373 cells. Cells were transfected with TRIL-RFP-expressing (green) and/or EEA1-CFP-expressing (red) vectors, and images were taken after 2 h of stimulation with 25 μg/ml poly(I:C). I, 293 cells were transfected with TRIL-GFP-expressing plasmid for 24 h. Live cell imaging was carried out following the addition of cell mask stain. Original magnification, ×60; 3× digital zoom. Results are representative of three separate experiments.
TRIL antibodies were not sensitive enough for confocal analysis; therefore, we obtained GFP-, RFP-, and YFP-tagged TRIL plasmids. Fig. 1D shows that TRIL-YFP was localized intracellularly in U373 cells, and no colocalization of TRIL with the cell surface marker (cell mask) was observed. Similar localization of TRIL-GFP was also detected in THP1 cells (Fig. 1E). In addition, we generated a U373 cell line expressing TRIL with a V5 tag. Membrane fractionation studies were carried out on wild type and U373/TRIL cells, and we found that TRIL was mainly localized to the membrane fraction (Fig. 1F, lane 4, top). In order to determine the exact intracellular membrane on which TRIL is expressed, we used confocal microscopy and found that in U373/TRIL cells, the protein could co-localize with the early endosomal markers Rab5 (Fig. 1G) and EEA1 (Fig. 1H). Again, in HEK 293 cells, overexpressed TRIL showed a different pattern of expression and was found mainly to localize on the plasma membrane, as shown by the co-localization of TRIL-GFP with the cell mask stain in Fig. 1I.
TRIL Is Induced by Poly(I:C) Stimulation
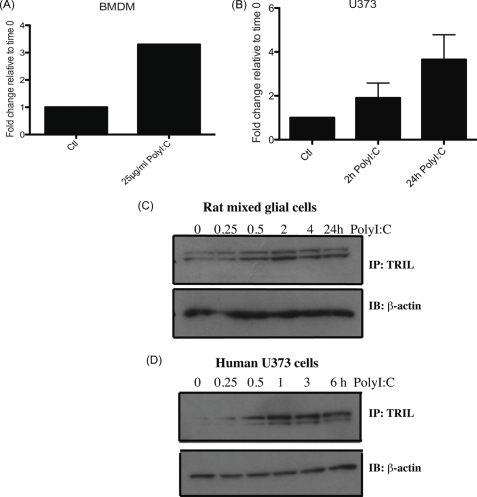
The localization results indicate that TRIL is expressed endosomally in U373 cells. This led us to examine if, in addition to its role in TLR4 signaling, it might also play a role in TLR3 signaling. To investigate this, we studied TRIL induction following poly(I:C) stimulation. We found that at the mRNA level, TRIL was induced in bone marrow-derived macrophages and U373 cells following poly(I:C) stimulation (Fig. 2, A and B, respectively). At the protein level, we see a time-dependent induction of TRIL in both rat mixed glial cells and U373 cells (Fig. 2, C and D). As shown previously, TRIL migrated as a doublet. The effect in the rat mixed glial cells was evident from 2 h, the faster migrating form of TRIL being particularly induced. In U373, the effect was from 1 h, and the slower migrating form was especially enhanced.
FIGURE 2.
Induction of TRIL following poly(I:C) stimulation. Taqman quantitative RT-PCR was carried out on bone marrow-derived macrophages stimulated with 25 μg/ml poly(I:C) for 2 h (A) and wild type U373 stimulated with 25 μg/ml poly(I:C) for 2 and 24 h (B). TRIL mRNA levels were normalized against GAPDH and expressed relative to unstimulated cells. Mixed glial cells (C) and U373 WT cells (D) were stimulated with poly(I:C) for the indicated times, and expression of TRIL or β-actin was assessed by Western blot (IB). Results are representative of two or three independent experiments. Error bars, S.D.
Overexpression of TRIL Enhances TLR3 Signaling
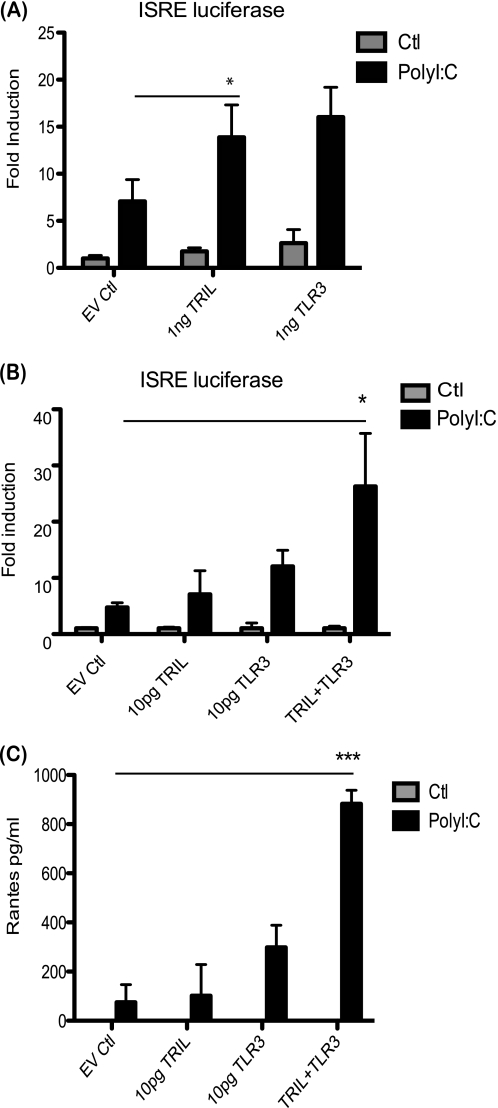
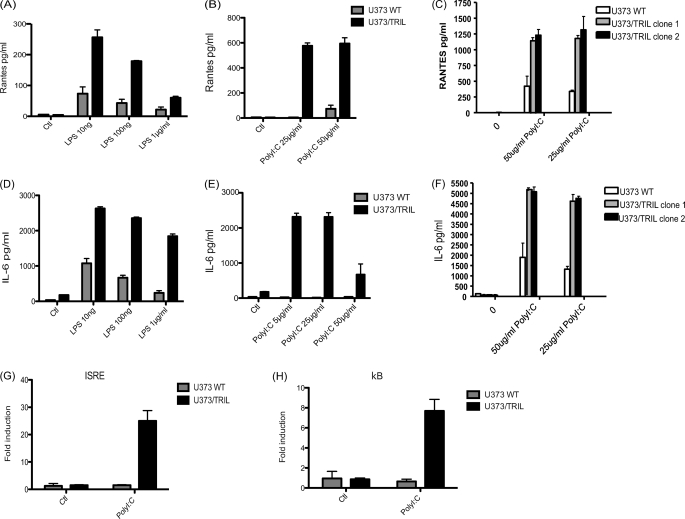
U373 cells are capable of responding moderately to poly(I:C) stimulation. Therefore, we sought to investigate what effect transient transfection of TLR3 or TRIL would have on responses to poly(I:C). Initially, we observed that overexpression of 1 ng of plasmid encoding either TLR3 or TRIL alone gave a similar modest increase in induction of an ISRE luciferase construct following poly(I:C) stimulation (Fig. 3A). In order to determine if there is cooperation between TRIL and TLR3, we reduced the doses of transfected plasmid to 10 pg. We found that either TRIL alone or TLR3 at this low concentration provided minimal increased response to poly(I:C). However, at these low concentrations, when TRIL and TLR3 were transfected together, a significant increase in induction of ISRE and RANTES production was observed (Fig. 3, B and C). To follow on from the transient results, we generated U373 cells stably overexpressing TRIL. We initially generated a pool of U373/TRIL cells, and in addition, we isolated two clones from the stable pool. As expected and as reported previously (1), we observed an enhanced IL-6 and RANTES response to LPS in the U373/TRIL pool cells (Fig. 4, A and D). These cells and the U373/TRIL stable clone cells also displayed enhanced IL-6 and RANTES production as well as an increase in ISRE and κB luciferase activity in response to poly(I:C) stimulation (Fig. 4, B, C, E, F, G, and H).
FIGURE 3.
Overexpression of TRIL enhances ISRE and cytokine induction following poly(I:C) stimulation. A, U373 cells were transfected with plasmids encoding TRIL, TLR3, empty vector control, ISRE luciferase, and TK Renilla. Cells were stimulated with 25 μg/ml poly(I:C) for 24 h. Luciferase activity was measured where results for TK Renilla were normalized and represented as -fold stimulation over nonstimulated controls. Results are expressed as mean ± S.D. for triplicate determinants for two pooled experiments. *, p < 0.05. B, U373 cells were transfected with plasmids encoding TRIL, TLR3, empty vector control, ISRE luciferase, and TK Renilla. Cells were stimulated with 25 μg/ml poly(I:C) for 24 h. Luciferase activity was measured where results for TK Renilla were normalized and represented as -fold stimulation over non-stimulated controls. Results are expressed as mean ± S.D. for triplicate determinants and are representative of three separate experiments. *, p < 0.05. C, U373 cells were transfected with plasmids encoding TRIL, TLR3, or both together. Cells were stimulated with poly(I:C) for 24 h, and RANTES levels were measured by ELISA. Results are expressed as a mean ± S.D. (error bars) for triplicate determinations. ***, p < 0.001.
FIGURE 4.
TRIL modulates responses to LPS and poly(I:C). U373 cell lines stably expressing TRIL were generated. U373/TRIL cells represent pools of stably overexpressing TRIL, and U373/TRIL clone 1 and clone 2 are individual clone cell lines derived from U373/TRIL pool cells. Cells were maintained in complete media prior to stimulation with the indicated concentration of LPS or poly(I:C) for 24 h. RANTES (A–C) and IL-6 (D–F) levels were measured by ELISA. Results are expressed as mean ± S.D. for triplicate determinations. U373 cells were transfected with plasmids encoding ISRE luciferase (G), κB luciferase (H), and TK Renilla for 24 h. Cells were stimulated with 25 μg/ml poly(I:C) for 24 h. Luciferase activity was measured where results for TK Renilla were normalized and represented as -fold stimulation over non-stimulated controls. In all cases, results are expressed as mean ± S.D. for triplicate determinants and are representative of three separate experiments.
TRIL Interacts with TLR3
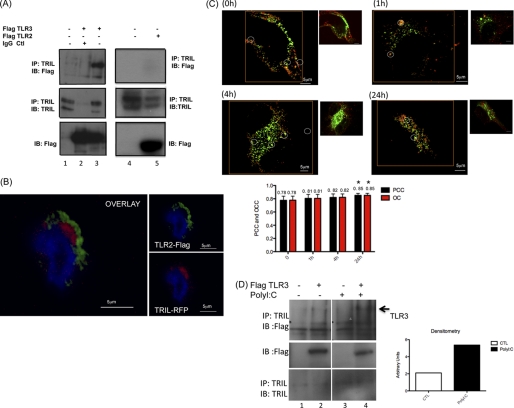
Because overexpression of TRIL enhances TLR3 signaling, we next sought to determine if TRIL is capable of associating with TLR3. As shown in Fig. 5A (lane 3), endogenous TRIL could bind FLAG-tagged TLR3 and not FLAG-tagged TLR2 (Fig. 5A, lane 5). As an additional control, we show that TRIL is unable to co-localize with TLR2 in THP1 cells (Fig. 5B) by confocal microscopy. Because TRIL appears to be localized to the endosome and it is known that TLR3 is endosomally located, we also examined and observed co-localization of TLR3 and TRIL in U373 cells (Fig. 5C) by confocal microscopy. This interaction was very strong at basal levels and displayed a trend toward increased interaction following poly(I:C) stimulation, reaching statistical significance at 24 h poststimulation (Fig. 5C). To further confirm this finding, we show in Fig. 5D by Western blotting that there was an increase in the interaction between TRIL and TLR3 following poly(I:C) stimulation.
FIGURE 5.
TRIL associates with TLR3. U373 cells were transfected with 3 μg of FLAG-TLR3 or -TLR2. A, interaction with endogenous TRIL was assessed following immunoprecipitation (IP) (top) with agarose beads precoupled with anti-TRIL antibody (lanes 1, 3, 4, and 5) or with an IgG control antibody (lane 2). TRIL, TLR3, and TLR2 expression levels were also examined (middle and bottom, respectively). B, confocal microscopy examining colocalization of TRIL-RFP and FLAG-TLR2 in THP1 cells. C, confocal microscopy of the colocalization of U373/TRIL-V5 stable cells (green) and endogenous TLR3 (red). Images were taken after the indicated time points following stimulation with 25 μg/ml poly(I:C). Original magnification, ×60; 3× digital zoom. Circles indicate TRIL, TLR3, and the co-localization of their proteins. Using FluoView FV1000 confocal microscope software images were generated with corrected background (larger images). An average of 18 images generated in three independent experiments were analyzed for each time point to obtain average values for Pearson's correlation coefficient (PCC), overlap coefficient (OC), and correlation coefficient for each channel separately. Panels show original images (right) and an image with corrected background (left) together with a corresponding bar graph for each time point (bottom). Values for 24-h poly(I:C) stimulation were compared with values for unstimulated cells, and the increase was found statistically significant at 24 h (p < 0.02, Mann-Whitney U test). D, U373 cells were transfected with 3 μg of FLAG-TLR3, and cells were stimulated with 25 μg/ml poly(I:C) for 1 h. Interaction with endogenous TRIL was assessed following immunoprecipitation (top) with agarose beads precoupled with anti-TRIL antibody. TLR3 and TRIL expression levels were also examined (middle and bottom, respectively). Densitometric analyses of band intensities were determined using ImageJ (right). Relative intensity (arbitrary units) values were calculated relative to time 0. IB, immunoblot.
Knockdown of TRIL Affects TLR3 Signaling
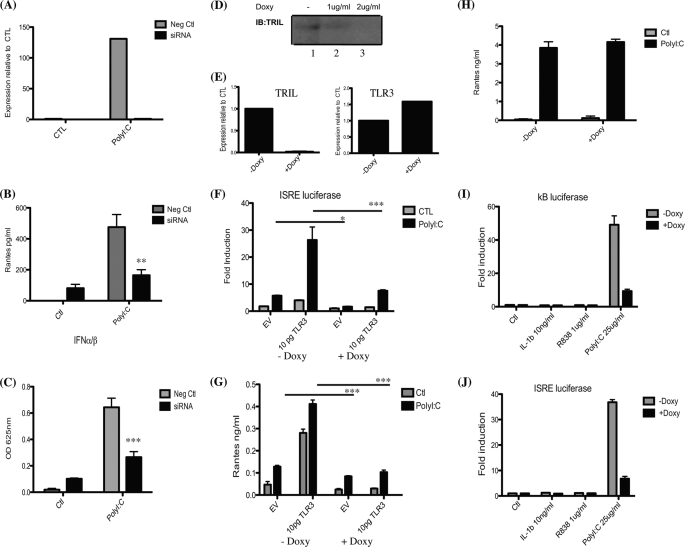
Finally, we performed siRNA and shRNA knockdown of TRIL to determine the effects this would have on TLR3 signaling in U373 cells. siRNA knockdown of TRIL was optimized previously (1). Knockdown of TRIL in U373 cells was confirmed by real-time PCR (Fig. 6A). Silencing of TRIL affected the TLR3 signaling pathway by decreasing the production of RANTES and IFNα/β production in response to poly(I:C) stimulation (Fig. 6, B and C). To further confirm the results from transient knockdown of TRIL, we generated stable U373 cell line expressing a TET-inducible shRNA specific to TRIL. shRNA was activated following the addition of doxycycline. Knockdown of TRIL was confirmed by Western blot (Fig. 6D) and also by PCR (Fig. 6E). TLR3 expression levels were unaffected by the knockdown of TRIL (Fig. 6E, right). Treatment of cells with 2 μg/ml doxycycline led to the greatest decrease in TRIL; therefore, we choose this concentration for the functional assays. Fig. 6, F and G, shows that knockdown of TRIL leads to a significant reduction in ISRE luciferase and RANTES production both in untransfected cells and even more dramatically in cells expressing 10 pg/ml TLR3. As a control to confirm that doxycycline alone does not exert any effects on the cells, we stably transfected cells with a non-silencing control pTRIPZ plasmid. Fig. 6H shows that doxycycline treatment alone does not have any effect on the ability of cells to respond to poly(I:C) stimulation. As additional controls to show specificity for TRIL to the TLR3 and TLR4 signaling pathways, we attempted to treat U373/TRIL stable knockdown cells with a wide range of ligands. Unfortunately, U373 cells do not respond to IL-1β or R848, as demonstrated for κB and ISRE luciferases (Fig. 6, I and J). We also attempted to stimulate U373 cells with CpGb, flagellin, and MDP but did not observe a response (data not shown).
FIGURE 6.
Knockdown of TRIL affects TLR3. U373 cells were transfected with an siRNA oligonucleotide specific to TRIL (50 nm) or an equivalent concentration of scrambled control oligonucleotide. Each oligonucleotide was transfected for 72 h prior to stimulation with poly(I:C) (25 μg/ml) for 24 h. RNA was extracted, and knockdown of TRIL was assessed by real-time PCR (A). RANTES and IFNα/β production was also examined (B and C, respectively). Results are representative of two pooled experiments. U373 cells stably expressing an inducible shRNA specific to TRIL were generated. Activation of the shRNA was carried out by the addition of doxycycline. 2 μg/ml doxycycline provided the best knockdown in U373 cells (D, lane 3). RNA was extracted, and expression of TRIL (left) and TLR3 (right) was assessed by real-time PCR (E). F, cells were transfected with plasmids encoding empty vector or TLR3 and ISRE luciferase. Cells were stimulated with 25 μg/ml poly(I:C) for 24 h. Luciferase activity was measured where results for TK Renilla were normalized and represented as -fold stimulation over non-stimulated controls. RANTES production was also examined from these cells (G). H, U373s stably expressing a non-silencing control pTRIPZ vector were either untreated or treated with 2 μg/ml doxycycline for 48 h followed by 24-h stimulation with 25 μg/ml poly(I:C). RANTES production was assessed. Results are expressed as mean ± S.D. for triplicate determinations. U373/TRIL shRNA stable cells were transfected with plasmids encoding κB luciferase (I), ISRE luciferase (J), and TK Renilla. Cells remained untreated or treated with doxycycline for 48 h followed by stimulation with 25 μg/ml poly(I:C) for 24 h. Luciferase activity was measured where results for TK Renilla were normalized and represented as -fold stimulation over non-stimulated controls. Results are expressed as mean ± S.D. for triplicate determinants. Results are representative of three individual experiments. ***, p < 0.001; *, p < 0.05. Neg. Ctl, negative control; IB, immunoblot.
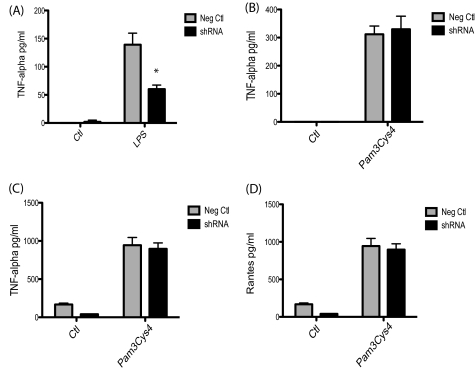
We have previously shown that TRIL knockdown had a modest effect on TLR2 signaling in peripheral blood mononuclear cells. Unfortunately, we were unable to examine TLR2 responses in U373s because TLR2 is not expressed in these cells. In order to determine if TRIL is specific to TLR3 and TLR4 signaling, we generated a THP1 monocytic cell line expressing the TET-inducible shRNA to TRIL. As expected, these cells showed reduced responses to LPS stimulation (Fig. 7A). Knockdown of TRIL did not have any effect on TLR2-mediated TNF-α production after 3- and 24-h stimulation with Pam3Cys4 (Fig. 7, B and C) or on RANTES production (Fig. 7D). We found that THP1 cells do not express TLR3 by real-time PCR (data not shown); therefore, we could not test poly(I:C) responses in these cells.
FIGURE 7.
Knockdown of TRIL does not affect TLR2 signaling. Knockdown of TRIL in THP1 cells was activated by the addition of doxycycline (2 μg/ml). Cells were stimulated with LPS (100 ng/ml) for 3 h, and TNF-α production was assessed by ELISA (A). THP1 cells were stimulated with Pam3Cys4 (1 μg/ml) for 3 h (B) and 24 h (C and D). TNF-α (B and C) and RANTES (D) production was assessed. Results are expressed as mean ± S.D. for triplicate determinations. *, p < 0.05. Neg. Ctl, negative control. Results are representative of three individual experiments.
Overall, the localization of TRIL, along with the enhanced responses to poly(I:C) stimulation when TRIL is overexpressed, in addition to the decrease in response when TRIL is knocked down all indicate that TRIL is an important component of the TLR3 signaling pathway.
DISCUSSION
In addition to its role in TLR4 signaling, we demonstrate that TRIL is also important for TLR3 signaling. In the human astrocytoma cell line U373 and the human monocytic cell line THP1, TRIL is found to localize inside the cell. Interestingly, localization studies using HEK 293 cells stably overexpressing TRIL indicate that TRIL is expressed on the cell surface and co-localizes with the plasma membrane. It is possible that TRIL expression in HEK293 cells is mislocalized, or it could be that TRIL displays differential expression patterns, which are cell type-specific. In U373 cells where TRIL shows an endosomal localization pattern, we confirm that indeed TRIL can co-localize with the early endosomal markers EEA1 and Rab5. We were unable to ensure the localization of endogenously expressed TRIL by flow cytometry due to the limitations of our antibodies. The intracellular localization of TRIL in U373 and THP1 cells led us to investigate if TRIL might in fact play a role in other TLR signaling pathways. We had already ruled out TLR9 as a candidate because knockdown of TRIL using siRNA did not affect the TLR9 signaling pathway (1). We next examined whether TRIL was involved in TLR3 signaling.
TRIL has previously been shown to be an LPS-inducible gene. Here we show that at both the RNA and protein level, TRIL can be induced by poly(I:C) stimulation in bone marrow-derived macrophages, U373 cells, and primary rat mixed glial cells. Transient overexpression of 1 ng of TRIL enhanced ISRE responses to poly(I:C) stimulation to the same extent as overexpression of 1 ng of TLR3. When a lower concentration of either TLR3 or TRIL was transfected into U373 cells alone, it did not greatly enhance the responses to poly(I:C). However, at these low concentrations, when both TRIL and TLR3 were transfected, they gave a significant boost in ISRE activation as well as RANTES production from U373 cells. These results would suggest that at higher concentrations, either protein alone provides an enhanced response, whereas at lower concentrations, both contribute together to provide marked increases in response to stimulation. We believe that the function of TRIL is to enhance the response of TLR3 to stimulation. Cells stably expressing TRIL also show enhanced responses to both LPS and poly(I:C) stimulation, providing further evidence that TRIL is playing a role in both pathways. In addition, we also show that TRIL is capable of binding and co-localizing with TLR3 in U373 cells. Knockdown both transiently by siRNA and stably by shRNA indicates the importance of TRIL for TLR3-mediated signaling. TRIL does not appear to play a role in TLR2-mediated signaling in THP1 cells. This provides another level of specificity indicating that TRIL is important for TLR4 and TLR3 and not TLR2- or TLR9-mediated immune responses.
As mentioned earlier, many accessory molecules play roles in a number of TLR signaling pathways, and this has also been shown to be the case for CD14. CD14 has long been associated as an accessory molecule associated with enhanced responses to LPS; however, it now also appears to play a role in signaling by TLR3 and more recently in TLR7 and TLR9 (16, 17). In the case of TLR3, the role of CD14 appears to be as a molecule that enhances responses of TLR3 to poly(I:C) stimulation. The main role for CD14 appears to be in aiding the uptake of dsRNA into the cell, and like TRIL, CD14 can bind directly to TLR3 in endosomes (16).
In many ways, TRIL appears to act similarly to CD14; however, whether it is capable of interacting directly with dsRNA remains to be examined. We are currently investigating the exact role of TRIL as an accessory molecule, whether it is functioning at the level of ligand binding or indeed if it is acting more as a chaperone protein. One might ask why both TRIL and CD14 carry out similar functions. Perhaps this might be answered by examining the cell types that express these proteins. As mentioned previously, TRIL is highly expressed throughout the cell populations of the brain; in contrast, CD14 is most highly expressed on myeloid cell types (data available from the BioGPS Web site). Perhaps the main functions of TRIL lie in the central nervous system; therefore, TRIL may compensate for CD14 in the brain. Further investigation is needed to answer these questions.
We have preliminary data indicating that TRIL is overexpressed in post-mortem samples from brains of patients with Alzheimer disease (data not shown). Rabin et al. (18) identified TRIL (referred to as KIAA0644) as a protein that is overexpressed in the CNS of patients suffering from amyotrophic lateral sclerosis, a fatal neurodegenerative disease that is characterized by weakness resulting from loss of motor neurons. There is increasing interest in the relationship between activation of the innate immune system and the progression of neurodegenerative diseases. This, together with our data, further emphasizes the potentially important role TRIL plays in inflammatory pathways within the central nervous system.
Acknowledgment
We thank Dr. Julie-Ann O'Reilly for technical assistance in the isolation of rat mixed glial cells.
This work is supported by Science Foundation Ireland, FP7 Marie Curie Initial Training Network TranSIVR, and the Health Research Board and Marie Curie actions. L. A. J. O'Neill is a cofounder, minority shareholder, and member of the scientific advisory board of Opsona Therapeutics Ltd., a University Start-up company involved in the development of anti-inflammatory therapeutics.
- TLR
- Toll-like receptor
- RANTES
- regulated on activation normal T cell expressed and secreted
- Tricine
- N-[2-hydroxy-1,1-bis(hydroxymethyl)ethyl]glycine
- TK
- thymidine kinase
- ISRE
- interferon-stimulated response element.
REFERENCES
- 1. Carpenter S., Carlson T., Dellacasagrande J., Garcia A., Gibbons S., Hertzog P., Lyons A., Lin L. L., Lynch M., Monie T., Murphy C., Seidl K. J., Wells C., Dunne A., O'Neill L. A. (2009) J. Immunol. 183, 3989–3995 [DOI] [PubMed] [Google Scholar]
- 2. Janeway C. A., Jr. (1992) Immunol. Today 13, 11–16 [DOI] [PubMed] [Google Scholar]
- 3. Carpenter S., O'Neill L. A. (2009) Biochem. J. 422, 1–10 [DOI] [PubMed] [Google Scholar]
- 4. Alexopoulou L., Holt A. C., Medzhitov R., Flavell R. A. (2001) Nature 413, 732–738 [DOI] [PubMed] [Google Scholar]
- 5. Kagan J. C., Su T., Horng T., Chow A., Akira S., Medzhitov R. (2008) Nat. Immunol. 9, 361–368 [DOI] [PMC free article] [PubMed] [Google Scholar]
- 6. McGettrick A. F., O'Neill L. A. (2010) Curr. Opin. Immunol. 22, 20–27 [DOI] [PubMed] [Google Scholar]
- 7. Park B. S., Song D. H., Kim H. M., Choi B. S., Lee H., Lee J. O. (2009) Nature 458, 1191–1195 [DOI] [PubMed] [Google Scholar]
- 8. Nagai Y., Akashi S., Nagafuku M., Ogata M., Iwakura Y., Akira S., Kitamura T., Kosugi A., Kimoto M., Miyake K. (2002) Nat. Immunol. 3, 667–672 [DOI] [PubMed] [Google Scholar]
- 9. Ogata H., Su I., Miyake K., Nagai Y., Akashi S., Mecklenbräuker I., Rajewsky K., Kimoto M., Tarakhovsky A. (2000) J. Exp. Med. 192, 23–29 [DOI] [PMC free article] [PubMed] [Google Scholar]
- 10. Divanovic S., Trompette A., Atabani S. F., Madan R., Golenbock D. T., Visintin A., Finberg R. W., Tarakhovsky A., Vogel S. N., Belkaid Y., Kurt-Jones E. A., Karp C. L. (2005) Nat. Immunol. 6, 571–578 [DOI] [PMC free article] [PubMed] [Google Scholar]
- 11. Tabeta K., Hoebe K., Janssen E. M., Du X., Georgel P., Crozat K., Mudd S., Mann N., Sovath S., Goode J., Shamel L., Herskovits A. A., Portnoy D. A., Cooke M., Tarantino L. M., Wiltshire T., Steinberg B. E., Grinstein S., Beutler B. (2006) Nat. Immunol. 7, 156–164 [DOI] [PubMed] [Google Scholar]
- 12. Wakabayashi Y., Kobayashi M., Akashi-Takamura S., Tanimura N., Konno K., Takahashi K., Ishii T., Mizutani T., Iba H., Kouro T., Takaki S., Takatsu K., Oda Y., Ishihama Y., Saitoh S., Miyake K. (2006) J. Immunol. 177, 1772–1779 [DOI] [PubMed] [Google Scholar]
- 13. Yang Y., Liu B., Dai J., Srivastava P. K., Zammit D. J., Lefrançois L., Li Z. (2007) Immunity 26, 215–226 [DOI] [PMC free article] [PubMed] [Google Scholar]
- 14. Akashi-Takamura S., Miyake K. (2008) Curr. Opin. Immunol. 20, 420–425 [DOI] [PubMed] [Google Scholar]
- 15. Takahashi K., Shibata T., Akashi-Takamura S., Kiyokawa T., Wakabayashi Y., Tanimura N., Kobayashi T., Matsumoto F., Fukui R., Kouro T., Nagai Y., Takatsu K., Saitoh S., Miyake K. (2007) J. Exp. Med. 204, 2963–2976 [DOI] [PMC free article] [PubMed] [Google Scholar]
- 16. Lee H. K., Dunzendorfer S., Soldau K., Tobias P. S. (2006) Immunity 24, 153–163 [DOI] [PubMed] [Google Scholar]
- 17. Baumann C. L., Aspalter I. M., Sharif O., Pichlmair A., Blüml S., Grebien F., Bruckner M., Pasierbek P., Aumayr K., Planyavsky M., Bennett K. L., Colinge J., Knapp S., Superti-Furga G. (2010) J. Exp. Med. 207, 2689–2701 [DOI] [PMC free article] [PubMed] [Google Scholar]
- 18. Rabin S. J., Kim J. M., Baughn M., Libby R. T., Kim Y. J., Fan Y., Libby R. T., La Spada A., Stone B., Ravits J. (2010) Hum. Mol. Genet. 19, 313–328 [DOI] [PMC free article] [PubMed] [Google Scholar]


