Abstract
β-Citrylglutamate (BCG), a compound present in adult testis and in the CNS during the pre- and perinatal periods is synthesized by an intracellular enzyme encoded by the RIMKLB gene and hydrolyzed by an as yet unidentified ectoenzyme. To identify β-citrylglutamate hydrolase, this enzyme was partially purified from mouse testis and characterized. Interestingly, in the presence of Ca2+, the purified enzyme specifically hydrolyzed β-citrylglutamate and did not act on N-acetyl-aspartylglutamate (NAAG). However, both compounds were hydrolyzed in the presence of Mn2+. This behavior and the fact that the enzyme was glycosylated and membrane-bound suggested that β-citrylglutamate hydrolase belonged to the same family of protein as glutamate carboxypeptidase 2 (GCP2), the enzyme that catalyzes the hydrolysis of N-acetyl-aspartylglutamate. The mouse tissue distribution of β-citrylglutamate hydrolase was strikingly similar to that of the glutamate carboxypeptidase 3 (GCP3) mRNA, but not that of the GCP2 mRNA. Furthermore, similarly to β-citrylglutamate hydrolase purified from testis, recombinant GCP3 specifically hydrolyzed β-citrylglutamate in the presence of Ca2+, and acted on both N-acetyl-aspartylglutamate and β-citrylglutamate in the presence of Mn2+, whereas recombinant GCP2 only hydrolyzed N-acetyl-aspartylglutamate and this, in a metal-independent manner. A comparison of the structures of the catalytic sites of GCP2 and GCP3, as well as mutagenesis experiments revealed that a single amino acid substitution (Asn-519 in GCP2, Ser-509 in GCP3) is largely responsible for GCP3 being able to hydrolyze β-citrylglutamate. Based on the crystal structure of GCP3 and kinetic analysis, we propose that GCP3 forms a labile catalytic Zn-Ca cluster that is critical for its β-citrylglutamate hydrolase activity.
Keywords: Enzymes, Metabolism, Metalloenzymes, Neurochemistry, Peptidases
Introduction
β-Citrylglutamate (BCG)3 is a pseudodipeptide first identified in newborn rat brain at a concentration of 0.5 to 1 μmol/g. BCG is also detected in kidneys, heart, and to a much lower extent in intestine, spinal cord, and lungs of young rats. The content of BCG in all organs decreases rapidly after birth to the noticeable exception of testes, where its concentration increases during sexual maturation and remains constant during adulthood (1–3). Although the exact physiological function of BCG is presently unknown, different observations suggest that it may play an important role during brain development and spermatogenesis (4, 5). Recently, BCG has been proposed to be an iron and copper chelator (6, 7).
BCG is structurally close to N-acetyl-aspartylglutamate (NAAG), the most abundant dipeptide in the adult brain. NAAG is secreted by neurons upon calcium-dependent depolarization and has long been thought to bind to the glutamate metabotropic receptor mGluR3, possibly attenuating the glutamate-induced excitotoxicity (8). However, this neurotransmitter function of NAAG is still debated (9–11). NAAG is hydrolyzed into N-acetyl-aspartate (NAA) and glutamate by glutamate carboxypeptidase 2 (GCP2), a membrane-bound, glycosylated ectoenzyme with its catalytic site oriented toward the extracellular environment, in good agreement with the observation that NAAG can be released from neurons (12). GCP2 was also designated as FOLH1 because of its hydrolase activity on folyl-polyglutamate, and as prostate specific membrane antigen (PSMA) as it is highly expressed in prostate cancer (13–15). Inhibitors of GCP2 have shown neuroprotective effects in animal models of cerebral ischemia, as well as analgesic activity (16). Noteworthy, NAAG can also be hydrolyzed by glutamate carboxypeptidase 3 (GCP3), also designated as N-acetylated α-linked acidic dipeptidase 2 (NAALAD2), which shares about 67% sequence identity with GCP2, but with a 10-fold lower catalytic efficiency (17, 18). Like GCP2, GCP3 is a membrane-bound, glycosylated ectoenzyme, and its mRNA is abundant in testes and ovaries and detectable in placenta, spleen, prostate, and brain, whereas the mRNA of GCP2 is mainly expressed in kidneys, prostate, liver, and brain (17). Several GCP2 and GCP3 crystal structures have been solved and reveal a high conservation between the catalytic sites as well as the presence of a Zn-Zn cluster typical of this type of metallo-hydrolases (19, 20).
Unlike NAAG, the fate of BCG has been less well studied. BCG is converted to citrate and glutamate by a glycosylated, membrane-bound hydrolase that has never been identified so far. BCG hydrolase activity has been detected in testis, lungs, kidneys, and heart (21). The enzyme has been partially purified from rat testis and displayed properties that indicated that it was different from NAAG hydrolase(s): first, the partially purified BCG hydrolase did not hydrolyze NAAG; second, it was strongly stimulated by Co2+, Mn2+, or Ca2+ but not by Zn2+; finally, endoglycosidase treatment revealed that the glycosylation of BCG hydrolase was not essential for its enzymatic activity. In contrast, NAAG hydrolase is a bi-zinc hydrolase, its activity is not stimulated by the addition of metals and is strictly dependent on the presence of glycans (22, 23).
We recently identified the enzymes responsible for the synthesis of NAAG and BCG as RIMKLA and RIMKLB, two distant homologues of bacterial glutamate ligases (24). RIMKLA specifically synthesizes NAAG from NAA and glutamate using ATP as energy source and is exclusively expressed in brain and spinal cord. RIMKLB is also capable of synthesizing NAAG but, in addition, it catalyzes the synthesis of BCG from citrate, glutamate and ATP. RIMKLB is expressed in brain and spinal cord, but also in tissues where NAT8L, the NAA synthesizing enzyme, is not expressed such as testes, ovaries, and oocytes (25), indicating that in these tissues RIMKLB most likely acts exclusively as a BCG synthase. To gain more information about the physiological function of BCG, we attempted to purify BCG hydrolase from mouse testis extracts and to identify it.
MATERIALS AND METHODS
Purification of β-Citrylglutamate Hydrolase from Mouse Testis
5.5 g of mouse testis were homogenized in 27.5 ml of Buffer A (25 mm Hepes pH 7.1, 120 mm NaCl) and centrifuged for 30 min at 15,000 × g. The pellet containing >90% of the BCG hydrolase activity was resuspended in Buffer A containing 5% Triton X-100 (v/v) in a Downs homogenizer, agitated for 30 min at room temperature and centrifuged for 30 min at 15,000 × g. The supernatant was diluted 10-fold in Buffer B (25 mm Tris pH 7.8, 0.5% Triton X-100) and loaded onto a 25-ml DEAE-Sepharose column equilibrated with Buffer B. The column was washed with 75 ml of Buffer B, and proteins were eluted with a linear NaCl gradient (0 to 0.5 m NaCl, 2 × 125 ml of Buffer B). Fractions (4 ml) were collected, and NAAG hydrolase and BCG hydrolase activities were measured in the presence of 1 mm MnCl2. Fractions containing BCG hydrolase activity (76 ml) were pooled and diluted 5-fold in Buffer C (25 mm Tris, pH 8.5, 0.5% Triton X-100) and loaded onto a 25-ml Q-Sepharose column equilibrated with Buffer C and a linear NaCl gradient (0 to 0.5 m NaCl in 2 × 125 ml Buffer C) was applied. Fractions containing BCG hydrolase activity (42 ml) were pooled and concentrated to 2.5 ml onto an Amicon Ultra 30 kDa concentration unit (Millipore) and loaded onto a 5-ml ConA-Sepharose column as follows: the BCG hydrolase preparation was diluted 10-fold in buffer D (25 mm Hepes, pH 7.4, 0.5 m NaCl, 0.05% Triton X-100, 1 mm MnCl2, 1 mm CaCl2) and loaded onto the ConA-Sepharose column equilibrated with the same buffer. The column was washed with 50 ml of Buffer D and the proteins were eluted with a stepwise gradient of methylglucose (0, 25, 50, 100, 250, and 500 mm). The active fractions were pooled, concentrated to 2 ml, and loaded onto a Superdex S-200 gel filtration column (GE Healthcare) as described previously (24).
Identification of Proteins by Mass Spectrometry
The purified enzyme was loaded on a 10% (w/v) polyacrylamide-SDS gel, after electrophoresis the gel was stained with colloidal Coomassie Blue (Fermentas, Lituania). The bands of interest were cut out and digested with trypsin. Peptides were analyzed by capillary LC-tandem mass spectrometry in a LTQ XL ion trap mass spectrometer (ThermoScientific, San Jose, CA) fitted with a microelectrospray probe. The data were analyzed with the ProteomeDiscoverer software (ThermoScientific), and the proteins were identified with SEQUEST against a target-decoy nonredundant mouse protein database obtained from NCBI. The false discovery rate was below 5%.
Tissue Distribution of β-Citrylglutamate Hydrolase
Mouse tissues were homogenized with 3 ml/g Buffer A (25 mm Hepes, pH 7.1, 120 mm NaCl) and centrifuged for 30 min at 18,000 × g. The pellets were washed by three cycles of resuspension in Buffer A in a Downs homogenizer and 30 min centrifugation at 18,000 × g. They were finally resuspended in Buffer A containing 5% Triton X-100 (v/v) and used for the measurements of BCG hydrolase and NAAG hydrolase activities. Protein was assayed with the method of Bradford using bovine γ globulin as a standard (26). Quantitative PCR experiments were performed as described previously (27).
Cloning and Preparation of Expression Vectors
The DNA sequences of mouse GCP3 (NAALAD2) and GCP2 (FOLH1) (GenBank® reference sequence NM_028279 and NM_001159706) were PCR-amplified from I.M.A.G.E. clones IRCLp5011C0120G and IRCLp5011C0626D (ImaGene GmbH) using 5′ primers (GCP3 : ctg acc caa gga tcc atg gca agg cct agg cat ctc cg; GCP2 : cta aag ttg gga tcc atg tgg aac gca ctg cag gac) containing a BamHI restriction site (in bold) and 3′ primers (GCP3: tcg aca gaa gaa ttc cta taa cac att ggt cag tgt ccc; GCP2: ttg gtg aga gaa ttc tta agc tac ttc cct cag agt ctc tgc) containing an EcoRI site. The PCR products were inserted in the pEF6Myc-His eukaryotic expression vector at the BamHI-EcoRI sites and checked by sequencing.
For the expression of a soluble form of GCP3 and GCP2, the first 43 (GCP3) and 55 (GCP2) amino acids were replaced by the following leader sequence: MDKLRVPLWPRVGPLCLLLAGAAWA*PSPSLYPYDVPDYAPDPKFE which consists of the first 36 N-terminal amino acids of murine EPO receptor in which 9 amino acids of the HA epitope (underlined) have been inserted after the signal peptide cleavage site (indicated by *) (28). A BamHI restriction site (in bold) was introduced by site directed mutagenesis in nucleotides coding for residues 42–43 (GCP3) or 53–54 (GCP2) using 5′ primers (GCP3: ctc aaa gaa aca act act tct gct gga tcc cat caa agt ata caa cag; GCP2: cca atg aag cta ctg gta atg gat ccc att ctg gca tga aga agg), respectively to generate GCP3-BamHI*-pEF6Myc-His and GCP2-BamHI*-pEF6Myc-His constructs. The above leader sequence was amplified from (28) using a 5′ primer (cca tac tgg gta cca tgg aca aac tca ggg tgc ccc tct ggc) containing a KpnI site and a 3′ primer (gga tat ggg gat ccc tca aac ttg ggg tcc ggg gcg tag tct gg) containing a BamHI site and inserted in the GCP3-BamHI*-pEF6Myc-His and GCP2-BamHI*-pEF6Myc-His at the KpnI-BamHI sites. Site-directed mutagenesis of S509N (GCP3) and of N519S (GCP2) was performed using the following 5′ primer: gaa tca ata agc ttg gat ctg gga atg att ttg agg ctt act tcc (GCP3) and gca agc tgg ggt ctg gca gtg att ttg aag tgt tct tcc (GCP2), respectively. All expression vectors were checked by sequencing.
Expression, Purification, and Quantification of Mouse Recombinant GCP3 and GCP2
HEK-293T cells were cultured and transfected essentially as described by (29) using the jetPEITM procedure. For the expression of the soluble, HA-tagged, forms of wild-type and mutated GCP3 and GCP2, HEK-293T cells were transfected in serum-free medium. After 48 h at 37 °C, the culture medium containing soluble GCP3 or GCP2 was collected and concentrated on an Amicon Ultra 100 kDa concentration unit and applied onto a Superdex S-200 gel filtration column (GE Healthcare) equilibrated with buffer B (25 mm Hepes, pH 7.1, 200 mm NaCl), and fractions were collected. SDS-PAGE analysis indicated that the recombinant proteins represented between 1 and 5% of total protein. Quantification of the band corresponding to the recombinant GCPs was achieved using molecular weight markers (Fermentas, Lituania) as standards. A more accurate relative quantification of the different GCP preparations was also performed by quantitative Western blot on an Odyssey Infrared Imager (Licor) using anti-HA epitope antibodies (diluted 1:2000) and IRdye 680 anti-mouse secondary antibodies (Licor, diluted 1:5000) as described.4 Membrane-bound forms of GCP3 and GCP2 were produced by transfection of HEK-293T cells as described above. 48 h after transfection, the cells were washed once with 5 ml of PBS and scraped into 0.8 ml of Buffer A (25 mm Hepes, pH 7.1, 120 mm), frozen in liquid nitrogen, thawed and lysed by vortex-mixing. The resulting homogenates were centrifuged for 30 min at 18,000 × g and 4 °C. The supernatants were discarded, and the pellets washed by two cycles of resuspension in Buffer A and centrifugation (30 min at 18,000 × g and 4 °C) and finally solubilized in Buffer A supplemented with 5% Triton X-100.
Enzymatic Assays
The recombinant soluble forms of GCP3 and GCP2 were assayed radiochemically in a mixture (200 μl final volume) comprising, unless otherwise stated, 25 mm Hepes, pH 7.1, 0.1 mg/ml BSA and either 30,000 cpm β-citryl-l-[U-14C]glutamate and β-citryl-l-glutamate, or N-acetyl-aspartyl-l-[U-14C]glutamate and N-acetyl-aspartyl-l-glutamate in concentrations ranging from 0 to 0.1 mm, and the indicated concentration of divalent cation as a chloride salt. For enzymatic assays of BCG hydrolase purified from mouse testis or of the membrane-bound forms of recombinant GCP2 and GCP3, Triton X-100 was added to the assay mixture to a final concentration of 0.25%. After 30 min at 30 °C, the reaction was stopped by heating 5 min at 80 °C, and the heated incubation mixture was centrifuged for 20 min at 15,000 × g. The resulting supernatant was diluted with 0.8 ml water and applied onto a 1-ml Dowex AG1-X8 column (Cl− form, 100–200 mesh, Acros Organics) prepared in a Pasteur capillary pipette. The resin was washed with 2 ml of water, followed by 5 ml of 150 mm NaCl to elute the released glutamate. Radioactivity was counted in the presence of Ultima Gold (Perkin Elmer) in a liquid scintillation counter.
Synthesis of β-Citryl-l-glutamate, β-Citryl-l-[U-14C]glutamate and N-Acetyl-aspartyl-l-[U-14C]glutamate
β-Citryl-l-glutamate was synthesized and purified as described previously (24). For the preparation of radiolabeled BCG and NAAG, 1 mU of purified His-tagged RIMKLB was added to a 5-ml solution containing 25 mm Tris, pH 8.0, 5 mm citrate or N-acetylaspartate, 5 mm ATP-Mg, 5 mm MgCl2, 10 mm DTT, 0.2 mg/ml bovine serum albumin and 5 × 10⁶ cpm l-[U-14C]glutamate. The reaction mixture was incubated for 4 h at 30 °C under stirring and then heated for 10 min at 80 °C. The mixture was centrifuged for 30 min at 18,000 × g to remove proteins, and the supernatant was treated with 2% (w/v) activated charcoal to remove nucleotides. The charcoal was filtered and the filtrate was loaded onto a 25 ml AG1-X8 Dowex column (Cl− form). The column was washed with 100 ml of water, a linear gradient of NaCl was applied (0 to 1 m NaCl in 300 ml), and fractions (5 ml) were collected. Fractions containing radioactivity corresponding to BCG or NAAG were pooled, concentrated to 2 ml in a lyophilizer, and freed from NaCl by filtration on a Bio-Gel P2 (Bio-Rad) column (50 cm × 1.0 cm) equilibrated with water.
Modeling of the Binding Mode of BCG in the GCP3 Active Site
A model for the β-citrylglutamate ligand was made based on a description of the covalent structure of the molecule using the PRODRG server (30). The GCP3-BCG complex model was made using the PyMOL molecular graphics system (31) starting from the PDB entry 3FF3. Protein side chains and BCG functional groups were adjusted to minimize steric clashes and optimize the hydrogen bonding network.
RESULTS
Purification and Characterization of BCG Hydrolase from Mouse Testes
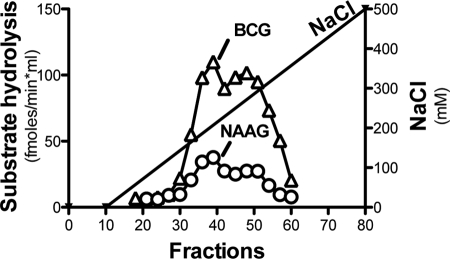
During its purification and its characterization, BCG hydrolase was assayed through the release of [14C]glutamate from radiolabeled β-citryl-l-[U-14C]glutamate prepared enzymatically with RIMKLB (see “Materials and Methods”). BCG hydrolase was purified from a mouse testis extract. Most (>90%) of the activity was pelleted upon centrifugation and could be solubilized with 5% Triton X-100, in agreement with the fact that BCG hydrolase is membrane-bound (22). Consistent with previous reports, we found that BCG hydrolase was strictly dependent on the addition of metals: Mn2+ and Ca2+ stimulated the activity more than Co2+ and Mg2+, whereas Zn2+ had no stimulatory effect (not shown) (22). A testis membrane extract solubilized with Triton X-100 was chromatographed on DEAE-Sepharose (not shown) and Q-Sepharose, and BCG hydrolase activity was measured in the presence of 1 mm Mn2+. As shown in Fig. 1, the BCG hydrolase activity was eluted from the Q-Sepharose column with the salt gradient. To check for the specificity of the enzymatic preparation, we also measured NAAG hydrolase activity in the same ionic condition (1 mm Mn2+) and found, surprisingly, a substantial NAAG hydrolase activity that coeluted perfectly with the BCG hydrolase activity. Neither NAAG hydrolase activity nor BCG hydrolase activity could be detected when Mn2+ was omitted from the assay medium. The perfect co-elution of the BCG hydrolase and NAAG hydrolase activities suggested that BCG hydrolase was endowed with NAAG hydrolase activity, although it did not discard the possibility that this NAAG hydrolase activity was contributed by a contaminating peptidase present in this partially purified preparation.
FIGURE 1.
Purification of BCG hydrolase from mouse testis on Q-Sepharose. BCG hydrolase was purified from a mouse testes membrane extract solubilized with Triton X-100 and was chromatographed on DEAE-Sepharose (not shown) and Q-Sepharose (this figure). Proteins were eluted in a NaCl gradient and BCG hydrolase and NAAG hydrolase activities were measured in the presence of 1 mm Mn2+.
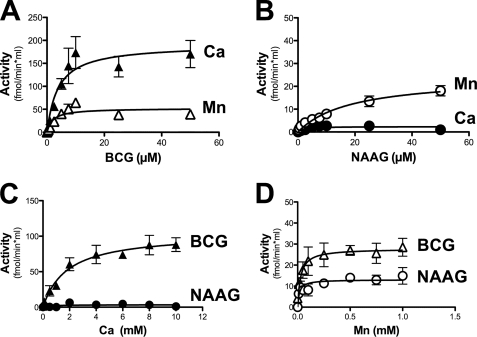
The metal dependence and substrate specificity of partially purified BCG hydrolase was studied in more details and the results are represented in Fig. 2. When assayed in the presence of 1 mm Mn2+, the enzyme displayed a lower Km (2.0 versus 18.7 μm) and a higher Vmax (52 versus 24 fmol/min/ml of purified enzyme preparation) for BCG than for NAAG. In the presence of 5 mm Ca2+, the Vmax for BCG was increased 4-fold, amounting to 192 fmol/min/ml, and the Km was unchanged, whereas no NAAG hydrolysis was observed (Fig. 2, panels A and B), indicating that the enzyme was specific for BCG under this condition. A study of the metal dependence (Fig. 2, panels C and D; assayed in the presence of 5 μm substrate) showed that the BCG hydrolase activity was undetectable in the absence of added Me2+. Mn2+ and Ca2+ half-maximally stimulated the activity at concentrations of 25 μm and 1.8 mm, respectively. Mn2+ stimulated the NAAG hydrolase activity with a Ka of 16 μm, whereas Ca2+ had no effect on this activity at any of the concentrations tested (from 0.1 to 10 mm).
FIGURE 2.
Kinetic properties of BCG hydrolase purified from mouse testis. Substrate saturation curve for BCG (A) and NAAG (B), assayed in the presence of either 5 mm Ca2+ or 1 mm Mn2+. Metal saturation curve for Ca2+ (C) and Mn2+(D) assayed in the presence of 5 μm substrate. Error bars, S.D. of two independent experiments.
The partially purified preparation was next chromatographed on a ConA-Sepharose column, which retains glycans. The BCG hydrolase activity was found to be retained on this column and to be eluted from it with a methylglucose gradient, thus confirming that it is a glycosylated protein (not shown). Treatment with PNGase, which removes N-glycans, caused a complete loss of BCG hydrolase activity (results not shown), indicating that N-glycosylation is important for activity, in disagreement with previous reports (22). Finally, after purification on ConA-Sepharose, the BCG hydrolase preparation was chromatographed on a Superdex S-200 gel filtration column in the presence of molecular weight markers. An apparent molecular mass of 200,000 Da was calculated from its elution profile (not shown).
Taken together, these results indicated that the properties of BCG hydrolase (its activity on NAAG, the fact that it is membrane bound and glycosylated, sensitive to endo-glycosidase treatment) were similar to GCP2 or GCP3. MS-analysis of tryptic fragments of the most purified Superdex S-200 gel-filtration fraction disclosed the presence of peptides corresponding to GCP3, although not of GCP2 (not shown), suggesting that GCP3 was a potential candidate. This prompted us to compare the tissue distribution of BCG hydrolase and NAAG hydrolase activities with the distributions of GCP2 and GCP3 mRNAs.
Comparison of the Tissue Distributions of BCG Hydrolase and NAAG Hydrolase Activities with the Tissue Distribution of GCP3 and GCP2 mRNAs in Mouse
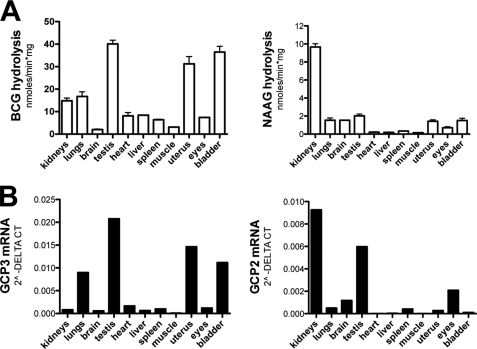
When measured in the presence of near-physiological concentrations of Ca2+ (2.5 mm CaCl2) and Mg2+ (1 mm MgCl2), the BCG hydrolase activity was highest in testis, uterus, and bladder, intermediate in kidneys and lung, and very low, if detectable, in liver, heart, spleen, eyes, and brain (Fig. 3, panel A, left). The distribution of the NAAG hydrolase activity, measured under the same ionic conditions was distinctly different from the BCG hydrolase profile, the highest activity being found in the kidneys and very low levels in other tissues (Fig. 3, panel A, right). When enzymatic assays were performed in the presence of 1 mm Mn2+, the BCG hydrolase and NAAG hydrolase distribution profiles were not very different from each other (not shown), presumably because BCG hydrolase acted then also on NAAG.
FIGURE 3.
A, tissue distribution of BCG hydrolase and NAAG hydrolase activities in mouse. BCG hydrolase and NAAG hydrolase activities were measured in the presence of 120 mm NaCl, 2.5 mm CaCl2, 1 mm MgCl2, and 5 μm substrate. Error bars, S.D. of two independent experiments. B, RT-QPCR distribution of GCP2 and GCP3 (mean of duplicates from three different animals).
The tissue distributions of the GCP2 and GCP3 mRNAs were determined by quantitative RT-PCR. As evident from panel B (left) (Fig. 3), the tissue distribution of the GCP3 mRNA, but not that of GCP2 mRNA (panel B, right), matched the tissue distribution of BCG hydrolase, to the possible exception of liver. Taken together, these findings indicated that BCG hydrolase was likely to correspond to GCP3.
Expression and Characterization of Recombinant GCP2 and GCP3
To test the ability of GCP2 and GCP3 to hydrolyze BCG and NAAG, these proteins were expressed in HEK cells, either as intact membrane-bound enzymes (not shown) or as soluble forms in which the N terminus membrane anchor had been removed. Briefly, the first ∼40 amino acids of GCP2 and GCP3 comprise the signal peptide as well as a hydrophobic trans-membrane helix that anchors these proteins on the external face of the plasma membrane. To produce soluble, fully glycosylated recombinant GCPs, the first ∼40 amino acids were replaced by an artificial amino acid sequence comprising the signal peptide of human EPO (erythropoietin) receptor followed, after the signal peptidase cleavage site, by an HA epitope (see “Materials and Methods” and Ref. 28). Recombinant soluble GCPs were collected from the culture medium, concentrated and chromatographed onto a Superdex S-200 gel-filtration column and their enzymatic activities were studied (Figs. 4 and 5). SDS-PAGE analysis indicated that the recombinant GCPs represented ∼1–5% of total proteins.
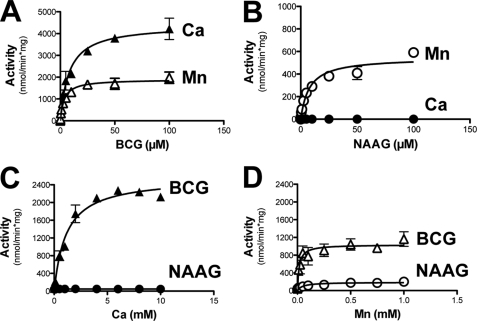
FIGURE 4.
Kinetic properties of recombinant GCP3. Substrate saturation curve for BCG (A) and NAAG (B), assayed in the presence of either 5 mm Ca2+ or 1 mm Mn2+. Metal saturation curve for Ca2+ (C) and Mn2+(D) assayed in the presence of 5 μm substrate. Error bars, S.D. of two independent experiments.
FIGURE 5.
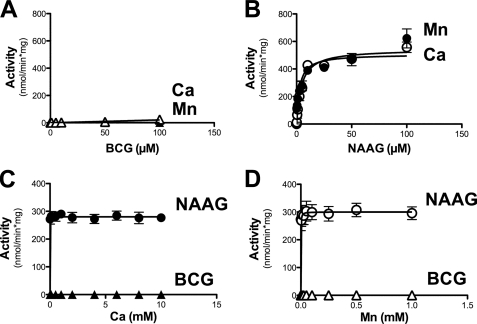
Kinetic properties of recombinant GCP2. Substrate saturation curve for BCG (A) and NAAG (B), assayed in the presence of either 5 mm Ca2+ or 1 mm Mn2+. Metal saturation curve for Ca2+ (C) and Mn2+(D) assayed in the presence of 5 μm substrate. Error bars, S.D. of two independent experiments.
As shown in Fig. 4, recombinant GCP3 displayed a dual hydrolase activity on both BCG and NAAG in the presence of Mn2+, but hydrolyzed only BCG in the presence of Ca2+. When assayed in the presence of 1 mm Mn2+, the Km of recombinant GCP3 for BCG was 3.5 μm and the Vmax, 1900 nmol/min/mg; for NAAG the Km was 7.6 μm and the Vmax, 550 nmol/min/mg. In the presence of Ca2+, the Vmax for BCG hydrolysis was increased up to 4400 nmol/min/mg whereas the Km was unchanged, and no NAAG hydrolysis could be measured (Fig. 4, panels A and B). The metal dependence of GCP3 showed that this enzyme was almost inactive in the absence of added divalent cation (∼40 nmol/min/mg). Mn2+ stimulated the BCG hydrolase activity half-maximally at a concentration of 16 μm and Ca2+ at 1.1 mm. The NAAG hydrolase activity of GCP3 was stimulated by Mn2+, but not by Ca2+ (Fig. 4, panels C and D). Mg2+ stimulated very poorly the activity of GCP3: activities of 96 nmol/min/mg and of 54 nmol/min/ml were measured on BCG and on NAAG, at a 5 mm concentration of this metal (not shown). Taken together, these characteristics are very similar to those reported above for BCG hydrolase purified from mouse testis and indicated that BCG hydrolase is GCP3.
Recombinant GCP2 (Fig. 5) displayed activity toward NAAG with a Vmax of 542 nmol/min/mg and a Km of 4.3 μm (panel B), however it did not hydrolyze BCG, even in the presence of Mn2+ or Ca2+ (panel A). Contrasting with GCP3, GCP2 activity was not stimulated by the addition of divalent cations (Fig. 5, panels C and D). Similar results were obtained with the intact (membrane-bound) GCP2 and GCP3 enzymes, indicating that the removal of the first 40 amino acids did not influence the kinetic properties of these enzymes (not shown).
Effect of Mutation of the Homologous Residues GCP2-Asn519 and GCP3-Ser509
As previously noted by others, the major difference between the catalytic sites of GCP2 and GCP3 is the replacement of a conserved asparagine (Asn-519) in GCP2 by a conserved serine (Ser-505) in GCP3 (18). Structural modeling of β-citrylglutamate in the catalytic site of GCP2 and GCP3 (see “Discussion”) suggested that the bulkier asparagine could impede proper binding of β-citrylglutamate to the GCP2 binding site, explaining that the latter enzyme was not able to hydrolyze the citrate derivative. It should be noted also that Asn-519 in GCP2 binds an Asp residue (Asp-453) that coordinates Me2.
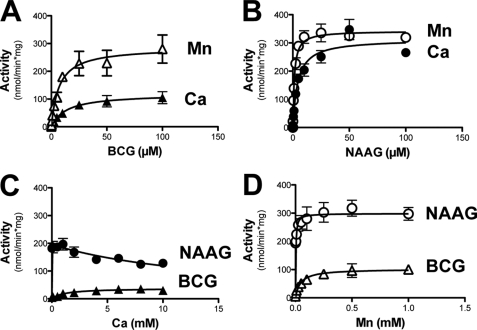
In agreement with our predictions, replacement of Asn-519 by a serine in GCP2 (see Fig. 6) made this enzyme able to hydrolyze BCG in a Ca2+- and Mn2+-dependent manner, though in this case the activity was markedly (10–60-fold) lower than with GCP3. The capacity of GCP2 to hydrolyze NAAG was largely unchanged by the mutation, except that it was now somewhat sensitive to the effect of divalent cations. The mutated form of GCP2, which was able to hydrolyze NAAG in the absence of added divalent cation (as does wild-type GCP2), was stimulated by Mn2+ (like GCP3, but unlike GCP2) and inhibited by Ca2+. This inhibitory effect was not seen with wild-type GCP2.
FIGURE 6.
Kinetic properties of recombinant GCP2-N519S mutant. Substrate saturation curve for BCG (A) and NAAG (B), assayed in the presence of either 5 mm Ca2+ or 1 mm Mn2+. Metal saturation curve for Ca2+ (C) and Mn2+(D) assayed in the presence of 5 μm substrate. Error bars, S.D. of two independent experiments.
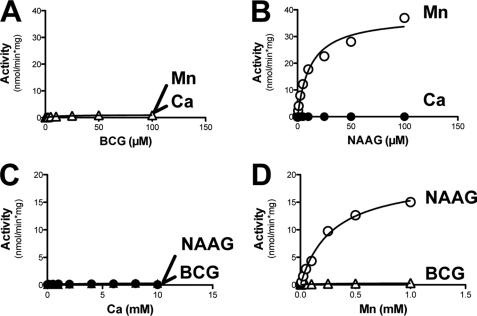
The reciprocal mutation, i.e. the replacement of Ser-509 by an Asn in GCP3 cancelled its activity on BCG, but did not completely suppress its activity on NAAG (Fig. 7). Unlike what was observed with GCP2, the activity on NAAG was completely dependent on the presence of Mn2+. It could not be evoked with Ca2+.
FIGURE 7.
Kinetic properties of recombinant GCP3-S509N mutant. Substrate saturation curve for BCG (A) and NAAG (B), assayed in the presence of either 5 mm Ca2+ or 1 mm Mn2+. Metal saturation curve for Ca2+ (C) and Mn2+(D) assayed in the presence of 5 μm substrate. Error bars, S.D. of two independent experiments.
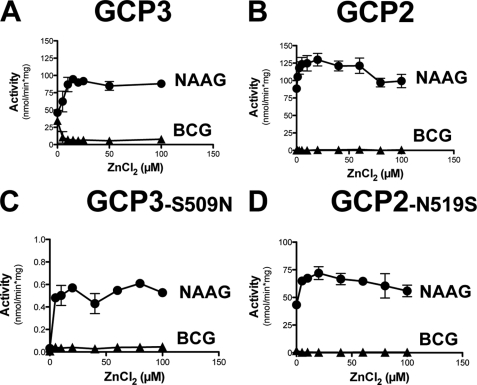
As Zn2+ appears to be critical for the activity of GCP2 and GCP3 (see “Discussion”), we also tested the effect of the addition of Zn2+ on the activity of all four enzymes, using both NAAG and BCG as substrates (Fig. 8). Addition of Zn2+ did not affect the activity of GCP2 on NAAG, and did not evoke any activity of this enzyme on BCG. Zn2+ stimulated the activity of GCP3 and GCP2-N519S on NAAG but strongly inhibited their activity on BCG. In the case of GCP3-S509N, it stimulated the activity on NAAG but did not evoke any activity on BCG.
FIGURE 8.
Effect of zinc on the NAAG hydrolase an BCG hydrolase activities of GCP3, GCP2, GCP2-N519S, GCP3-S509N. Metal saturation curve for Zn2+ assayed in the presence of 1 μm substrate. Error bars, S.D. of two independent experiments.
DISCUSSION
Identification of β-Citrylglutamate Hydrolase as GCP3
A major conclusion of the present work is that β-citrylglutamate hydrolase corresponds to GCP3. This is based on the finding that BCG hydrolase purified from mouse testis and recombinant GCP3 display very similar kinetic properties: both of them act with high affinity on BCG in the presence of Ca2+ and to a lesser extent of Mn2+, but not in the presence of Zn2+. Both of them do not act on NAAG in the presence of Ca2+, but well in the presence of Mn2+ or Zn2+. Furthemore, they show affinities for substrates and for divalent cations that are in the same range. In addition the tissue distribution of BCG hydrolase activity is in good agreement with that of the GCP3 mRNA and GCP3 was present in the purified preparation of BCG hydrolase, as determined by tandem mass spectrometry. These findings solve therefore the riddle of the function of GCP3, which was initially identified as a NAAG hydrolase. Its low activity on this substrate, but substantial activity on BCG, in the presence of physiological concentrations of divalent cations, indicate that a major function of GCP3 is to hydrolyze BCG.
GCP2 and GCP3 differ from each other by their substrate specificity and their metal dependence and these two properties are linked to each other. Major features of the kinetic properties of the two enzymes are the following: 1) GCP2 acts on NAAG but not on BCG, whatever the ionic condition; furthermore this enzyme is insensitive to added metals. 2) GCP3 acts preferentially on BCG in the presence of Ca2+; its activity on this substrate is lower in the presence of Mn2+ and completely cancelled in the presence of Zn2+. The latter two ions stimulate the activity on NAAG. 3) Replacement of Asn-519 by a serine in GCP2 makes this enzyme able to hydrolyze BCG and renders it sensitive to the addition of metals. 4) Replacement of the homologous residue Ser-509 in GCP3 by an asparagine suppresses its ability to hydrolyze BCG. In the next section, we will try to explain these properties on the basis of the structural features of the catalytic site of GCP2 and GCP3.
Role of a Heterometallic Cluster in the Hydrolysis of BCG
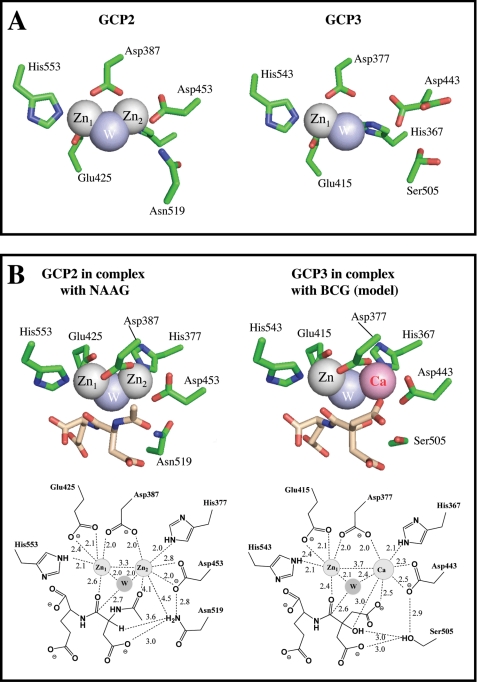
We show a structural model of the catalytic site of GCP2 and GCP3 (Fig. 9). Both enzymes contain a two-zinc cluster that serves to activate a water molecule (19). This cluster is held by five residues, which are strictly conserved between GCP2 and GCP3. There are however, subtle differences between the catalytic sites of GCP2 and GCP3, most particularly the fact that the occupancy of the Zn2 atom is only 50–70% in GCP3 (20), as compared with 100% in GCP2 (19). This means that some Zn1-Zn2 clusters in GCP3 have lost Zn2 (Fig. 9A), which can therefore be potentially replaced by another divalent cation such as Ca2+ (Fig. 9B) or Mn2+ (not shown). This, in our view, explains the fact that GCP2 is completely insensitive to metals, whereas GCP3 is dependent on the addition of divalent cations for its activity. The finding that GCP3 activity on BCG is higher with Ca2+ than with Mn2+ and nil in the presence of added Zn2+ leads us to propose that this activity is optimal when a Zn-Ca cluster forms, intermediate with a Zn-Mn cluster and nil with a Zn-Zn cluster. Reciprocally, a Zn-Ca cluster does not support activity on NAAG, in contrast to Zn-Mn or Zn-Zn clusters. The kinetic results obtained with the two mutants can also be rationalized on the basis of this hypothesis.
FIGURE 9.
Structure of the catalytic site of GCP2 and GCP3. Panel A shows the metal cluster of the GCP2 ligand-free structure (PDB 2OOT) and of GCP3 in complex with glutamate (not depicted, PDB 3FF3). For the sake of clarity and to emphasize its low occupancy, Zn2 is not depicted in the GCP3 structure. Noteworthy, Asp-443 which coordinates Zn2 in the GCP3 structure occupies two positions, only one of which allows coordination with the Zn2 atom, in good agreement with the lower occupancy of this metal. Ser-509 also displays two conformations. In marked contrast, the Zn2 atom occupancy is 100% in the ligand-free GCP2 structure and no rotamers are observed within the amino acids constituting the catalytic site in this case. Panel B shows GCP2 in complex with NAAG (PDB 3BXM) and a modeling of GCP3 complexed with BCG and the Zn-Ca cluster. The distances between the two metals are the actual distances observed by x-ray crystallography (20). In GCP2 structures the two zinc atoms are separated by 3.3 Å, each Zn being equally distant from the catalytic water molecule (2.0 Å), whereas in GCP3 the distances between the two metals is 3.7 Å, and the distance between Me2 and the catalytic water (2.4 Å) is larger than the distance between Zn1 and this water (2.1 Å), in agreement with a bulkier calcium occupying the position of Me2.
Attempts at modeling NAAG and β-citrylglutamate in the catalytic sites of GCP2 and GCP3 indicate that the regions of BCG and NAAG that differ between these two molecules are close to Me2. Our suggestion is that the replacement of the (neutral) acetamide moiety of NAAG by the (charged) carboxymethyl group of BCG adds a negative charge in the neighborhood (2.8 Å) of Me2. This charged group will tend to bind to Me2, causing more distortions if Me2 is Zn than if it is Ca or Mn. The latter two ions are indeed known to bind preferentially more ligands in protein structures (6 or even 7 in the case of Ca) than what Zn usually does (4 or 5 ligands) (32).
Role of Ser-509 in GCP3
Replacing Asn-519 in GCP2 by Ser-509 in GCP3 is also critical to allow hydrolysis of BCG, as indicated by site-directed mutagenesis. A potential explanation may be that the bulkier side chain of Asn causes a problem of steric hindrance with the hydroxyl group of β-citrylglutamate (which is replaced by a hydrogen in NAAG). However, replacing Asn-519 in GCP2 by a serine has also a marked effect on the metal dependence of this enzyme, as the mutated form of GCP2 is stimulated by Ca2+ (for its activity on BCG), by Mn2+ (for its activity on BCG and NAAG) and Zn2+ (for its activity on NAAG). This effect of Asn-519 replacement is likely ascribable to the fact that Asn-519 binds Asp-453, one of the residues that bind Zn2. Thus, replacement of Asn-519 by a serine facilitates the replacement of Zn2 by a divalent cation (e.g. Ca2+) that supports activity on BCG. What may argue against this last interpretation is the fact that making the converse replacement in GCP3 does not restore the high affinity for Zn2+ whereas it does suppress the activity on BCG. One has to admit, however, that this lack of restoration of high metal affinity means that other subtle differences between the catalytic sites of GCP2 and GCP3 play a role in determining the metal affinity.
Physiological Considerations
The identification of BCG hydrolase as GCP3 implies that its catalytic site is oriented toward the extracellular environment. The concentration of Mn2+ is extremely low in serum (∼25 nm) (33), and presumably in extracellular fluids, whereas that of Ca2+ amounts to about 1.5 mm. This means that under physiological conditions, GCP3 will only function as a BCG hydrolase and not as a NAAG hydrolase.
Another consequence of the extracellular orientation of the catalytic site of BCG hydrolase is that BCG is a molecule that is most likely secreted, like NAAG. Further work is needed to identify the mechanisms by which BCG can be released and under which circumstances. Co-occurrence of the mRNA encoding BCG hydrolase (GCP3) and BCG synthase (RIMKLB) is found in testis, eye, fertilized eggs, oocytes, and ovaries (our results; BioGPS database (34)), indicating that β-citrylglutamate plays a role in these organs or cells. Interestingly, the gene encoding BCG hydrolase is expressed in the ovarian tissue in an ovulation-dependent manner (35). In lung, the expression of BCG synthase (RIMKLB) appears to be remarkably low, whereas GCP3 is abundantly expressed in this tissue, raising the possibility that other, yet unidentified compounds may be substrates of GCP3.
Ontogeny
The GCP2 and GCP3 genes arose through the duplication of an ancestral gene after the fish radiation. Danio rerio has only one copy, which comprises a serine at the position equivalent to Ser-509 in GCP3 or Asn-519 in GCP2. This suggests that this primitive enzyme is mostly a BCG hydrolase, in agreement with the observation that β-citrylglutamate is much more abundant than NAAG in fishes (3). Both GCP2 and GCP3, with the characteristic serine or asparagine residue, are found in amphibians, birds and mammals, suggesting that these species possess two distinct enzymes to hydrolyze NAAG and BCG. This is consistent with the finding that both NAAG and BCG are present in these species.
CONCLUSION
In conclusion, we have identified the enzyme that hydrolyzes BCG as GCP3, an enzyme which was previously thought to act on NAAG, and which we now show to act poorly on this substrate under physiological ionic conditions. As GCP3 is an ectoenzyme, these findings point to the fact that BCG has to be excreted from cells to be hydrolyzed. This may suggest that BCG plays its physiological function outside cells, rather than inside cells as had previously been suggested. The remarkable parallelism between the synthesis and the degradation of NAAG and β-citrylglutamate argues for these molecules playing similar functions, but in different cell types or organs.
Acknowledgment
We thank Geneviève Connerotte for excellent technical assistance.
This work was supported by grants from the Interuniversity Attraction Poles Program-Belgian Science Policy (Networks P6/05 and P6/28), by the DIANE Center of Excellence program of the Région Wallonne, by the Fonds de la Recherche Scientifique Médicale, and by a grant from ASCO industries (to E. V. S.).
Tahay, G., Wiame, E., Tyteca, D., Courtoy, P. J., and Van Schaftingen, E. (2011) in press.
- BCG
- β-citrylglutamate
- NAAG
- N-acetyl-aspartylglutamate
- GCP
- glutamate carboxypeptidase
- NAA
- N-acetyl-aspartate.
REFERENCES
- 1. Miyake M., Kakimoto Y., Sorimachi M. (1978) Biochim. Biophys. Acta 544, 656–666 [DOI] [PubMed] [Google Scholar]
- 2. Miyake M., Kakimoto Y. (1981) J. Neurochem. 37, 1064–1067 [DOI] [PubMed] [Google Scholar]
- 3. Miyake M., Kakimoto Y., Sorimachi M. (1981) J. Neurochem. 36, 804–810 [DOI] [PubMed] [Google Scholar]
- 4. Narahara M., Tachibana K., Adachi S., Iwasa A., Yukii A., Hamada-Kanazawa M., Kawai Y., Miyake M. (2000) Biol. Pharm. Bull. 23, 1287–1292 [DOI] [PubMed] [Google Scholar]
- 5. Miyake M., Kume S., Kakimoto Y. (1982) Biochim. Biophys. Acta 719, 495–500 [DOI] [PubMed] [Google Scholar]
- 6. Hamada-Kanazawa M., Kouda M., Odani A., Matsuyama K., Kanazawa K., Hasegawa T., Narahara M., Miyake M. (2011) Biol. Pharm. Bull 33, 729–737 [DOI] [PubMed] [Google Scholar]
- 7. Narahara M., Hamada-Kanazawa M., Kouda M., Odani A., Miyake M. (2010) Biol. Pharm. Bull 33, 1938–1943 [DOI] [PubMed] [Google Scholar]
- 8. Neale J. H., Bzdega T., Wroblewska B. (2000) J. Neurochem 75, 443–452 [DOI] [PubMed] [Google Scholar]
- 9. Chopra M., Yao Y., Blake T. J., Hampson D. R., Johnson E. C. (2009) J. Pharmacol. Exp. Ther. 330, 212–219 [DOI] [PubMed] [Google Scholar]
- 10. Fricker A. C., Mok M. H., de la Flor R., Shah A. J., Woolley M., Dawson L. A., Kew J. N. (2009) Neuropharmacology 56, 1060–1067 [DOI] [PubMed] [Google Scholar]
- 11. Neale J. H. (2011) J. Neurochem., in press [DOI] [PMC free article] [PubMed] [Google Scholar]
- 12. Robinson M. B., Blakely R. D., Couto R., Coyle J. T. (1987) J. Biol. Chem. 262, 14498–14506 [PubMed] [Google Scholar]
- 13. Halsted C. H., Ling E. H., Luthi-Carter R., Villanueva J. A., Gardner J. M., Coyle J. T. (1998) J. Biol. Chem. 273, 20417–20424 [DOI] [PubMed] [Google Scholar]
- 14. Pinto J. T., Suffoletto B. P., Berzin T. M., Qiao C. H., Lin S., Tong W. P., May F., Mukherjee B., Heston W. D. (1996) Clin. Cancer Res. 2, 1445–1451 [PubMed] [Google Scholar]
- 15. Carter R. E., Feldman A. R., Coyle J. T. (1996) Proc. Natl. Acad. Sci. U.S.A. 93, 749–753 [DOI] [PMC free article] [PubMed] [Google Scholar]
- 16. Tsukamoto T., Wozniak K. M., Slusher B. S. (2007) Drug Discov. Today 12, 767–776 [DOI] [PubMed] [Google Scholar]
- 17. Pangalos M. N., Neefs J. M., Somers M., Verhasselt P., Bekkers M., van der Helm L., Fraiponts E., Ashton D., Gordon R. D. (1999) J. Biol. Chem. 274, 8470–8483 [DOI] [PubMed] [Google Scholar]
- 18. Hlouchová K., Barinka C., Klusák V., Sácha P., Mlcochová P., Majer P., Rulísek L., Konvalinka J. (2007) J. Neurochem. 101, 682–696 [DOI] [PubMed] [Google Scholar]
- 19. Mesters J. R., Barinka C., Li W., Tsukamoto T., Majer P., Slusher B. S., Konvalinka J., Hilgenfeld R. (2006) EMBO J. 25, 1375–1384 [DOI] [PMC free article] [PubMed] [Google Scholar]
- 20. Hlouchova K., Barinka C., Konvalinka J., Lubkowski J. (2009) FEBS J. 276, 4448–4462 [DOI] [PubMed] [Google Scholar]
- 21. Miyake M., Innami T., Kakimoto Y. (1983) Biochim. Biophys. Acta 760, 206–214 [DOI] [PubMed] [Google Scholar]
- 22. Asakura M., Nagahashi Y., Hamada M., Kawai M., Kadobayashi K., Narahara M., Nakagawa S., Kawai Y., Hama T., Miyake M. (1995) Biochim. Biophys. Acta 1250, 35–42 [DOI] [PubMed] [Google Scholar]
- 23. Barinka C., Sácha P., Sklenár J., Man P., Bezouska K., Slusher B. S., Konvalinka J. (2004) Protein Sci. 13, 1627–1635 [DOI] [PMC free article] [PubMed] [Google Scholar]
- 24. Collard F., Stroobant V., Lamosa P., Kapanda C. N., Lambert D. M., Muccioli G. G., Poupaert J. H., Opperdoes F., Van Schaftingen E. (2010) J. Biol. Chem. 285, 29826–29833 [DOI] [PMC free article] [PubMed] [Google Scholar]
- 25. Wiame E., Tyteca D., Pierrot N., Collard F., Amyere M., Noel G., Desmedt J., Nassogne M. C., Vikkula M., Octave J. N., Vincent M. F., Courtoy P. J., Boltshauser E., van Schaftingen E. (2009) Biochem. J. 425, 127–136 [DOI] [PubMed] [Google Scholar]
- 26. Bradford M. M. (1976) Anal. Biochem. 72, 248–254 [DOI] [PubMed] [Google Scholar]
- 27. Maliekal P., Sokolova T., Vertommen D., Veiga-da-Cunha M., Van Schaftingen E. (2007) J. Biol. Chem. 282, 31844–31851 [DOI] [PubMed] [Google Scholar]
- 28. Constantinescu S. N., Keren T., Socolovsky M., Nam H., Henis Y. I., Lodish H. F. (2001) Proc. Natl. Acad. Sci. U.S.A. 98, 4379–4384 [DOI] [PMC free article] [PubMed] [Google Scholar]
- 29. Rzem R., Veiga-da-Cunha M., Noël G., Goffette S., Nassogne M. C., Tabarki B., Schöller C., Marquardt T., Vikkula M., Van Schaftingen E. (2004) Proc. Natl. Acad. Sci. U.S.A. 101, 16849–16854 [DOI] [PMC free article] [PubMed] [Google Scholar]
- 30. Schüttelkopf A. W., van Aalten D. M. (2004) Acta Crystallogr. D Biol. Crystallogr. 60, 1355–1363 [DOI] [PubMed] [Google Scholar]
- 31. The PyMOL Molecular Graphics System (2010) Version 1.3, Schrödinger, LLC [Google Scholar]
- 32. Harding M. M. (2001) Acta Crystallogr. D Biol. Crystallogr. 57, 401–411 [DOI] [PubMed] [Google Scholar]
- 33. Michalke B., Nischwitz V. (2010) Anal. Chim. Acta 682, 23–36 [DOI] [PubMed] [Google Scholar]
- 34. Wu C., Orozco C., Boyer J., Leglise M., Goodale J., Batalov S., Hodge C. L., Haase J., Janes J., Huss J. W., 3rd, Su A. I. (2009) Genome Biol. 10, R130 [DOI] [PMC free article] [PubMed] [Google Scholar]
- 35. Hourvitz A., Gershon E., Hennebold J. D., Elizur S., Maman E., Brendle C., Adashi E. Y., Dekel N. (2006) J. Endocrinol 188, 531–548 [DOI] [PubMed] [Google Scholar]


