

Background: Ouabain binds at the permeation pathway of the Na+/K+ ATPase.
Results: We have identified two binding sites for ouabain along the ion conductive pathway of the Na+/K+ pump that are mutually exclusive and differ in their affinities by about an order of magnitude.
Conclusion: Ouabain reaches its high affinity binding site at the inner end of the permeation pathway by a sequential mechanism.
Significance: This work unifies all available functional and structural data on the interactions of ouabain with the Na+/K+ pump.
Keywords: ATPases, Biophysics, Fluorescence Resonance Energy Transfer (FRET), H+ ATPase, Membrane Biophysics, Membrane Proteins
Abstract
The Na+/K+ ATPase is an almost ubiquitous integral membrane protein within the animal kingdom. It is also the selective target for cardiotonic derivatives, widely prescribed inhibitors for patients with heart failure. Functional studies revealed that ouabain-sensitive residues distributed widely throughout the primary sequence of the protein. Recently, structural work has brought some consensus to the functional observations. Here, we use a spectroscopic approach to estimate distances between a fluorescent ouabain and a lanthanide binding tag (LBT), which was introduced at five different positions in the Na+/K+ ATPase sequence. These five normally functional LBT-Na+/K+ ATPase constructs were expressed in the cell membrane of Xenopus laevis oocytes, operating under physiological internal and external ion conditions. The spectroscopic data suggest two mutually exclusive distances between the LBT and the fluorescent ouabain. From the estimated distances and using homology models of the LBT-Na+/K+ ATPase constructs, approximate ouabain positions could be determined. Our results suggest that ouabain binds at two sites along the ion permeation pathway of the Na+/K+ ATPase. The external site (low apparent affinity) occupies the same region as previous structural findings. The high apparent affinity site is, however, slightly deeper toward the intracellular end of the protein. Interestingly, in both cases the lactone ring faces outward. We propose a sequential ouabain binding mechanism that is consistent with all functional and structural studies.
Introduction
Throughout their lives, animal cells maintain an imbalance of the concentrations of Na+ and K+ between their internal and external environments. These ionic gradients are used in cellular processes that are essential for cell survival. On the one hand, the K+ gradient maintains the negative resting potential. On the other hand, the Na+ gradient is used by most cells to transport nutrients and metabolic substrates inside the cell, to extrude deleterious excess of intracellular ions, like Ca2+, and in excitable cells it allows the generation of action potentials. More than 40% of the energy produced in an animal cell is consumed by the Na+/K+ ATPase to maintain the Na+ and K+ gradients.
The Na+/K+ ATPase is an integral membrane protein formed mainly by two subunits, α and β. The larger (∼1,000 amino acids) α subunit spans 10 times across the cell membrane and contains all of the necessary components for ion transport: the ion permeation pathway, the phosphorylation site, and the ATP binding domain (1, 2). The smaller β subunit (∼300 amino acids) spans once through the membrane to form a large extracellular structure that sits on top of the external surface of the α subunit. The β subunit is essential for trafficking and K+ transport (3, 4).
Mutations within the Na+/K+ ATPase have been implicated with human diseases like rapid-onset dystonia parkinsonism (5) and familial hemiplegic migraine (6–8). Clinically, however, the most important role of the Na+/K+ ATPase is being the target of cardiotonic steroids in heart failure patients, a practice in use for more than two centuries. It is for this reason that a vast body of work has been devoted to identify the binding site of these compounds (9–20), including the lately solved Na+/K+ ATPase crystal structures with a molecule of ouabain bound (21, 22). In these structures the Na+/K+ ATPase was crystallized in a state analogous to the E2.P(2K) (21) or in an E2-P state (22), and ouabain was either soaked after crystallization, or co-crystallized with the Na+/K+ ATPase. In both structures, ouabain sits in a cleft between transmembrane (TM)5 segments TM1, TM2, TM4, TM5, and TM6. Interestingly, many of these TMs have been implicated in the formation of the ion permeation pathway (23, 24), suggesting that ouabain might directly block access of ions to their binding sites.
Here, we investigate the site of ouabain binding in a fully functional Na+/K+ ATPase using lanthanide-based resonance energy transfer (LRET). In this technique, once a chelated Tb3+ is protected from collisional quenching it can be excited via an antenna with UV light (266 nm) to transfer energy to a nearby acceptor (25). If transfer of energy occurs, the luminescence of the donor is quenched following the Förster energy transfer theory that relates transfer efficiency with the distance between the donor and the acceptor. We have introduced, one at a time, five genetically encoded lanthanide-binding tags (LBTs) within the coding region of the Na+/K+ ATPase (26, 27). The acceptor is ouabain conjugated to a Bodipy dye (Bodipy-Fl Ouabain). The intensity decay of the acceptor when the donor is excited (sensitized emission; see “Experimental Procedures”) showed two exponential components, suggesting more than one position of the fluorescent probe. One component was weighted more than 80–95% of the signal, so it was designated as the high affinity binding site. Similarly, the smaller component weighing, 5–20%, was denoted as the low affinity binding site. Using these determinations, we estimated distances between these LBTs and the Bodipy-Fl Ouabain. Homology models of the five Na+/K+ ATPase constructs with LBT were generated to find possible dye positions compatible with the set of measured distances. For both affinity binding sites, the most likely positions for ouabain deduced from all available data situate the molecule along the permeation pathway of the Na+/K+ ATPase, as seen in the crystal structures (21, 22). In the low affinity binding site, ouabain occupies the same region of the permeation pathway as observed by x-ray crystallography. Interestingly, the position of the high affinity binding site differs. Our results suggest that the ouabain molecule sits deep in the channel. Further, in both positions the rhamnose moiety faces the intracellular end of the permeation pathway of the Na+/K+ ATPase, rather than the outwardly facing orientation shown in the crystal structures. We propose a sequential two-step binding mechanism that unifies all previous structural and functional data with our proposed binding site.
EXPERIMENTAL PROCEDURES
Na+/K+ ATPase Expression in Xenopus laevis Oocytes
The LBT (28) is a sequence of 17 amino acids (YIDTNNDGWYEGDELLA) with the Trp residue acting as an antenna to excite the chelated Tb3+. LBTs were inserted within the coding region of the squid α subunit of the Na+/K+ ATPase (26) using standard PCR techniques. All constructs were confirmed by sequencing the entire inserted cassette. A total of 12 LBTs were inserted along the five external transmembrane segment linkers. Only five of them expressed a functional LBT, and those were used in this study. They are defined as L1, L2, L3, L4, and L5 with LBT domains inserted immediately after positions 125, 134, 318, 324, and 988, respectively. cRNAs were synthesized using a T7 promoter cRNA synthesis kit (Ambion). Xenopus laevis oocytes were injected with 50 nl of cRNAs of the squid Na+/K+ ATPase α and β subunits premixed in a molar ratio of 1:1 (concentration of the α subunit ranged from 1 to 3 μg/μl). Oocytes were allowed 3–5 days to express the squid Na+/K+ ATPase before attempting recordings.
LRET Measurements
The advantages of using LRET as opposed to regular fluorescence resonance energy transfer has been discussed in detail by Selvin (25). Briefly, the main advantages are (i) the isotropic emission of Tb3+ that allows the use of an orientation factor κ2 = 2/3 with a maximum error of ±10% in distance estimations, (ii) the spiked spectral emission of Tb3+ that shows dark regions where the acceptor emission is measured without donor contamination, and (iii) the slow decay of Tb3+ emission that allows clear time separation of the sought luminescence from the undesired fast fluorescence. LRET measurements were performed with an in-house built setup, as described before (27). The donor decay was measured with a long pass filter (HQ465lp; Chroma), and the sensitized emission was measured with a bandpass filter coinciding with the emission of Bodipy and the first dark region of the Tb3+ emission (D520/25m; Chroma). For each oocyte expressing a LBT construct, we first determined the emission decay of the donor in a solution containing 10 μm Tb3+ (TbCl3; Sigma-Aldrich). Tb3+ bound to LBT was excited via its Trp residue by a 9-ns pulse at 266 nm of a quadrupled YAG laser (Indi-YAG; Spectra-Physics). The more prominent (60–80%) slower component of the decay (τD) corresponds to the luminescence decay from the donor bound to LBT (27, 28). Next, 10 μm Bodipy-Fl Ouabain (Invitrogen) was added to the solution. Because Bodipy-Fl absorbs at about 500 nm, it could potentially accept energy from an excited Tb3+ resulting in a faster decay of the donor emission (τDA). In LRET measurements, the efficiency of energy transfer may be determined from the donor lifetime luminescence as E = 1 − τDA/τD. Alternatively, it can be determined from τD and the decay time constant of the sensitized emission (fluorescence excited by energy transfer) of the acceptor τSEA as E = 1 − τSEA/τD (25). We chose the latter because τSEA is identical to τDA of only the donors that are transferring, thus excluding pump molecules that had no acceptor. τDA and τSEA are identical because the Bodipy-Fl fluorescence emission is in nanoseconds, therefore any slow (millisecond) fluorescence decay from the acceptor represents the lifetime of the donor in the presence of the acceptor. We measured the lifetime of the acceptor within the first dark region of Tb3+ emission, therefore the intensity decay could be detected without contamination from the donor emission. In all five α subunit Na+/K+ ATPase-LBT constructs, the presence of Bodipy-Fl Ouabain produced an acceleration of the prominent slow component of the donor emission decay that could be followed in the acceptor channel as sensitized emission.
Analysis of LRET Measurements
The sensitized emission decays were well fit with the sum of three exponentials: Y = Y0 + A1*exp(−t/τ1) + A2*exp(−t/τ2) + A3*exp(−t/τ3).
Fits were performed with Origin (OriginLab). A component with a very fast time-constant (∼0.05 ms) was present in all decays, which has been identified as a combination of an electronic artifact caused by the gate pulse of the gated PMT (Hamamatsu) and residual plus delayed fluorescence. The other two components of the sensitized emission were present in all measured LRET signals from LBT containing Na+/K+ ATPases. These two components reflect transfer to Bodipy-Fl, yet localized at two different positions. The appearance of two components with well separated time constants shows that both locations are not occupied at the same time and that their occupancy by Bodipy-Fl has to be mutually exclusive. In all cases there was one prominent component (80–95%) and a component of small amplitude (5–20%). These values take into account the fact that the amplitudes of the transfer components scale differently in the quenched donor decay compared with the sensitized emission because in the latter the amplitudes Ai of the transfer components are scaled by the time constants according to Ai = 1/τI − 1/τD (29). Distances from the larger component were designated high affinity binding site, whereas distances from the smaller component were denoted as low affinity binding side. Because the large and small amplitude components are mutually exclusive, both binding sites cannot be occupied simultaneously. Further, the ratio in affinity between sites could be as high as 20.
Homology Models
The program Modeler (30) was used to generate a homology model of the squid (Loligo opalescens) Na+/K+ ATPase from the Protein Data Bank (PDB) crystal structure 2ZXE (2) (Squalus acanthias Na+/K+ ATPase). The end parts of the α and β subunits that are missing in the crystal structure were also omitted in the homology model. Special patches were applied to form three known disulfide bridges in the β subunit (31–33).
Consistent with the experiments, a single LBT was inserted into the homology model at five different positions of the α subunit sequence. This was also done using Modeler by combining the model with the PDB structure 1TJB of LBT including Tb3+ (28). Ten models were created for each LBT insertion with different LBT poses (see supplemental Fig. S2).
These 50 models (10 models for each of the 5 insertions) were used to determine an approximate position for the Bodipy-Fl dye attached to ouabain. A probability P(r) for the position r of the dye was constructed from the product of independent distance probability distributions relative to each of the 50 possible positions of the Tb3+. For each measured distance, an independent Gaussian with an uncertainty σ of about 2 Å was assumed, yielding
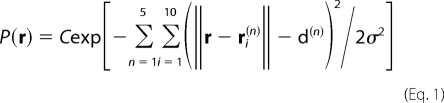 |
where C is a normalization constant, d(n) corresponds to each of the 5 measured LRET distances, and ri(n) represents the position of the Tb3+ in the i-th model for the n-th LBT insertion construct (n = 1–5). In practice, a set of most likely positions r was determined by carrying out a simulation of a dummy atom attached via harmonic springs to the 50 Tb3+ positions (the spring constant K was chosen as kBT/K = σ2 to reproduce the uncertainty σ of the measurements). The position of the dummy particle, corresponding to the most likely positions of the dye, is shown as green spheres in Fig. 4. The position of the dye can only be determined approximately, due to the inaccuracies in the homology models and the flexibility of the LBT insertions. We estimate that the global uncertainty on the dye position should be in the range of ∼5–10 Å. A Bodipy-Fl-labeled ouabain molecule was docked into the homology model of the squid Na+/K+ ATPase in accord with the optimal consensus positions determined. The Bodipy-Fl Ouabain models are based on the structure of ouabain taken from the PDB crystal structure 1IBG (34) for the high affinity binding site, or the structure obtained through structural refinement for the low affinity binding site; the dye was simply added using the program Molden (35). The dye was placed near the optimal position in the α subunit between TM1, TM2, and TM4, with the main part of the ouabain oriented to block the ion pathway of the pump and to be in close proximity to ouabain-sensitive residues identified in mutagenesis studies (36). These results indicate that the rhamnose end of the ouabain molecule faces the intracellular end of the permeation pathway of the Na+/K+ ATPase, rather than the outwardly facing orientation shown in the crystal structures (21, 22).
FIGURE 4.

Positions of ouabain determined from the LRET distances measured between the five LBT insertions and the Bodipy attached to ouabain. A, high affinity binding site. B, low affinity binding site. Small colored spheres (gray, cyan, blue, white, and gold) indicate the position of the terbium metal for each of the five LBT insertion constructs. For each insertion, 10 models generated with Modeler were used (the actual insertion construct models are shown in supplemental Fig. S2). The lines indicate the five experimentally determined LRET distances (numbers between parentheses). L1 (n = 17), L2 (n = 4), L3 (n = 10), L4 (n = 13), and L5 (n = 16) correspond to LBTs inserted at positions 125, 134, 318, 324, and 988, respectively. The green density represents the average optimal position of Bodipy determined from a simulation of a dummy atom held by 50 harmonic distance restraints. The average distances from the dummy atom to Tb3+ in each LBT are shown without parenthesis. In A, the location of ouabain in the crystal structure (21) is visualized in yellow stick representation. The modeled positions of Bodipy-Fl Ouabain are shown in violet stick representation. C, ouabain modeled position of the high affinity binding site shown with the nearest residues of the squid Na+/K+-ATPase identified with high impact on the binding of ouabain using site-directed mutagenesis. The equivalence of the squid residues with the corresponding sheep residues is as follows (squid-sheep): Cys116-Cys104, Tyr120-Tyr108, Asp133-Asp121, Asn134-Asn122, Tyr320-Tyr308, Leu342-Leu330, Ala343-Ala331, Thr809-Thr797.
Structure Refinement
The initial position of the ouabain molecule in the flipped orientation was prepared in COOT (37), using the electron density maps of the Na+/K+ ATPase with ouabain (PDB code 3A3Y). The difference Fourier (Fobs − Fcalc) electron density map of the atomic model without ouabain was generated using the Refmac program (38) within the CCP4 suite (39) and was used as a guide for the initial positioning of ouabain molecules within the binding pocket. Simulated annealed omit maps were calculated using Phenix (40), and the Ouabain molecule modeled to best fit in the density at 2.5 σ cutoff. Several possible ouabain rotamers were tested, and the one with the highest overlap with the difference map was chosen for further improvement. The initial atomic model was refined using the Refmac program (20 cycles), followed by further improvement of the ligand conformation in the program Phenix. To compare the B values of the ouabain in the two orientations (flipped versus published orientation), the original atomic model of ouabain was subject to the same procedure as above. The B values for the ouabain in the flipped orientation are comparable with those in the published structures, but slightly (approximately 5%) higher.
RESULTS
LRET Measurements between External Linkers of the Na+/K+ ATPase and Bodipy-Fl Ouabain
Upon a short 9-ns excitation pulse (266 nm) to an oocyte expressing Na+/K+ ATPases with LBT inserted within the fifth external loop (at position 988; L5), Tb3+ bound luminescence in the absence of acceptor decayed with a τD of 2.52 ms (Fig. 1A). This slow value is characteristic for Tb3+ bound to synthetic LBTs in solution (28) or genetically encoded within proteins (27), indicating that Tb3+ bound to L5 is protected from collisional quenching. This luminescence signal emanates from specific binding of Tb3+ to L5 Na+/K+ ATPases because it is absent in uninjected oocytes (supplemental Fig. S1). Fig. 1B shows the intensity decay upon the same light stimulation (to the same oocytes), but in the presence of Bodipy-Fl Ouabain and detected within the wavelength range that coincides with the first dark region of the absorption spectrum of Tb3+ (sensitized emission). Quenching of the Tb3+-bound luminescence by the acceptor is readily observed by the much faster fluorescence decay, which is consistent with energy transferred from the excited Tb3+ to the fluorescent ouabain. With L5, we could detect two transfer components: a large (∼80–85%, amplitude-corrected) component decaying with a τSEA of ∼0.2 ms, and a smaller (15–20%, amplitude-corrected) component with τSEA of ∼1 ms (Fig. 1B, gray solid line). For the larger component, the estimated distance between the Tb3+ bound to L5 and the fluorophore of the Bodipy-Fl Ouabain is 27.7 Å, whereas for the smaller component the distance is 39.4 Å.
FIGURE 1.

LRET-based fluorescence measurement between Tb3+ bound to L5 and Bodipy-Fl Ouabain. A, donor decay of Tb3+ bound to the L5 in the absence of the acceptor. Solid line represents a two-exponential fit highlighting the best parameter fit value for τD of 2.52 ± 0.019 ms (see “Experimental Procedures”). B, sensitized emission decay. Solid line corresponds to a three-exponential fit highlighting the best parameter fit values for the two transfer components identified with time constants of 0.189 ± 0.002 ms (96.2% amplitude-uncorrected) and 1.02 ± 0.02 ms (3.8% amplitude-uncorrected). The corresponding distances were 27.7 and 39.4 Å. Decays shown in A and B were acquired from the same oocyte.
If Bodipy-Fl Ouabain binds to a comparable site within the Na+/K+ ATPase as ouabain does, we would expect that quenching of the Tb3+ bound luminescence by the acceptor should be abolished by preincubating the oocytes with cold ouabain. Oocytes were preincubated with 10 μm cold ouabain for 5 min before excitation was performed. Fig. 2 shows an example for an oocyte expressing the L5 Na+/K+ ATPases. In the presence of the acceptor (i.e. 10 μm Bodipy-Fl Ouabain), the Tb3+-bound luminescence decay (Fig. 2A, gray) was indistinguishable from that observed in Fig. 1A (a signal recorded in the absence of acceptor), implying that no quenching had taken place. This result indicates that Bodipy-Fl Ouabain could not access the binding site of the L5 Na+/K+ ATPases because they were already occupied by cold ouabain. For comparison, Fig. 2A (black trace) shows the Tb3+-bound luminescence decay in the presence of the acceptor of an oocyte that had not been preincubated with cold ouabain. In this case, the donor decay had been substantially sped up by the transfer of energy from the donor to the acceptor. The sensitized emission is absent when the L5 Na+/K+ ATPases had been preincubated with cold ouabain (Fig. 2B, gray trace), compared with that observed in Fig. 1B (replotted in Fig. 2B for comparative purposes; black solid line). These results demonstrate that the transfer of energy occurs between the Tb3+ bound at L5 and the Bodipy-Fl Ouabain bound at the ouabain binding site of the L5 Na+/K+ ATPase.
FIGURE 2.

Pretreatment with unlabeled ouabain inhibits donor quenching and acceptor emission. A, comparison of the donor decay in the presence of 10 μm Bodipy-Fl Ouabain (black line) with the donor decay from an experiment in which the oocyte was first pretreated with 10 μm unlabeled ouabain, prior to the addition of 10 μm Bodipy-Fl Ouabain. When the oocyte was pretreated, the donor (gray line) was unquenched as indicated by the slow time constant (2.42 ± 0.02 ms). B, sensitized emission (black line) in the presence of 10 μm Bodipy-Fl Ouabain (same trace as in Fig. 1B). When oocytes were pretreated with cold ouabain, the sensitized emission is absent (the gray line is the background emission; see supplemental Fig. S1B). The decays displayed are from two representative oocytes, one pretreated and one without pretreatment (gray and black lines, respectively).
We attempted similar experiments with 12 Na+/K+ ATPase constructs in which LBTs were inserted throughout the external transmembrane linkers of the Na+/K+ ATPase. We could not detect any Tb3+-bound luminescence decay in Na+/K+ ATPase constructs with LBTs inserted in the external linkers 3 and 4. A lack of luminescence signal could originate from a trafficking failure or by a misfolded LBT tag unable to chelate Tb3+. Fig. 3A shows the Tb3+-bound luminescence decay from an oocyte expressing Na+/K+ ATPases with LBT inserted within the second external linker (L4). Consistent with Tb3+ bound to the LBT introduced to the Na+/K+ ATPase, there is a large signal decaying with a τD of 2.39 ± 0.015 ms (Fig. 3A, gray solid line). The sensitized emission (Fig. 3B) shows that a large portion (∼95%) of the intensity decayed with a τSEA of ∼1.8 ms, corresponding to a distance between the Tb3+ bound to L4 and the fluorophore of the Bodipy-Fl Ouabain of about 50 Å for the high affinity binding site. The small component of the intensity (∼5%) had a τSEA of ∼0.5 ms, corresponding to a distance of 33 Å.
FIGURE 3.

LRET-based fluorescence distance measurement between Tb3+ bound to L4 and Bodipy-Fl Ouabain. A, donor decay in the absence of the acceptor. The time constant of the donor determined by the fit is 2.39 ± 0.015 ms. B, sensitized emission containing a large (∼95%) component with a time constant of 1.81 ± 0.04 ms, corresponding to a distance of 50.2 Å. The small component (∼5%) has a time constant of 0.45 ± 0.01 ms, equivalent to a distance of 32.8 Å. The traces shown in A and B were acquired from one representative oocyte.
Homology Models and Determination of the Position of Ouabain
Using the program Modeler (30), homology models of the squid (L. opalescens) Na+/K+ ATPase with LBT inserted were generated for all constructs (supplemental Fig. S2). From these 50 models (10 models for each of the five insertions), the optimal position for the dye was determined in accord with the five experimental distances from each binding sites. Recognizing the uncertainty in the measurements and in the modeling, a set of allowed positions was determined from a simulation of a dummy particle held by 50 harmonic restraints corresponding to each of the LBT constructs (see “Experimental Procedures”). The results of this analysis carried out with a homology model of the squid Na+/K+ ATPase are shown in Fig. 4, A and B, for the high and low affinity binding sites, respectively. The lines indicate the five distances determined experimentally. For the high affinity binding site, there is an overall discrepancy of ∼6-Å root mean square difference between the experimentally measured distances imposed as restraints and the actual distances in the model. For the low affinity binding site, the overall discrepancy is ∼ 5.2-Å root mean square difference. In both cases, the green spheres represent the set of possible positions of the dummy particle, and the large transparent green sphere of 10-Å radius centered on the average optimal position indicates the overall region where the fluorophore might be located based on this analysis. A Bodipy-Fl Ouabain molecule was then inserted into a physically reasonable position, with the fluorophore moiety as close as possible to the 10-Å radius sphere and the ouabain moiety of the fluorescent inhibitor oriented to block the ion permeation pathway of the pump located between TM1, TM2, TM4, and TM6 (24). In the model, the high affinity binding site for ouabain is located in close proximity to residues identified in a previous site-directed mutagenesis study (36) (Fig. 4C). Importantly, the ouabain molecule sits considerably deeper toward the intracellular end of the permeation pathway than the position previously deduced from x-ray crystallography (21, 22), shown in yellow stick representation (Fig. 4A). Furthermore, it is oriented with the lactone ring of the molecule facing outward, contrary to the formerly proposed orientation (21, 22). Ouabain, at the low affinity site, sits exactly at the depth of the Na+/K+ ATPase permeation pathway as it was found in the crystal structures (Fig. 4B); however, it is also oriented with the lactone ring outwardly, as the high affinity binding site. Fig. 5 compares the omit electronic density maps of ouabain with the lactone ring (yellow) facing in or out, indicating that both orientations are compatible with the x-ray scattering data.
FIGURE 5.

Orientation of ouabain in the α subunit based on structural factors of the PDB (3A3Y). Simulated annealed omit maps are shown at 2.5 σ, with ouabain in the published (A) or reoriented 180° (B). The omit maps are compatible with both possible orientations of ouabain.
DISCUSSION
We have made LRET distance determinations from Tb3+ bound to LBTs inserted in the Na+/K+ ATPase and a fluorescent ouabain. In all oocytes expressing LBT-Na+/K+ ATPase constructs, a pulse of UV light produced a slow (τD ∼2.5 ms) luminescence decay characteristic of Tb3+ bound to LBT either in solution (28) or genetically encoded into proteins (27). This signal was absent in uninjected oocytes, suggesting that it emanates from Tb3+ bound to the LBT and therefore protected from collisional quenching. In all five LBT-Na+/K+ ATPase constructs studied, the presence of Bodipy-Fl Ouabain considerably quenched the donor signal, which is consistent with the transfer of energy between the Tb3+ bound to the LBT and the fluorophore. Two experimental results indicate that the fluorescent ouabain binds to a comparable site as ouabain does. First, transfer of energy between Tb3+ and Bodipy-Fl Ouabain was abolished by preincubating the oocytes with cold ouabain. Second, binding kinetics of both inhibitors are similar, as shown by electrophysiological methods in supplemental Fig. S3. All of these results combined strongly support that our distance determinations originate from the Tb3+ bound to the inserted LBT and the fluorescent ouabain bound to the Na+/K+ ATPase.
Using all five experimentally estimated distances and homology models of the squid LBT-Na+/K+ ATPase constructs, we determined the most likely positions for the dye in both the high and low affinity binding sites. Given the functional and structural information known, Fig. 4 shows the most sensible positions for the ouabain molecule within the Na+/K+ ATPase. In both of our models, ouabain is located between TM1, TM2, TM4, and TM6. Functionally (23, 24) and structurally (1, 2) those transmembrane segments are thought to be the ion permeation pathway. As shown in Fig. 4A, the location of the ouabain high affinity binding site deduced here is considerably deeper toward the intracellular end of the ion permeation pathway compared with previous results obtained from x-ray crystallography (21, 22). Nevertheless, the ouabain low affinity binding site is indistinguishable from the position determined by x-ray crystallography. In both of our estimated sites, the lactone ring of ouabain is oriented toward the extracellular end of the permeation pathway, in contrast to the proposed orientation in the crystal structures (21, 22). Such differences with two previous crystallographic studies may at first appear to be surprising; however, further consideration indicates that the orientation of ouabain cannot be determined uniquely from the available electronic densities. Our analysis indicates that two possible orientations of ouabain are actually compatible with the electronic density maps (ouabain omitted) calculated from the scattering structure factors (Fig. 5). This observation raises interesting mechanistic scenarios on the binding of ouabain to the pump. It is plausible that ouabain could first bind in the low affinity binding site in the orientation shown in Figs. 4B and 5B and that this is followed by a displacement to a deeper position toward the intracellular side as shown in Fig. 4A. Alternatively, it is also possible that ouabain might first bind in the orientation shown in Fig. 5A, although the subsequent translocation to the second site would require a 180° flip to match the orientation determined by the analysis of LRET data (Fig. 4A). Although this possibility cannot be excluded, the first scenario seems more plausible. In fact, similar mechanisms have been proposed for other molecules that also interact within the ion permeation pathway in ion channels (41, 42). It is important to recall that the x-ray structures with ouabain correspond to the K+-loaded E2 state (21) or an empty E2-P state (22), whereas ouabain inhibits the pump in a E2 Na+-loaded state (43), possibly accounting for the differences in the binding site detected by crystallography and the high affinity binding site deduced here from LRET data. We propose that once the first Na+ is released through a narrow access channel (44–46), the external end of the Na+/K+ ATPase permeation pathway undergoes a large conformational change that allow access of ouabain to the state E2-P(2Na+), which is known to be the functional state of ouabain binding (43). Ouabain would transit through the permeation pathway in at least two steps, occupying initially the external end of the pathway (19, 21, 22) and then moving deeper as shown in Fig. 4A. This binding process would be consistent with all reported positions relevant for ouabain sensitivity (4, 9–15, 18, 36), including some residues lying deeper within the permeation pathway of the Na+/K+ ATPase (36) which were previously unaccounted.
Supplementary Material
Acknowledgments
We thank Balasundaresan Dhakshnamoorthy for help with the analysis of electronic densities, Deepa Srikumar for making the LBT-Na+/K+ ATPase constructs, and the DNA sequencing facility at the NINDS, National Institutes of Health, for sequencing all DNA constructs used in this study.
This work was supported, in whole or in part, by National Institutes of Health Grants R01-GM062342, R01-GM030376, and U54-GM087519. This work was also supported by the Intramural Research Program NINDS, National Institutes of Health.

The on-line version of this article (available at http://www.jbc.org) contains supplemental Figs. S1–S3.
- TM
- transmembrane
- LBT
- lanthanide-binding tag
- LRET
- lanthanide-based resonance energy transfer
- PDB
- Protein Data Bank.
REFERENCES
- 1. Morth J. P., Pedersen B. P., Toustrup-Jensen M. S., Sørensen T. L., Petersen J., Andersen J. P., Vilsen B., Nissen P. (2007) Nature 450, 1043–1049 [DOI] [PubMed] [Google Scholar]
- 2. Shinoda T., Ogawa H., Cornelius F., Toyoshima C. (2009) Nature 459, 446–450 [DOI] [PubMed] [Google Scholar]
- 3. Lutsenko S., Kaplan J. H. (1993) Biochemistry 32, 6737–6743 [DOI] [PubMed] [Google Scholar]
- 4. Jaisser F., Canessa C. M., Horisberger J. D., Rossier B. C. (1992) J. Biol. Chem. 267, 16895–16903 [PubMed] [Google Scholar]
- 5. de Carvalho Aguiar P., Sweadner K. J., Penniston J. T., Zaremba J., Liu L., Caton M., Linazasoro G., Borg M., Tijssen M. A., Bressman S. B., Dobyns W. B., Brashear A., Ozelius L. J. (2004) Neuron 43, 169–175 [DOI] [PubMed] [Google Scholar]
- 6. Segall L., Mezzetti A., Scanzano R., Gargus J. J., Purisima E., Blostein R. (2005) Proc. Natl. Acad. Sci. U.S.A. 102, 11106–11111 [DOI] [PMC free article] [PubMed] [Google Scholar]
- 7. Vanmolkot K. R., Kors E. E., Hottenga J. J., Terwindt G. M., Haan J., Hoefnagels W. A., Black D. F., Sandkuijl L. A., Frants R. R., Ferrari M. D., van den Maagdenberg A. M. (2003) Ann. Neurol 54, 360–366 [DOI] [PubMed] [Google Scholar]
- 8. De Fusco M., Marconi R., Silvestri L., Atorino L., Rampoldi L., Morgante L., Ballabio A., Aridon P., Casari G. (2003) Nat. Genet. 33, 192–196 [DOI] [PubMed] [Google Scholar]
- 9. Lingrel J. B., Orlowski J., Price E. M., Pathak B. G. (1991) Soc. Gen. Physiol. Ser. 46, 1–16 [PubMed] [Google Scholar]
- 10. Price E. M., Lingrel J. B. (1988) Biochemistry 27, 8400–8408 [DOI] [PubMed] [Google Scholar]
- 11. Price E. M., Rice D. A., Lingrel J. B. (1989) J. Biol. Chem. 264, 21902–21906 [PubMed] [Google Scholar]
- 12. Price E. M., Rice D. A., Lingrel J. B. (1990) J. Biol. Chem. 265, 6638–6641 [PubMed] [Google Scholar]
- 13. Antolovic R., Schoner W., Geering K., Canessa C., Rossier B. C., Horisberger J. D. (1995) FEBS Lett. 368, 169–172 [DOI] [PubMed] [Google Scholar]
- 14. Canessa C. M., Horisberger J. D., Louvard D., Rossier B. C. (1992) EMBO J. 11, 1681–1687 [DOI] [PMC free article] [PubMed] [Google Scholar]
- 15. Canessa C. M., Horisberger J. D., Rossier B. C. (1993) J. Biol. Chem. 268, 17722–17726 [PubMed] [Google Scholar]
- 16. De Pont J. J., Swarts H. G., Karawajczyk A., Schaftenaar G., Willems P. H., Koenderink J. B. (2009) Pflugers Arch 457, 623–634 [DOI] [PubMed] [Google Scholar]
- 17. Qiu L. Y., Krieger E., Schaftenaar G., Swarts H. G., Willems P. H., De Pont J. J., Koenderink J. B. (2005) J. Biol. Chem. 280, 32349–32355 [DOI] [PubMed] [Google Scholar]
- 18. Brinkmann K., Linnertz H., Amler E., Lanz E., Herman P., Schoner W. (1997) Eur. J. Biochem. 249, 301–308 [DOI] [PubMed] [Google Scholar]
- 19. Middleton D. A., Rankin S., Esmann M., Watts A. (2000) Proc. Natl. Acad. Sci. U.S.A. 97, 13602–13607 [DOI] [PMC free article] [PubMed] [Google Scholar]
- 20. Forbush B., 3rd, Kaplan J. H., Hoffman J. F. (1978) Biochemistry 17, 3667–3676 [DOI] [PubMed] [Google Scholar]
- 21. Ogawa H., Shinoda T., Cornelius F., Toyoshima C. (2009) Proc. Natl. Acad. Sci. U.S.A. 106, 13742–13747 [DOI] [PMC free article] [PubMed] [Google Scholar]
- 22. Yatime L., Laursen M., Morth J. P., Esmann M., Nissen P., Fedosova N. U. (2011) J. Struct. Biol. 174, 296–306 [DOI] [PubMed] [Google Scholar]
- 23. Reyes N., Gadsby D. C. (2006) Nature 443, 470–474 [DOI] [PubMed] [Google Scholar]
- 24. Takeuchi A., Reyes N., Artigas P., Gadsby D. C. (2008) Nature 456, 413–416 [DOI] [PMC free article] [PubMed] [Google Scholar]
- 25. Selvin P. R. (2002) Annu. Rev. Biophys. Biomol Struct. 31, 275–302 [DOI] [PubMed] [Google Scholar]
- 26. Colina C., Rosenthal J. J., DeGiorgis J. A., Srikumar D., Iruku N., Holmgren M. (2007) Nat. Struct. Mol. Biol. 14, 427–431 [DOI] [PubMed] [Google Scholar]
- 27. Sandtner W., Bezanilla F., Correa A. M. (2007) Biophys. J. 93, L45–47 [DOI] [PMC free article] [PubMed] [Google Scholar]
- 28. Nitz M., Sherawat M., Franz K. J., Peisach E., Allen K. N., Imperiali B. (2004) Angew Chem. Int Ed Engl. 43, 3682–3685 [DOI] [PubMed] [Google Scholar]
- 29. Heyduk T., Heyduk E. (2001) Anal. Biochem. 289, 60–67 [DOI] [PubMed] [Google Scholar]
- 30. Martí-Renom M. A., Stuart A. C., Fiser A., Sánchez R., Melo F., Sali A. (2000) Annu. Rev. Biophys. Biomol Struct. 29, 291–325 [DOI] [PubMed] [Google Scholar]
- 31. Kawamura M., Nagano K. (1984) Biochim. Biophys. Acta 774, 188–192 [DOI] [PubMed] [Google Scholar]
- 32. Kirley T. L. (1989) J. Biol. Chem. 264, 7185–7192 [PubMed] [Google Scholar]
- 33. Miller R. P., Farley R. A. (1990) Biochemistry 29, 1524–1532 [DOI] [PubMed] [Google Scholar]
- 34. Jeffrey P. D., Schildbach J. F., Chang C. Y., Kussie P. H., Margolies M. N., Sheriff S. (1995) J. Mol. Biol. 248, 344–360 [DOI] [PubMed] [Google Scholar]
- 35. Schaftenaar G., Noordik J. H. (2000) J. Comput. Aided Mol. Des. 14, 123–134 [DOI] [PubMed] [Google Scholar]
- 36. Croyle M. L., Woo A. L., Lingrel J. B. (1997) Eur. J. Biochem. 248, 488–495 [DOI] [PubMed] [Google Scholar]
- 37. Emsley P., Lohkamp B., Scott W. G., Cowtan K. (2010) Acta Crystallogr. D Biol. Crystallogr. 66, 486–501 [DOI] [PMC free article] [PubMed] [Google Scholar]
- 38. Murshudov G. N., Vagin A. A., Lebedev A., Wilson K. S., Dodson E. J. (1999) Acta Crystallogr. D Biol. Crystallogr. 55, 247–255 [DOI] [PubMed] [Google Scholar]
- 39. Project C. C. (1994) Acta Crystallogr. D Biol. Crystallogr. 50, 760–763 [DOI] [PubMed] [Google Scholar]
- 40. Adams P. D., Grosse-Kunstleve R. W., Hung L. W., Ioerger T. R., McCoy A. J., Moriarty N. W., Read R. J., Sacchettini J. C., Sauter N. K., Terwilliger T. C. (2002) Acta Crystallogr. D Biol. Crystallogr. 58, 1948–1954 [DOI] [PubMed] [Google Scholar]
- 41. Martínez-François J. R., Lu Z. (2010) J. Gen. Physiol. 135, 149–167 [DOI] [PMC free article] [PubMed] [Google Scholar]
- 42. Zhou M., Morais-Cabral J. H., Mann S., MacKinnon R. (2001) Nature 411, 657–661 [DOI] [PubMed] [Google Scholar]
- 43. Stürmer W., Apell H. J. (1992) FEBS Lett. 300, 1–4 [DOI] [PubMed] [Google Scholar]
- 44. Hilgemann D. W. (1994) Science 263, 1429–1432 [DOI] [PubMed] [Google Scholar]
- 45. Holmgren M., Wagg J., Bezanilla F., Rakowski R. F., De Weer P., Gadsby D. C. (2000) Nature 403, 898–901 [DOI] [PubMed] [Google Scholar]
- 46. Gadsby D. C., Rakowski R. F., De Weer P. (1993) Science 260, 100–103 [DOI] [PubMed] [Google Scholar]
Associated Data
This section collects any data citations, data availability statements, or supplementary materials included in this article.