Abstract
The surfaces of mammalian cells are coated with complex carbohydrates, many terminated with a negatively charged N-acetylneuraminic acid residue. This motif is specifically targeted by pathogens, including influenza viruses and many pathogenic bacteria, to gain entry into the cell. A necessary step in the influenza virus life cycle is the release of viral particles from the cell surface; this is achieved by cleaving N-acetylneuraminic acid from cell surface glycans with a virally-produced neuraminidase. Here we present a laboratory exercise to model this process using a glycoprotein as a glycan carrier and using real time nuclear magnetic resonance (NMR) spectroscopy to monitor N-acetylneuraminic acid release as catalyzed by neuraminidase. A time-resolved two dimensional data processing technique, statistical total correlation spectroscopy (STOCSY), enhances the resolution of the complicated 1D glycoprotein spectrum and isolates characteristic peaks corresponding to substrates and products. This exercise is relatively straightforward and leads students through a wide range of biologically and chemically relevant procedures, including use of NMR spectroscopy, enzymology and data processing techniques.
Keywords: Upper-Division Undergraduate, Biochemistry, Inquiry-Based/Discovery Learning, Bioanalytical Chemistry, Biotechnology, Biosynthesis, Carbohydrates, Drugs/Pharmaceuticals, Enzymes, NMR Spectroscopy
Lab Summary
Glycobiology is a rapidly-expanding and vibrant field buoyed by recent discoveries that highlight the critical nature of complex carbohydrates in cell-cell communication and pathology. Introductory biochemistry and biology courses often focus on molecular biology because of the great impact this field has had on our understanding of much of biology and the very logical route it portrays to the synthesis of proteins and the direct roles they play in cellular processes. Because complex carbohydrates are not synthesized from templates like DNA, RNA, and proteins, they exhibit a higher level of primary structural diversity, and a basic understanding of their synthesis and biological roles has lagged behind that of their more-studied counterparts. They are, however, primary mediators of cellular communication and function, and their roles in these processes deserve more attention. Braced by the importance and diversity of the glycome, the inclusion of glycobiology into early undergraduate education will enhance introductory biochemistry and biology courses and may excite students to this field of biological research.
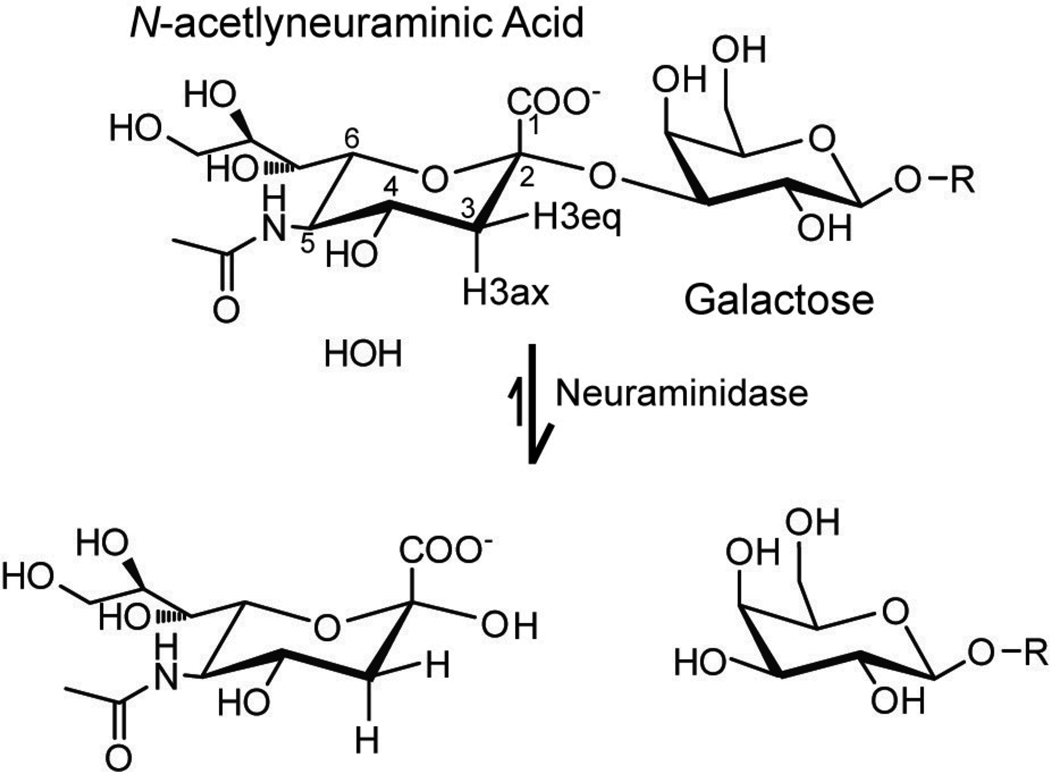
Mammalian cell surfaces are a dynamic mixture of lipids, proteins and carbohydrates. The carbohydrate moieties presented on cell surfaces are highly variable, and are often anchored to proteins or lipids embedded in the cell membrane. Complex carbohydrate (glycan) termini on the cell surface are commonly modified by a sialic acid residue, N-acetylneuraminic acid in humans (Figure 1), which functions to distinguish self from non-self and regulate a number of cellular processes (1). However, pathogens have evolved to recognize these motifs and use the sialylated glycans (a complex carbohydrate modified with N-acetylneuraminic acid residues on the non-reducing end) to gain entry into host cells. The influenza virus, for example, binds to the surface of epithelial cells in the upper respiratory mucosa by coordinating glycans that terminate with an N-acetylneuraminic acid residue. This virus contains Hemagglutinin and Neuraminidase proteins on the outer surface, both of which vary among different viral serotypes (the H and N, respectively of H1N1 for swine flu, or alternatively H5N1 of bird flu) (2). Hemagglutinin targets the viral particles to the host cell surface by binding N-acetylneuraminic acid modified glycans. Neuraminidase cleaves N-acetylneuraminic acid residues from host glycans (see Figure 1) thereby permitting newly-synthesized viral particles to diffuse away from the host cell. Interfering with either activity will disrupt the viral life cycle and prevent infection or transmission; indeed, the front-line anti-influenza medications, including oseltamivir (Tamiflu®) and zanamivir (Relenza®), inhibit neuraminidase (3).
Figure 1.
The most common sialic acid found on human cells is N-acetylneuraminic acid, which is shown with an α2–3 linkage to a β-galactosyl residue. This linkage is hydrolyzed by the enzyme neuraminidase to liberate the N-acetylneuraminic acid. Note the axial and equatorial hydrogen atoms in the top structure.
The laboratory exercise presented here models the step of viral release using a glycoprotein as a glycan carrier and a commercially available neuraminidase. This process is monitored in real time using nuclear magnetic resonance (NMR) spectroscopy. Though NMR spectroscopy is generally a low-sensitivity technique often relegating it to one dimensional (1D) applications, utilizing a spectral processing technique, statistical total correlation spectroscopy (STOCSY), provides a route to 2D enhanced resolution and isolates characteristic peaks corresponding to substrates as well as products from otherwise complicated glycoprotein spectra (4).
Experimental Section and Discussion
Neuraminidase Reaction
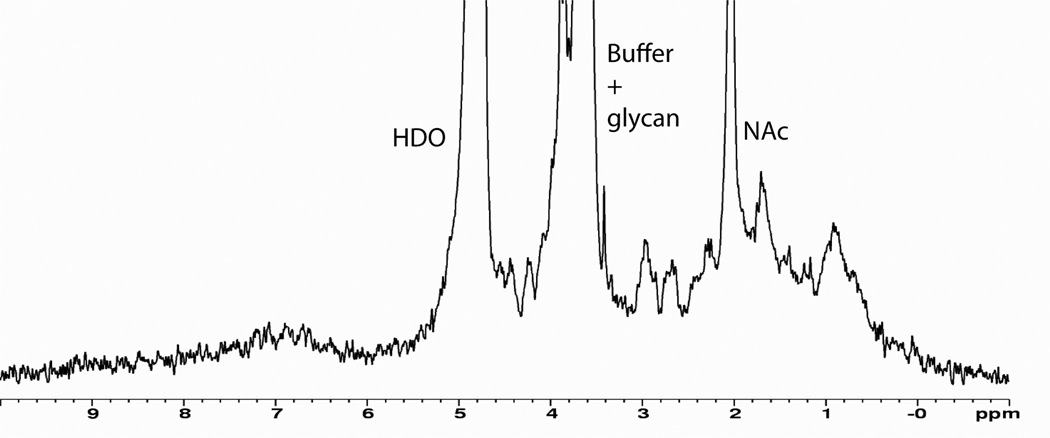
Glycoprotein (either 5 mg of α1-acid glycoprotein or 10 mg of fetuin) was dissolved in a deuterium oxide solution buffered with 50 mM of aqueous sodium phosphate at pH 7.5 and placed in an NMR tube. An initial one dimensional spectrum of this solution was collected at room temperature at a proton (1H) frequency of 300 MHz and showed a typical spectrum for a glycoprotein (Figure 2).
Figure 2.
300 MHz proton spectrum of α1-acid glycoprotein in 90% D2O. At 3.4–4.2 ppm, there is a large contaminating buffer peak in addition to carbohydrate resonances. The envelope of the protein amino acid resonances can be seen. The large singlet at ~ 2ppm is from the methyl protons of N-acetyl groups on some of the sugars (N-acetylglucosamine, N-acetylneuraminic acid).
The NMR parameters are as follows:
Tip angle- 45°
Recycle delay- 1.5s
Sweep width- 12 ppm
Data points- 8k
Scans / spectrum - 64
Center of spectrum- water (~4.8 ppm)
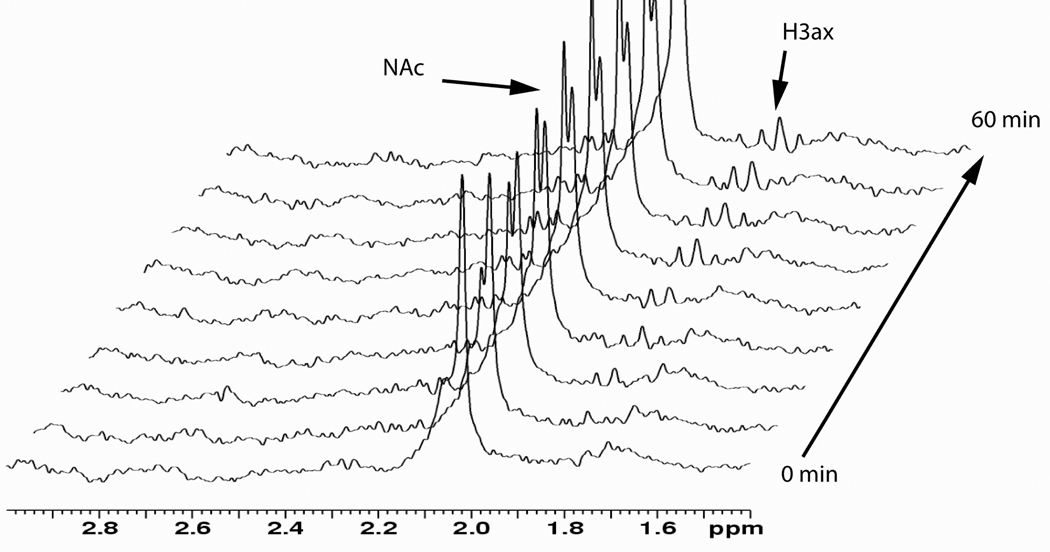
These parameters were saved, and the sample was ejected to add the neuraminidase. The sample was immediately placed back into the spectrometer to begin data collection. Spectra (consisting of 64 scans each) were collected sequentially for two hours. During this time, the original acetyl peak (~2.05 ppm) decreases and is replaced with a narrower peak slightly downfield as shown in Figure 3, indicating the release of N-acetylneuraminic acid. At later time points, 1H peaks at 2.20 and 1.85 ppm that belong to the equatorial and axial H3 protons, respectively, of the released N-acetylneuraminic acid (Figure 3) become observable. Peaks from these, as well as other, protons on glycan residues tightly associated with the protein are broad and more difficult to observe in 1D spectra.
Figure 3.
Time course of the neuraminidase reaction: region of proton spectrum showing diagnostic signals of the N-acetylneuraminic acid. Note that there is a second NAc peak forming, and that a triplet labeled H3ax is also appearing. These are from the free N-acetylneuraminic acid.
Data Analysis
The NMR experiment described above can be collected as a two-dimensional experiment, with 1H chemical shift in one dimension and time (a series of 1D spectra) as a second dimension. The variance of peak intensities over time may be utilized to group resonances that change intensity with a common rate. This grouping is accomplished with a STOCSY data processing procedure based on the production of a co-variance matrix from the product of the matrix of properly scaled time-varying spectra and the transpose of that matrix. Products of elements that vary in the same way produce positive points in the covariance matrix, elements that vary in the opposite way produce negative points, and elements that vary in an uncorrelated manner produce zero points. This allows resonances that covary over time to be connected by positive or negative points called cross-peaks. A row or column through a set of these cross-peaks results in a 1D spectrum of an entire covarying group of resonances, separate from other resonances. Unlike other 2D NMR methods, STOCSY does not rely upon scalar couplings to correlate resonances. These couplings may be weak and rarely correlate all signals from a single molecule at one frequency.
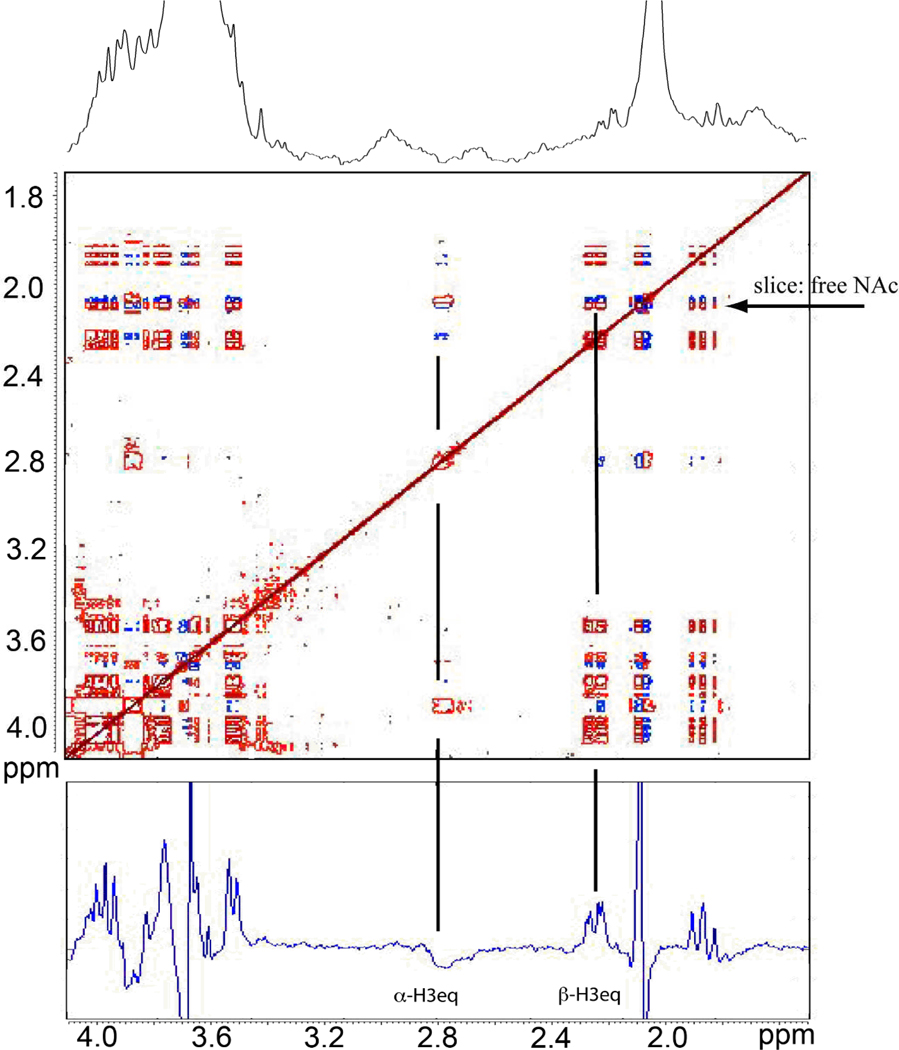
Figure 4 illustrates a STOCSY experiment. A representation of the entire 1D spectrum occurs along the diagonal. Peaks that disappeared (corresponding to the acetate methyl and H3 methylene protons of glycan conjugated N-acetylneuraminic acid) and those that appeared (corresponding to free N-acetylneuraminic acid) are negatively correlated and are connected by cross-peaks shown in blue in Figure 4 (middle). A horizontal line through the released N-acetyl peak on the diagonal produces a spectrum with all peaks from the released product shown as positive signals (Figure 4, bottom). Also, H3 signals from the glycan-conjugated N-acetylneuraminic acid appear as broad, negative intensity in this slice (~2.8 ppm). It should be noted that the N-acetyl peak from the glycan-conjugated N-acetylneuraminic acid is slightly upfield of the free N-acetylneuraminic acid peak and a slice through this frequency from the 2D plot (not shown) will show opposite signs from the H3 protons when compared to the horizontal line through the released N-acetyl peak on the diagonal (Figure 4, bottom).
Figure 4.
Correlation matrix of the neuraminidase treated α1-AGP data shown in Fig. 3.
Top: 1D proton spectrum of region between 1.7 and 4.1 ppm after the reaction has completed. One can see some relatively sharp peaks corresponding to the free N-acetylneuraminic acid, as well as the broad resonances from the glycoprotein itself.
Middle: Correlation matrix showing primarily peaks associated with the free and protein linked N-acetylneuraminic acid – notice the red and blue peaks corresponding to positive and negative correlations.
Bottom: 1D slice through the N-acetyl methyl protons of the free sugar, indicated by the horizontal arrow on the 2D plot. Vertical lines indicate a positive correlation to the β-H3 equatorial peaks of the free sugar, and a negative correlation to the α-H3 equatorial peaks of the protein-linked glycan form. Other positive and negative peaks can also be assigned to free or linked populations of N-acetylneuraminic acid.
Interestingly, this manipulation dramatically improved the detectability of the H3 protons from the glycan-bound N-acetylneuraminic acid, where positively (red) - and negatively (blue) correlated peaks can be visualized on horizontal lines through the bound and free acetyl peaks of the diagonal. The resolution is enhanced to the point where the 1H-1H scalar couplings of these peaks may be accurately measured.
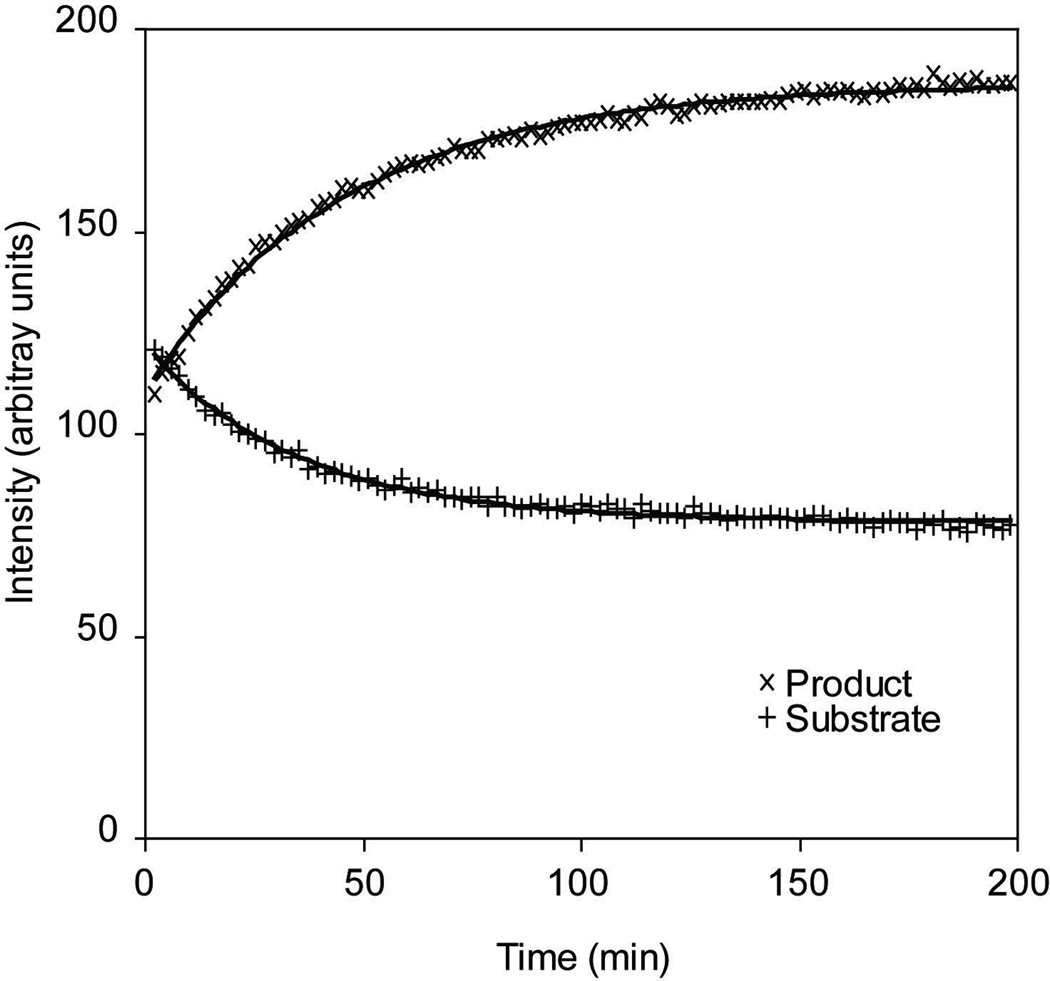
The measurements of intensities for peaks in the1D spectra coming from the released N-acetylneuraminic acid may be used to plot a time-course for the reaction as shown in Figure 5. A fit of the time course to a pseudo first-order rate law allows determination of a rate constant, as shown, and permits the extraction of substrate and product half-lives.
Figure 5.
Intensities of the N-acetate signals corresponding to the fetuin-conjugated N-acetylneuraminic acid (Substrate) and the free N-acetylneuraminic acid (Product). The intensities are measured from a single frequency in the 1D NMR spectra and include background glycoprotein signals that do not change over time. The change of these intensities over time is the salient feature of this experiment. An exponential decay described by the equation I(x) = −(Ie − Is) e−dx + Ie was fitted to these curves to determine a half-life for reaction, where “I” is the intensity of the signal at time “x,” “Is” is the intensity before the reaction, “Ie” is the intensity at the end of the reaction, and “d” is the decay constant.
Conclusions
NMR-based laboratory exercises at appropriately equipped institutions are suitable for undergraduate students (5–8) and provide training in a powerful analytic technique. These exercises have been made easier by dramatic software improvements in modern spectrometers. This protocol may be adapted to suit a number of different levels of undergraduate courses. The reaction and NMR spectroscopy sections may be used by basic biology or biochemistry courses as an example of enzymology, glycobiology and NMR spectroscopy. More advanced courses may use the data processing section to teach spectral processing techniques and fundamental NMR spectral analysis, including: peak integration and lineshape analysis; using chemical shifts to identify compounds; and, curve fitting to analyze the rate of N-acetylneuraminic acid release.
Cost Analysis.
The major cost of this experiment, outside of equipment, is for the purchase of proteins; deuterium oxide and sodium phosphate buffers in the quantities required are of negligible cost. 50 units of Neuraminidase cost about $1.40; α1-acid glycoprotein which gave us the best results costs about $10/mg; though a suitable alternative, fetuin is about $0.30/mg. The total cost for an experiment using the suggested concentrations was around $51.40 and $4.40 for α1-acid glycoprotein and fetuin, respectively.
Fetuin is a suitable alternative for monitoring the H3 and N-acetate protons of N-acetylneuraminic acid; however, the fetuin preparation tested herein contained a large amount of contaminating carbohydrate, possibly glucose. The intensities of the contaminating protons prevented resolution of the N-acetylneuraminic acid methine protons between 4.5 and 3.5 ppm. Fortunately, resolution in this region of the spectrum is not critical for the successful interpretation and completion of the laboratory exercise.
Supplementary Material
Acknowledgements
This laboratory exercise was initially developed for a workshop sponsored by an NSF grant DUE-0618678 entitled “A Series of Workshops in the Chemical Sciences.”
Contributor Information
Adam W. Barb, Email: adam_barb@ccrc.uga.edu.
John N. Glushka, Email: glushka@ccrc.uga.edu.
James H. Prestegard, Email: jpresteg@ccrc.uga.edu.
Literature Cited
- 1.Varki A. Essentials of Glycobiology. 2nd ed. New York: Cold Spring Harbor Laboratory Press; 2009. [PubMed] [Google Scholar]
- 2.Atkinson W, Hamborsky J, McIntyre L, Wolfe S, editors. Epidemiology and Prevention of Vaccine-Preventable Diseases. 10th ed. Washington, D.C.: Centers for Disease Control and Prevention; 2007. [Google Scholar]
- 3.Smith JR, Ariano RE, Toovey Critical Care Medicine homepage. [accessed Nov 2009]; http://journals.lww.com/ccmjournal/pages/default.aspx. [Google Scholar]
- 4.Cloarec O, Dumas ME, Craig A, Barton RH, Trygg J, Hudson J, Blancher C, Gauguier D, Lindon JC, Holmes E, Nicholson J. Anal. Chem. 2005;77:1282–1289. doi: 10.1021/ac048630x. [DOI] [PubMed] [Google Scholar]
- 5.Grant A, Latimer D. J. Chem. Ed. 2003;80:670–671. [Google Scholar]
- 6.Grushow A, Zielinski TJ. J. Chem. Ed. 2002;79:707–714. [Google Scholar]
- 7.Mega TL, Carlson CB, Cleary D. J. Chem. Ed. 1997;74:1474–1476. [Google Scholar]
- 8.Orvis JA, Dimetry B, Winge J, Mullis TC. J. Chem. Ed. 2003;80:803–805. [Google Scholar]
Associated Data
This section collects any data citations, data availability statements, or supplementary materials included in this article.


