

Abstract
Objective
At least three randomized, placebo controlled, double blind studies support the efficacy of computerized Attention Modification Programs (AMP) in reducing symptoms of anxiety in patients diagnosed with an anxiety disorder. In this study we examined patient characteristics that predicted response to AMP in a large sample of individuals diagnosed with Generalized Social Phobia (GSP).
Method
The sample comprised 112 individuals seeking treatment for GSP who completed a randomized clinical trial comparing AMP (n = 55) to a placebo condition (i.e., Attention Control Condition, ACC, n = 57). We examined the following domains of baseline predictors of treatment response: (1) demographic characteristics (gender, age, ethnicity, years of education), (2) clinical characteristics (Axis I comorbidity, trait anxiety, depression), and (3) cognitive disturbance factors (attentional bias for social threat, social interpretation bias).
Results
Results revealed that ethnicity predicted treatment response across both conditions: Participants who self-identified as non-Caucasian displayed better overall response compared to Caucasians. The only prescriptive variable to emerge was attentional bias for social threat at pre-assessment. Specifically, participants in the AMP group who exhibited larger attentional bias scores displayed significantly greater reductions in clinician-rated social anxiety symptoms relative to their counterparts in the ACC group.
Conclusions
These results suggest that AMP may be targeted to individuals most likely to benefit from it.
Keywords: Social Phobia, Attention, Predictors, Treatment, Information Processing
A number of randomized, double blind, placebo controlled studies support the efficacy of computerized Attention Modification Programs (AMP) in the treatment of anxiety (Amir, Beard, Taylor et al., 2009; Amir, Beard, Burns, & Bomyea, 2009; Schmidt, Richey, Buckner, & Timpano, 2009). AMP is based on cognitive theories of anxiety that propose a causal role for selective attention to threat-relevant information in the maintenance of anxiety (e.g., Mathews & MacLeod, 2005; Williams, Watts, MacLeod, & Mathews, 1997). Consistent with these theories, 25 years of research provides evidence demonstrating that patients meeting diagnostic criteria for an anxiety disorder preferentially attend to threat-relevant stimuli over neutral stimuli when the two compete for processing resources (for a review see Bar-Haim, Lamy, Pergamin, Bakermans-Kranenburg, & van IJzendoorn, 2007). More relevant to the causality hypothesis, recent studies have demonstrated that experimentally manipulating attentional allocation to threatening information confers differential susceptibility to anxiety under stress (e.g., Amir, Weber, Beard, Bomyea, & Taylor, 2008; Clarke, MacLeod, & Shirazee, 2008; MacLeod, Rutherford, Campbell, Ebsworthy, & Holker, 2002).
To modify attention, previous studies have used a variant of the probe detection task (MacLeod, Mathews, & Tata, 1986) designed to induce selective processing of neutral cues when these cues compete for processing resources with threat-relevant cues. In the original probe detection task participants were presented with neutral and threat-relevant information and their response latency to detect a visual probe replacing these words was measured. In the AMP training version of the task, participants respond to a visual probe that consistently replaces stimuli of neutral valence, thereby directing attention away from threat.
To our knowledge, three published studies have examined the efficacy of AMP in reducing symptoms in treatment-seeking individuals meeting diagnostic criteria for an anxiety disorder; two in generalized social phobia (GSP; Amir, Beard, Taylor et al., 2009; Schmidt et al., 2009) and one in generalized anxiety disorder (GAD; Amir, Beard et al., 2009). All three studies were randomized placebo-controlled double-blind trials. The placebo group (Attention Control Condition, ACC) was identical to AMP except that the location of the probe relative to the threatening or neutral stimuli was random (i.e., the probe replaced neutral stimuli on 50% of trials, and threatening stimuli on the other 50% of trials). Participants completed AMP or ACC twice weekly for four weeks. Each training session was approximately 20 minutes in duration.
Across all three RCTs, participants in the AMP group showed significantly larger reductions in clinician- and self-rated symptoms of anxiety and functional impairment relative to the control group. A recent meta-analysis found a medium-to-large effect of AMP on anxiety symptoms (averaged across all anxiety measures) relative to the ACC group (d = .78 in patient samples; Hakamata et al., 2010). Moreover, a significantly larger proportion of participants in the AMP group compared to the ACC group no longer met diagnostic criteria for the principal anxiety disorder diagnosis at post-assessment (loss of diagnosis: AMP, range 50% to 72%; ACC, range 11% to 14%). Finally, two of the trials conducted a formal mediation analysis (Mackinnon, Lockwood, Hoffman, West, & Sheets, 2002), demonstrating that change in attentional bias for threat mediated the reduction in interviewer-rated anxiety from pre- to post-assessment (Amir, Beard, Taylor et al., 2009; Amir, Beard et al., 2009). Considered together, these studies suggest that AMP may be an efficacious treatment for at least GSP and GAD.
Despite these initial promising findings, not all individuals who complete AMP show a reduction of symptoms. Therefore, it is important to examine patient characteristics that may account for variability in response to AMP. Doing so may ultimately inform treatment selection as well as methods for augmenting existing treatments. As Steketee and Chambless (1992, p. 387) pointed out, “If we can identify characteristics of clients that are associated with poor response to treatment, we may: (a) gain clues that lead to needed modifications to treatment procedures and (b) be able to match patients to treatments that work best for those with their particular characteristics”. As a first step in this direction, we examined predictors of response to AMP in a large randomized clinical trial of patients seeking treatment for GSP.
There are at least two types of pre-treatment variables that can have predictive utility: Prognostic and Prescriptive (Kraemer, Wilson, Fairburn, & Agras, 2002, Fournier et al., 2009). A prognostic variable predicts outcome irrespective of treatment condition. Prognostic variables are either identified in single-treatment designs (i.e., when there is no comparison condition) or when a variable is associated with outcome across multiple treatments (i.e., a main effect of the pre-treatment variable on outcome). A prescriptive variable or moderator (Baron & Kenny, 1986) predicts differential treatment response between two or more treatment conditions (i.e. an interaction effect).
Our selection of predictor variables was guided by previous recommendations in prediction research (e.g., Kazdin, 2008; Kraemer et al., 2002; Steketee & Chambless, 1992). We began by identifying baseline demographic and clinical characteristics in our sample that have been examined in previous research examining predictors of treatment response in SP (e.g., Hofmann, 2000; Rodebaugh, Holaway, & Heimberg, 2004) as well as the extant literature more broadly (e.g., Fournier et al., 2009). These variables were categorized into the following domains: (1) demographic characteristics (e.g., age, gender), and (2) clinical characteristics (e.g., severity of co-occurring depression, Axis I comorbidity).
Next, we followed recommendations that the selection of predictor variables should be informed by theory about the mechanisms hypothesized to underlie to treatment effects (e.g., Kazdin, 2008; Kraemer et al., 2002). Accordingly, we selected potential predictor variables based on information processing theories of anxiety (e.g., Mathews & MacLeod, 2005) and prior research on the mechanisms of action in AMP (e.g., Amir, Beard, Taylor et al., 2009). These variables were categorized as cognitive disturbance factors. We identified two cognitive disturbance factors hypothesized to be central to the maintenance of SP, namely (1) attentional bias for threat (Mathews & MacLeod, 2005; Williams et al., 1997; see also Bögels & Mansell, 2004) and (2) social interpretation bias (e.g., Clark & Wells, 1995; Hofmann, 2007; Rapee & Heimberg, 1997).
Previous research in analogue (Amir et al., 2008) and treatment-seeking samples (Amir, Beard, Taylor et al., 2009; Amir, Beard et al., 2009) suggest that anxiety reduction associated with AMP occurs through a change in attention bias for threatening cues. Thus, to the extent that the modification of attentional bias for threat is a key target of AMP, we expected that patients with GSP who displayed the greatest attentional bias at baseline would be the ones who would benefit most from this intervention; that is, attentional bias is hypothesized to have a prescriptive effect on response to AMP. We also chose to examine social interpretation bias as a predictor of response to AMP because this cognitive bias is a core feature of cognitive models of SP (e.g., Clark & Wells, 1995; Hofmann, 2007; Rapee & Heimberg, 1997) and has been shown to be associated with social anxiety reduction in CBT regimens (e.g., Foa, Franklin, Perry, & Herbert, 1996; Hofmann, 2004; Smits, Rosenfield, McDonald, & Telch, 2006; Taylor & Alden, 2008; Wilson & Rapee, 2005).
In the current study, we explored the prognostic and prescriptive predictive value of pre-treatment variables assessed in the context of two RCTs testing the efficacy of AMP for GSP. We followed the data analytic approach adopted by Fournier et al. (2009), first employing a stepwise procedure within the three broad predictor domains (demographics, clinical characteristics, and cognitive disturbance factors) and then testing a final model wherein we examined whether each of the previously identified predictors remained a significant predictor of outcome when all of the predictors were tested simultaneously in the same statistical model.
Method
Participants
The current sample comprised 112 individuals seeking treatment for GSP from January 2003 through October 2009. A subsample of participants (n = 48) are reported in Amir, Beard, Taylor et al., (2009). The remaining 64 participants completed the identical protocol as reported in that initial clinical trial. Accordingly, a full description of participant recruitment strategies, treatment conditions, and procedural details are described in that article. Participants met a principal DSM-IV diagnosis of GSP according to the Structured Clinical Interview for the DSM-IV (SCID; First, Spitzer, Gibbon, & Williams, 1994). Exclusionary criteria included: (a) evidence of suicidal intent, (b) evidence of current substance abuse or dependence, (c) evidence of current or past schizophrenia, bipolar disorder, or organic mental disorder, (d) any concurrent psychotherapy (e) change in pharmacological treatments during the 12 weeks prior to study entry, and (f) Cognitive Behavioral Therapy within the past 6 months.
Treatments
Prior to entering the trial, participants were randomly assigned to the Attention Modification Program (AMP, n = 55) or Attention Control Condition (ACC, n = 57) (see Amir, Beard, Taylor et al., 2009 for details). Participants, experimental assistants, and clinical evaluators were blind to treatment condition throughout the acute phase of treatment, which lasted for 8 sessions over four weeks (i.e., twice weekly sessions). Treatment completion rates were 91% across all participants (102/112); 98% in the AMP group (54/55) and 84% in the ACC group (48/57).
Outcome Measure
The primary outcome measure was the clinician-rated Liebowitz Social Anxiety Scale (LSAS; Liebowitz, 1987), a 24-item scale that separately assesses fear and avoidance of social interaction and performance situations. The LSAS has strong psychometric properties (Heimberg et al., 1999) and has been widely used in previous treatment outcome research in SP (e.g., Clark et al., 2006; Heimberg et al., 1998). Clinician ratings were made at pre- and post-assessment by raters blind to treatment condition. Inter-rater reliability ratings for the LSAS were obtained from three independent assessors who viewed videotapes of the assessments and who were blind to condition. Prior to rating the interviews, assessors were trained to criterion (e.g., 90% or higher) using standardized tapes created at our research center. Inter-rater reliability was high (Intra-class correlation coefficient = .88; see Amir, Beard, Taylor et al., 2009).
Potential Predictors
All potential predictors of treatment response were measured at baseline. Tables 1-3 present the means and standard deviations for each variable. We categorized variables according to one of the following three domains:
Table 1.
Demographic Characteristics
| Predictor | M | SD | ba | SE | p |
|---|---|---|---|---|---|
| Step 1 | |||||
| Age X Time | 30.7 | 11.1 | -0.06 | (0.04) | .13 |
| Gender X Time | 51 | -0.66 | (0.84) | .43 | |
| Ethnicity X Time | 67 | 2.71 | (0.86) | .002 | |
| Education X Time | 15.03 | 2.02 | 0.25 | (0.21) | .24 |
| Age X Treatment X Time | 0.02 | (0.07) | .83 | ||
| Gender X Treatment X Time | 1.47 | (1.67) | .38 | ||
| Ethnicity X Treatment X Time | -1.22 | (1.72) | .48 | ||
| Education X Treatment X Time | -0.03 | (0.43) | .95 | ||
|
| |||||
| Step 2 (retain effects at p < .20) | |||||
| Age X Time | -0.06 | (0.04) | .11 | ||
| Ethnicity X Time | 2.87 | (0.68) | <.001 | ||
|
| |||||
| Steps 3 and 4 (retain effects at p < .10 and p < .05, respectively) | |||||
| Ethnicity X Time | 2.84 | (0.68) | <.001 | ||
Note.
Values represent unstandardized beta coefficients predicting Liebowitz Social Anxiety Scale (LSAS) scores at the end of treatment. Interaction terms involving time only, represent the slope effect, per week, of the predictor variable on LSAS averaged across groups; while terms involving both treatment and time represent the difference in slopes between treatment groups.3 The significant predictors in the final step will be added to the final model containing all significant predictors from each domain.
Table 3.
Cognitive Disturbance Factors
| Predictor | M | SD | ba | SE | p |
|---|---|---|---|---|---|
| Step 1 | |||||
| Attentional Bias X Time | 5.66 | (33.37) | -0.03 | (0.01) | .02 |
| Interpretation Bias X Time | 1.57 | (0.49) | -0.09 | (0.90) | .92 |
| Attentional Bias X Treatment X Time | -0.05 | (0.03) | .08 | ||
| Interpretation Bias X Treatment X Time | -0.90 | (1.80) | .62 | ||
|
| |||||
| Step 2 (retain effects at p < .20) | |||||
| Attentional Bias X Time | -0.03 | (0.01) | .01 | ||
| Attentional Bias X Treatment X Time | -0.04 | (0.03) | .09 | ||
|
| |||||
| Steps 3 and 4 (retain effects at p < .10 and p < .05, respectively) | |||||
| Attentional Bias X Time | -0.02 | (0.01) | .05 | ||
| Attentional Bias X Treatment X Time | -0.07 | (0.02) | .003 | ||
Note.
Values represent unstandardized beta coefficients predicting Liebowitz Social Anxiety Scale (LSAS) scores at the end of treatment. Interaction terms involving time only, represent the slope effect, per week, of the predictor variable on LSAS averaged across groups; while terms involving both treatment and time represent the difference in slopes between treatment groups.3 The significant predictors in the final step will be added to the final model containing all significant predictors from each domain.
Demographic characteristics
The following four variables comprised this domain: gender, age, ethnicity [(dichotomized as Caucasian vs. non-Caucasian; see Fournier et al. (2009)], and years of education.
Clinical characteristics
Current psychiatric functioning was assessed using a battery of clinician- and self-rated measures at pre-assessment. The following three variables comprised this domain: Axis I comorbidity (presence of any comorbid Axis I condition as measured by the SCID-IV), general trait anxiety (assessed with the self-reported State Trait Anxiety Inventory-Trait [STAI-T]; Spielberger, Gorsuch, Lushene, Vagg, & Jacobs, 1983) and depression (assessed by the clinician-administered Hamilton Rating Scale for Depression [HAM-D]; Hamilton (1960).
Cognitive Disturbance Measures
This domain comprised two variables: Attentional bias for threat was derived from the modified probe detection task (MacLeod et al., 1986) using a standardized set of male and female faces portraying disgust and neutral expressions (Matsumoto & Ekman, 1988). On each trial, two faces of the same individual were presented for 500ms, one face on top and one on bottom, with each pair displaying one of two combinations of emotions (i.e., neutral and disgust, or neutral and neutral). We compared response latencies to visual probes following one of two neutral faces (N-N trials) to response latencies to probes following a neutral face when the other face displayed a disgust expression (N-D trials). Attentional bias for threat is indexed by slower response latencies when responding to a probe following a neutral face in the N-D trials compared to responding to a probe following a neutral face in the N-N trials (see Koster, Crombez, Verschuere, & De Houwer, 2004; Klumpp & Amir, 2009; Salemink, van den Hout, & Kindt, 2007).
Social interpretation bias was assessed using the Interpretation Questionnaire (Amir, Foa, & Coles, 1998). This questionnaire comprises 22 ambiguous scenarios (e.g., “You see a group of friends having lunch, they stop talking when you approach”) and three interpretations for each scenario (i.e., positive: “They are about to ask you to join,” negative: “They were saying negative things about you,” and neutral: “They just ended their conversation”). Participants are asked to rank order how likely each interpretation would be to come to mind if they were in a similar situation. Thus, scores ranged from 1 to 3. We used participants’ rankings of the negative interpretations of the social scenarios as the measure of interpretation bias. Lower scores (i.e., 1) reflected a greater tendency to make negative interpretations of ambiguous social scenarios.
Statistical Analyses
Our primary statistical analyses investigated the association between possible prognostic and prescriptive predictors of symptom change (clinician-administered LSAS) from pre- to post-treatment. To address this issue, we were guided by the conceptual and data analytic approach advocated by Kraemer et al. (2002) and Fournier et al. (2009). We used mixed models regression in which we regressed repeated measures of LSAS on time, group, covariates of interest, and their interactions. We also included random effects for intercept and slope. Time is shifted, as in Fournier et al. (2009) so that intercept estimates represent the LSAS scores at post-treatment. Continuous covariates were centered at the grand mean and dichotomous covariates were parameterized as -1/2 and 1/2. While missing data was minimal in this study (e.g. 10/112 = 8.9% of post-intervention LSAS scores), note that the mixed effects model accommodates missing data under the missing-at-random assumption and honors the intent-to-treat principle (Verbeke & Molenberghs, 2005). All analyses were carried out in R version 2.11 (R Development Core Team, 2010) and mixed models were fitted using nlme (Pinheiro et al., 2009)
Our models included estimates of prognostic and prescriptive effects. As described above: A prognostic variable predicts outcome irrespective of treatment (i.e., main effect of predictor), which would identify predictors of response common to AMP and ACC. In keeping with Kraemer et al. (2002), prognostic predictors were required to have a significant effect (p < .05) on the linear slope estimates averaged across groups (i.e., Predictor x Time interaction). A prescriptive variable or moderator (Baron & Kenny, 1986) predicts differential treatment response between two or more treatment conditions (i.e. an interaction effect). Following Kraemer et al. (2002), interactive effects of the predictor and treatment correspond to differences between the effects of the predictor variable on the linear slope estimates of the two groups. Thus, to establish whether a variable was prescriptive, we examined Predictor x Treatment (AMP, ACC) interaction effects at the linear slope estimates (i.e., Predictor x Treatment x Time interaction).
We classified the potential predictors as pertaining to either demographic characteristics (e.g., age), clinical characteristics (e.g., depression), or cognitive disturbance factors (e.g., attentional bias for threat; social interpretation bias) and analyzed the three domains separately. Following Fournier et al. (2009), we used a step-wise procedure within each domain. Step 1 tested the significance of the overall model that included all variables from a given domain. Step 2 retained variables from Step 1 that were significant at p < 0.20. Effects in the multivariate models were in turn screened at the p < 0.10 (Step 3), and p < 0.05 (Step 4) levels. All predictors found be significant in Step 4 from each of the three domains were combined in a final model. This final step allowed us to test the effects of each variable while simultaneously controlling for each of the other significant predictors.
Results
Preliminary Analyses
To ensure that random assignment did not create groups differing in baseline characteristics, we conducted chi-square tests for categorical variables and t-tests for continuous variables comparing groups at pre-treatment on each predictor variable and dependent outcome. Results revealed that the AMP and ACC groups did not differ on any demographic, clinical, or cognitive disturbance variables (ps > .2) with two exceptions: A greater proportion of patients in the AMP group met diagnostic criteria for a comorbid Axis-I condition (53%) relative to the ACC group (32%), [χ2(1) = 5.14, p = .02]. Participants in the AMP group also had larger attentional bias scores at baseline compared to the ACC group, [AMP: M = 12.45 (SD = 35.75); ACC: M = -0.89 (SD = 29.77), t(110) = -2.12, p = .04].1, 2
Treatment Outcome
Although previous research supports the efficacy of AMP in reducing symptoms of social anxiety relative to placebo control (Amir, Beard, Taylor et al., 2009; Schmidt et al., 2009), we wanted to confirm that similar results were obtained in the larger current sample. Results of the mixed models regression analysis on the primary outcome measure (LSAS) revealed significant group differences in treatment response, [t(100) = -3.23, p = .002]. Thus, consistent with our earlier findings (Amir, Beard, Taylor et al., 2009), the AMP group displayed a significantly larger reduction in clinician-rated social anxiety symptoms from pre- to post-assessment relative to the ACC group.
Omnibus Tests of the Three Predictor Domains
Consistent with Fournier et al. (2009), we first compared the relative fit of a larger prediction model containing all predictor variables for a particular domain to a smaller, simpler model that only included repeated measures of LSAS, group, and their interaction. All of the three domains examined fit the data better than the simple model, as indicated by significant likelihood ratio chi-square tests: demographic characteristics, [χ2(24) = 48.6, p < .001], clinical characteristics, [χ2(20) = 31.6, p = .002], and cognitive disturbance factors, [χ2(16) = 26.6, p < .001].
Step-Wise Analyses of Each Domain of Predictors
Tables 1-3 present the results of the step-wise analyses for each of the three domains of predictor variables. In keeping with Kraemer et al. (2002), we present results from the prediction of the linear slope effects representing change in LSAS. Thus, the unstandardized b estimates in the Tables can be interpreted as follows: For interaction terms involving time, b represents the slope effect of the predictor on LSAS, per week, averaged across groups. For interaction terms involving both time and treatment, b represents the difference in slope effects between treatment groups. In the sections below we report significance tests of the linear slope effects of the individual prognostic and prescriptive variables that emerged from these analyses as well as the Mean ± SE.3
Demographic characteristics
Results revealed one prognostic variable, ethnicity, that was associated with change in LSAS scores, [t (96) = 4.20, p < .001, 2.86 ± 0.68]. Thus, across both conditions, participants who self-identified as non-Caucasian displayed better response to the interventions. No prescriptive variables were found in this domain.
Clinical characteristics
Of the three variables that comprised this domain, none had a significant prognostic or prescriptive effect on treatment outcome.
Cognitive disturbance factors
Results revealed one prescriptive variable that emerged from this domain: Attentional bias for threat scores at baseline predicted a differential effect of treatment on change in LSAS, [t (90) = -3.06, p = .003, -0.07 ± 0.02]. No prognostic variables were found to predict treatment response in this domain.
Final Model with All Significant Predictors
Once we identified significant prognostic and prescriptive variables within each domain, these variables were entered simultaneously into a final model that allowed us to test the effect of each predictor on treatment outcome while controlling for the effects of the others. See Table 4. Results revealed that one prognostic variable – ethnicity – remained a significant predictor of treatment outcome when controlling for the other variables: [t (84) = 3.15, p = .002, 2.27 ± 0.72]. Thus, across both conditions, participants who self-identified as non-Caucasian displayed better treatment response compared to Caucasian participants.
Table 4.
Final Model With All Significant Predictors From the Domain Models
| Predictor | M | SD | ba | SE | t (df) | p |
|---|---|---|---|---|---|---|
| Attentional Bias X Time | -0.01 | (0.01) | -1.24 | .22 | ||
| Ethnicity X Time | 2.27 | (0.72) | 3.15 | .002 | ||
| Attentional Bias X Treatment X Time | -0.05 | (0.02) | -2.46 | .02 |
Note. HAM-D: The Hamilton Rating Scale for Depression.
Note.
Values represent unstandardized beta coefficients predicting Liebowitz Social Anxiety Scale (LSAS) scores at the end of treatment. Interaction terms involving time only, represent the slope effect, per week, of the predictor variable on LSAS averaged across groups; while terms involving both treatment and time represent the difference in slopes between treatment groups.3
The only prescriptive variable that emerged from the step-wise analyses in each domain – attentional bias for threat – retained its prescriptive effect on treatment outcome in the final model, [t (84) = -2.46, p = .016, -0.05 ± 0.02]. To elucidate the nature of this interaction, we conducted a regions of significance analysis using the Johnson-Neyman technique (Johnson & Neyman, 1936). This procedure identifies the specific values of the predictor variable at which the treatment groups significantly differed on change in social anxiety symptoms from pre- to post-treatment. This analysis identified -5.5 on our measure of attentional bias for threat as a point of transition between a statistically significant and a statistically non-significant effect of the interventions. Specifically, this analysis revealed that for bias scores greater than -5.5ms to the highest value observed (153ms), the AMP group displayed a significantly larger decrease in social anxiety symptoms relative to the ACC group. However, at bias scores below -5.5ms to the lowest observed value (-88ms), the AMP and ACC groups did not differ significantly on clinical improvement. These findings are illustrated in Figure 1. For ease of interpretation, we present baseline corrected change in LSAS scores from pre- to post-treatment at different levels of attentional bias for the AMP and ACC groups.4
Figure 1.
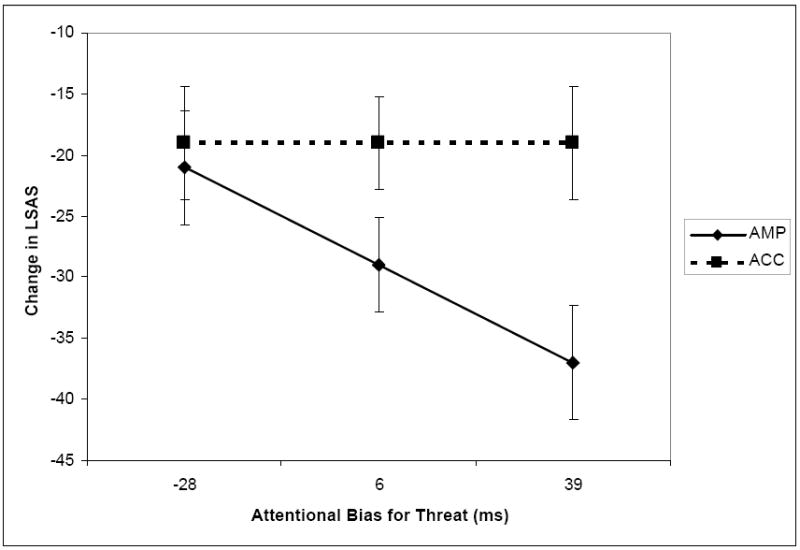
Estimated baseline corrected reduction in Liebowitz Social Anxiety Scale (LSAS) scores from pre- to post-treatment for the AMP and ACC groups at different levels of attentional bias scores, i.e., the mean attentional bias score (in ms) for the sample (M = 6, SD = 33), one standard deviation below the mean (28), and one standard deviation above the mean (38). Error bars represent ±1 standard error.
Discussion
Although previous research supports the efficacy of computerized attention modification programs (AMP) for GSP (Amir, Beard, Taylor et al., 2009; Schmidt et al., 2009), individuals vary in their response to these treatments. Accordingly, our goal in this study was to identify predictors of response to AMP for GSP. We found one prognostic and one prescriptive variable that predicted response to the interventions. Participants who self-identified as non-Caucasian displayed better treatment response across both interventions compared to Caucasian participants. The most robust prescriptive variable was attentional bias for threat scores at pre-assessment. Specifically, participants in the AMP group who exhibited a greater tendency to preferentially allocate their attention toward social threat cues at baseline displayed significantly larger reductions in clinician-rated social anxiety symptoms relative to their counterparts in the ACC group. However, AMP did not differ in its efficacy from the placebo control condition for participants who did not present with attentional bias difficulties at pre-treatment. These findings point to a particular subgroup of individuals with GSP for whom attentional retraining programs may be most beneficial.
Although we made no a priori predictions about variables that would display common effects on treatment outcome across both AMP and placebo conditions, we found that ethnicity emerged as a prognostic predictor of treatment response. In the absence of clear hypotheses about the prognostic effect of ethnicity on treatment response, we are hesitant to speculate about the mechanism that may account for the observed findings. Nevertheless, there are several features of the computerized attentional training procedures that may make them particularly amenable to administration across participants with diverse ethnic backgrounds. First, given that the training stimuli comprised non-semantic material (i.e., faces), minimal language requirements (i.e., English fluency) were needed to complete the task. Second, the pictorial stimuli comprised both Caucasian and non-Caucasian actors. However, given our modest sample size, the dichotomization of ethnicity into Caucasian vs. non-Caucasian groups was relatively crude and obscured examination of treatment response in individual minority groups (e.g., Hispanics). Research in larger samples is needed to establish the robustness of this variable in predicting response to AMP.
The only prescriptive variable that accounted for variability in response to AMP was attentional bias scores. Participants in the AMP group who exhibited a greater tendency to allocate their attention toward social threat cues at baseline (i.e., attentional bias score > -5ms) displayed significantly greater reductions in clinician-rated social anxiety symptoms relative to the ACC group. These findings point to a particular subgroup of individuals with GSP for whom AMP may be most effective and illuminate the boundaries within which attentional retraining procedures may yield the greatest clinical benefit.
It is notable that the pre-treatment variable that accounted for the greatest variance in treatment response (i.e., attentional bias for threat) is the also the primary treatment target and mechanism of action of AMP (Amir et al., 2008; Amir, Beard, Taylor et al., 2009). At first glance it may seem insignificant to find a predictor variable that represents the target of the intervention. However, we wish to clarify that the predictive value of baseline attentional bias scores is far from trivial because it was not used to predict effects of AMP on change in attentional bias per se, but rather it significantly accounted for the effects of AMP on change in clinical symptoms of social anxiety. These findings may have implications for current approaches to treatment prediction research. Researchers have highlighted at least two fundamental issues that pose challenges in identifying reliable predictors of treatment response. First, the examination of predictor variables is often disconnected from theory or knowledge about the mechanisms that underlie treatment effects (Kraemer et al., 2002; Steketee & Chambless, 1992). Commonly examined patient characteristics such as demographic factors (e.g., age, socioeconomic status) and clinical characteristics (e.g., co-occurring Axis I or II pathology) are often distal to the purported mechanisms of action of existing treatments. To facilitate the search for predictors, a more fruitful, theory-driven approach may be to first identify basic mechanisms of anxiety pathology and develop treatments that directly target those mechanisms. The current findings are consistent with this approach through elucidating a predictor variable (i.e., attentional bias) that is more proximal to, i.e., more directly influences the specific treatment targets or mechanisms of action of a particular intervention.
A second fundamental issue in prediction research is that existing evidence-based psychosocial treatments (e.g., CBT) are heterogeneous, both in terms of treatment procedures and implementation across studies. For example, traditional CBT comprises a number of different treatment techniques (e.g., exposure, cognitive restructuring, social skills training, anxiety management) and different studies often emphasize some components over others or exclude them altogether (Clark et al., 2006; Davidson et al., 2004; Heimberg et al., 1998). Moreover, even the same procedure (e.g., cognitive restructuring) is unlikely to be delivered in the same format across participants and studies. Thus, because methodologies vary across studies and treatment regimens are multifaceted, it is not surprising that consistent treatment predictors are difficult to find across studies (Steketee & Chambless, 1992). However, AMP is a distilled treatment (i.e., has a specifiable treatment target) that can be delivered in a consistent manner across patients and studies.
Future research could build on the current study in several ways. First, because the current study examined predictors of response to AMP in relation to a placebo control condition, we cannot make definitive conclusions about whether patients who displayed greater attentional allocation toward threat cues would have displayed worse treatment outcomes if given a different active treatment (e.g., CBT) relative to AMP – or conversely, whether patients with a lower attentional bias for threat may experience superior treatment outcomes if given an alternate intervention. However, research suggests that attentional bias for threat predicts poor response to CBT (Legerstee et al., 2009). These findings suggest that AMP may modify a cognitive process that predicts diminished response to CBT. Future research should examine predictors of clinical improvement for AMP in relation to other treatments with proven efficacy in the treatment of GSP.
Another limitation is that we adopted a post hoc exploratory approach to examine predictors of response to AMP. Thus, we did not collect data on the full range of potential demographic, clinical, or cognitive disturbance variables that may account for variability in response to AMP. A related point is that a portion of the current sample was archival (Amir, Beard, Taylor et al., 2009). Another caveat is that the groups differed at baseline on the main prescriptive variable. However, a sensitivity analysis conducted on the final prediction model that included all attentional bias terms and their interactions with time and group confirmed that baseline group differences could not account for the observed effects. Nevertheless, a prospective research design, namely one that allocates participants to condition on a stratified random basis according to baseline attentional bias scores, is needed to confirm the robustness of attentional bias for threat as a predictor of AMP response. Future research should also examine predictors of response to AMP using more objective outcome measures (e.g., behavioral assessment). Finally, it remains to be established whether the current findings will generalize to different patient populations (e.g., GAD) or to attentional retraining programs that use different stimuli (e.g., words) or differ in the frequency or duration of sessions.
The current limitations notwithstanding, this study is the first to illuminate patient characteristics that predict response to AMP. Should these results replicate in future studies, they may provide clinically valuable information that could be used to guide decisions about whether to provide AMP to a particular individual with GSP, or for whom alternate treatments might be more appropriate. Moreover, the present study points to the potential value of adopting a translational research approach – one that draws on advances in basic experimental psychopathology research – to resolve common problems in prediction research. Attention Modification Programs as well as other treatments derived from basic cognitive science (see Koster, Fox, & MacLeod, 2009) may be particularly promising interventions for moving towards personalized interventions for anxiety, given that they (1) target a specifiable mechanism of anxiety maintenance, (2) can be easily administered in standardized form, and (3) are distilled.
Table 2.
Clinical Characteristics
| Predictor | M | SD | ba | SE | p |
|---|---|---|---|---|---|
| Step 1 | |||||
| Comorbidity X Time | 47 | 0.41 | (0.93) | .66 | |
| STAI-T X Time | 57.3 | (10.9) | -0.01 | (0.05) | .87 |
| HAM-D X Time | 10.16 | (5.6) | -0.13 | (0.09) | .17 |
| Comorbidity X Treatment X Time | 0.44 | (1.87) | .82 | ||
| STAI-T X Treatment X Time | -0.02 | (0.09) | .80 | ||
| HAM-D X Treatment X Time | 0.08 | (0.18) | .66 | ||
|
| |||||
| Steps 2 and 3 (retain effects at p < .20 and p < .10, respectively) | |||||
| HAM-D X Time | -0.13 | (0.07) | .09 | ||
|
| |||||
| Step 4 (retain effects at p < .05) Nonsignificant | |||||
| HAM-D X Time | -0.13 | (0.07) | .09 | ||
Note. STAI-T = State Trait Anxiety Inventory – Trait; HAM-D: The Hamilton Rating Scale for Depression.
Note.
Values represent unstandardized beta coefficients predicting Liebowitz Social Anxiety Scale (LSAS) scores at the end of treatment. Interaction terms involving time only, represent the slope effect, per week, of the predictor variable on LSAS averaged across groups; while terms involving both treatment and time represent the difference in slopes between treatment groups.3 The significant predictors in the final step will be added to the final model containing all significant predictors from each domain.
Acknowledgments
This research was supported by grants from the National Institutes of Health (R34 MH073004-01, R34 MH077129-01) awarded to the first author and a Social Sciences and Humanities Research Council of Canada (SSHRC) postdoctoral fellowship awarded to the second author. We would like to thank Sadia Najmi, Jessica Bomyea, Amanda Morrison, Christal Badour, and Ken Thompson for their help with data collection and management.
Footnotes
The planned stepwise procedure did not retain an effect for attentional bias scores or its interaction with time in the ACC group. However, given our concerns that baseline group differences in attentional bias scores could confound interpretation of the prescriptive effect of this covariate in the final prediction model, we fit an additional final model as a sensitivity analysis that included all attentional bias terms and their interactions with time and group. Results of this analysis were consistent with the final model reported in the main text.
Comorbidity status did not emerge as a significant predictor in any of the models tested. However, given baseline group differences in proportion of comorbid Axis I conditions, we believed it to be prudent to fit an additional final model that included all comorbidity terms and their interactions with time and group. Results of this analysis were consistent with the final model reported in the main text.
Although intercept terms were included in the prediction models, they are not reported in the paper as they are not relevant to the study hypotheses regarding prognostic and prescriptive effects on treatment response (see Kraemer et al., 2002).
Following the suggestion of an anonymous reviewer in response to an earlier draft of this paper, we fit additional prediction models in which treatment outcome was predicted by the variables of interest within the AMP and ACC groups separately. Results of these analyses were consistent with those reported in the main text. Specifically, the linear slope effects were significant for ethnicity in both the AMP and ACC subgroup analyses (both p < .05), suggesting a non-specific, prognostic effect of ethnicity on response to the interventions. Moreover, the linear slope estimates for attentional bias scores were significant in the AMP group (p < .001), but not in the ACC group (p = .66), suggesting a prescriptive effect of attentional bias on treatment response.
Publisher's Disclaimer: The following manuscript is the final accepted manuscript. It has not been subjected to the final copyediting, fact-checking, and proofreading required for formal publication. It is not the definitive, publisher-authenticated version. The American Psychological Association and its Council of Editors disclaim any responsibility or liabilities for errors or omissions of this manuscript version, any version derived from this manuscript by NIH, or other third parties. The published version is available at www.apa.org/pubs/journals/ccp
Contributor Information
Nader Amir, Department of Psychology, San Diego State University.
Charles T. Taylor, Department of Psychology, San Diego State University
Michael C. Donohue, Department of Family and Preventive Medicine, Division of Biostatistics and Bioinformatics, University of California, San Diego
References
- Amir N, Beard C, Burns M, Bomyea J. Attention modification program in individuals with Generalized Anxiety Disorder. Journal of Abnormal Psychology. 2009;118:28–33. doi: 10.1037/a0012589. [DOI] [PMC free article] [PubMed] [Google Scholar]
- Amir N, Beard C, Taylor CT, Klumpp H, Elias J, Burns M, Chen X. Attention training in individuals with generalized social phobia: A randomized controlled trial. Journal of Consulting and Clinical Psychology. 2009;77:961–973. doi: 10.1037/a0016685. [DOI] [PMC free article] [PubMed] [Google Scholar]
- Amir N, Foa EB, Coles ME. Negative interpretation bias in social phobia. Behavior Research & Therapy. 1998;36:945–958. doi: 10.1016/s0005-7967(98)00060-6. [DOI] [PubMed] [Google Scholar]
- Amir N, Weber G, Beard C, Bomyea J, Taylor CT. The effect of a single session attention modification program on response to a public speaking challenge in socially anxious individuals. Journal of Abnormal Psychology. 2008;117:860–868. doi: 10.1037/a0013445. [DOI] [PMC free article] [PubMed] [Google Scholar]
- Bar-Haim Y, Lamy D, Pergamin L, Bakermans-Kranenburg MJ, van IJzendoorn MH. Threat-related attentional bias in anxious and nonanxious individuals: A meta-analytic study. Psychological Bulletin. 2007;133:1–12. doi: 10.1037/0033-2909.133.1.1. [DOI] [PubMed] [Google Scholar]
- Barlow DH. Clinical Handbook of Psychological Disorders: A Step-by-Step Treatment Manual. Fourth Edition. The Guilford Press; 2007. [Google Scholar]
- Baron R, Kenny D. The moderator–mediator variable distinction in social psychological research: Conceptual, strategic, and statistical considerations. Journal of Personality and Social Psychology. 1986;51:1173–1182. doi: 10.1037//0022-3514.51.6.1173. [DOI] [PubMed] [Google Scholar]
- Bögels S, Mansell W. Attention processes in the maintenance and treatment of social phobia: Hypervigilance, avoidance and self-focused attention. Clinical Psychology Review. 2004;24:827–856. doi: 10.1016/j.cpr.2004.06.005. [DOI] [PubMed] [Google Scholar]
- Chambless DL, Tran GQ, Glass CR. Predictors of response to cognitive-behavioral group therapy for social phobia. Journal of Anxiety Disorders. 1997;11:221–240. doi: 10.1016/s0887-6185(97)00008-x. [DOI] [PubMed] [Google Scholar]
- Clark DM, Ehlers A, Hackmann A, McManus F, Fennell M, Grey N, et al. Cognitive therapy versus exposure and applied relaxation in social phobia: A randomized controlled trial. Journal of Consulting and Clinical Psychology. 2006;74:568–578. doi: 10.1037/0022-006X.74.3.568. [DOI] [PubMed] [Google Scholar]
- Clark DM, Wells A. A cognitive model of social phobia. In: Heimberg RG, Liebowitz MR, Hope DA, Schneier FR, editors. Social phobia: Diagnosis, assessment, and treatment. New York: Guilford Press; 1995. pp. 69–93. [Google Scholar]
- Clarke P, MacLeod C, Shirazee N. Prepared for the worst: Readiness to acquire threat bias and susceptibility to elevate trait anxiety. Emotion. 2008;8:47–57. doi: 10.1037/1528-3542.8.1.47. [DOI] [PubMed] [Google Scholar]
- Davidson JR, Foa EB, Huppert JD, Keefe FJ, Franklin ME, Compton JS, et al. Fluoxetine, comprehensive cognitive behavioral therapy, and placebo in generalized social phobia. Archives of General Psychiatry. 2004;61:1005–1013. doi: 10.1001/archpsyc.61.10.1005. [DOI] [PubMed] [Google Scholar]
- Erwin BA, Heimberg RG, Juster H, Mindlin M. Comorbid anxiety and mood disorders among persons with social anxiety disorder. Behaviour Research and Therapy. 2002;40:19–35. doi: 10.1016/s0005-7967(00)00114-5. [DOI] [PubMed] [Google Scholar]
- Fan J, McCandliss BD, Sommer T, Raz A, Posner MI. Testing the efficiency and independence of attentional networks. Journal of Cognitive Neuroscience. 2002;14:340–347. doi: 10.1162/089892902317361886. [DOI] [PubMed] [Google Scholar]
- Foa EB, Franklin ME, Perry KJ, Herbert JD. Cognitive biases in generalized social phobia. Journal of Abnormal Psychology. 1996;105:433–439. [PubMed] [Google Scholar]
- First MB, Spitzer RL, Gibbon M, Williams JBW. Structured Clinical Interview for Axis I DSM-IV Disorders-Patient Edition. New York: Biometrics Research Department; 1994. [Google Scholar]
- Fournier JC, DeRubeis RJ, Shelton RC, Hollon SD, Amsterdam JD, Gallop R. Prediction of response to medication and cognitive therapy in the treatment of moderate to severe depression. Journal of Consulting and Clinical Psychology. 2009;77:775–787. doi: 10.1037/a0015401. [DOI] [PMC free article] [PubMed] [Google Scholar]
- Hakamata Y, Lissek S, Bar-Haim Y, Britton JC, Fox NA, Leibenluft E, et al. Attention bias modification treatment: A meta-analysis toward the establishment of novel treatment for anxiety. Biological Psychiatry. 2010;68:982–990. doi: 10.1016/j.biopsych.2010.07.021. [DOI] [PMC free article] [PubMed] [Google Scholar]
- Hamilton M. A rating scale for depression. Journal of Neurology, Neurosurgery, and Psychiatry. 1960;23:56–62. doi: 10.1136/jnnp.23.1.56. [DOI] [PMC free article] [PubMed] [Google Scholar]
- Heimberg RG, Horner KJ, Juster HR, Safren SA, Brown EJ, Schneier FR, Liebowitz MR. Psychometric properties of the Liebowitz Social Anxiety Scale. Psychological Medicine. 1999;29:199–212. doi: 10.1017/s0033291798007879. [DOI] [PubMed] [Google Scholar]
- Heimberg RG, Liebowitz MR, Hope DA, Schneier FR, Holt CS, Welkowitz LA, et al. Cognitive behavioral group therapy vs. Phenelzine therapy for social phobia. Archives of General Psychiatry. 1998;55:1133–1141. doi: 10.1001/archpsyc.55.12.1133. [DOI] [PubMed] [Google Scholar]
- Hofmann SG. Treatment of social phobia: Potential mediators and moderators. Clinical Psychology: Science and Practice. 2000;7:3–16. doi: 10.1093/clipsy/7.1.3. [DOI] [PMC free article] [PubMed] [Google Scholar]
- Hofmann SG. Cognitive mediation of treatment change in social phobia. Journal of Consulting and Clinical Psychology. 2004;72:392–399. doi: 10.1037/0022-006X.72.3.392. [DOI] [PMC free article] [PubMed] [Google Scholar]
- Hofmann SG. Cognitive factors that maintain social anxiety disorder: A comprehensive model and its treatment implications. Cognitive Behaviour Therapy. 2007;36:195–209. doi: 10.1080/16506070701421313. [DOI] [PMC free article] [PubMed] [Google Scholar]
- Johnson PO, Neyman J. Tests of certain linear hypotheses and their application to some educational problems. Statistical Research Memoirs. 1936;1:57–93. [Google Scholar]
- Kazdin AE. Evidence-based treatment and practice: New opportunities to bridge clinical research and practice, enhance the knowledge base, and improve patient care. American Psychologist. 2008;63:146–159. doi: 10.1037/0003-066X.63.3.146. [DOI] [PubMed] [Google Scholar]
- Klumpp H, Amir N. Examination of vigilance and disengagement of threat in social anxiety with a probe detection task. Anxiety, Stress, and Coping. 2009;22:283–296. doi: 10.1080/10615800802449602. [DOI] [PMC free article] [PubMed] [Google Scholar]
- Koster EHW, Crombez G, Verschuere B, De Houwer J. Selective attention to threat in the dot probe paradigm: Differentiating vigilance and difficulty to disengage. Behaviour Research and Therapy. 2004;42:1183–1192. doi: 10.1016/j.brat.2003.08.001. [DOI] [PubMed] [Google Scholar]
- Koster EHW, Fox E, MacLeod C. Introduction to the special section on cognitive bias modification in emotional disorders. Journal of Abnormal Psychology. 2009;118:1–4. doi: 10.1037/a0014379. [DOI] [PubMed] [Google Scholar]
- Kraemer HC, Wilson GT, Fairburn CG, Agras WS. Mediators and moderators of treatment effects in randomized clinical trials. Archives of General Psychiatry. 2002;59:877–884. doi: 10.1001/archpsyc.59.10.877. [DOI] [PubMed] [Google Scholar]
- Legerstee JS, Tulen JHM, Kallen VL, Dielgeman GC, Treffers PDA, Verhulst FC, Utens EMWJ. Threat-related selective attention predicts treatment success in childhood anxiety disorders. Journal of the American Academy of Child & Adolescent Psychiatry. 2009;48:196–205. doi: 10.1097/CHI.0b013e31819176e4. [DOI] [PubMed] [Google Scholar]
- Liebowitz MR. Social phobia. Modern Problems of Pharmacopsychiatry. 1987;22:141–173. doi: 10.1159/000414022. [DOI] [PubMed] [Google Scholar]
- MacLeod C, Mathews A, Tata P. Attentional bias in emotional disorders. Journal of Abnormal Psychology. 1986;95:15–20. doi: 10.1037//0021-843x.95.1.15. [DOI] [PubMed] [Google Scholar]
- MacLeod C, Rutherford E, Campbell L, Ebsworthy G, Holker L. Selective attention and emotional vulnerability: Assessing the causal basis of their association through the experimental manipulation of attentional bias. Journal of Abnormal Psychology. 2002;111:107–123. [PubMed] [Google Scholar]
- MacKinnon DP, Lockwood CM, Hoffman JM, West SG, Sheets V. A comparison of methods to test mediation and other intervening variable effects. Psychological Methods. 2002;7:83–104. doi: 10.1037/1082-989x.7.1.83. [DOI] [PMC free article] [PubMed] [Google Scholar]
- Mathews A, MacLeod C. Cognitive vulnerability to emotional disorders. Annual Review of Clinical Psychology. 2005;1:197–225. doi: 10.1146/annurev.clinpsy.1.102803.143916. [DOI] [PubMed] [Google Scholar]
- Matsumoto D, Ekman P. The Japanese and Caucasian Facial Expressions of Emotion (JACFEE) and Neutrals (JACNeuF) San Francisco, CA: Intercultural and Emotion Research Laboratory, Department of Psychology, San Francisco State University; 1988. [Google Scholar]
- Pinheiro J, Bates D, DebRoy S, Sarkar D the R Core team. nlme: Linear and Nonlinear Mixed Effects Models. R package version 3. 2009:1–96. [Google Scholar]
- R Development Core Team. R: A language and environment for statistical computing. R Foundation for Statistical Computing; Vienna, Austria: 2010. http://www.R-project.org. [Google Scholar]
- Rapee RM, Heimberg RG. A cognitive-behavioral model of anxiety in social phobia. Behaviour Research and Therapy. 1997;35:741–756. doi: 10.1016/s0005-7967(97)00022-3. [DOI] [PubMed] [Google Scholar]
- Rodebaugh T, Holaway R, Heimberg R. The treatment of social anxiety disorder. Clinical Psychology Review. 2004;24:883–908. doi: 10.1016/j.cpr.2004.07.007. [DOI] [PubMed] [Google Scholar]
- Salemink E, van den Hout MA, Kindt M. Selective attention and threat: Quick orienting versus slow disengagement and two versions of the dot probe task. Behaviour Research and Therapy. 2007;45:607–615. doi: 10.1016/j.brat.2006.04.004. [DOI] [PubMed] [Google Scholar]
- Schmidt NB, Richey JA, Buckner JD, Timpano KR. Attention training for generalized social anxiety disorder. Journal of Abnormal Psychology. 2009;118:5–14. doi: 10.1037/a0013643. [DOI] [PubMed] [Google Scholar]
- Smits J, Rosenfield D, McDonald R, Telch M. Cognitive mechanisms of social anxiety reduction: An examination of specificity and temporality. Journal of Consulting and Clinical Psychology. 2006;74:1203–1212. doi: 10.1037/0022-006X.74.6.1203. [DOI] [PubMed] [Google Scholar]
- Spek V, Nyklicek I, Cuijpers P, Pop V. Predictors of outcome of group and internet-based cognitive behavior therapy. Journal of Affective Disorders. 2008;105:137–145. doi: 10.1016/j.jad.2007.05.001. [DOI] [PubMed] [Google Scholar]
- Spielberger CD, Gorsuch RL, Lushene R, Vagg PR, Jacobs GA. Manual for the State-Trait Anxiety Inventory. Palo Alto, CA: Consulting Psychologist Press; 1983. [Google Scholar]
- Steketee G, Chambless DL. Methodological issues in prediction of treatment outcome. Clinical Psychology Review. 1992;12:387–400. [Google Scholar]
- Taylor CT, Alden L. Self-related and interpersonal judgment biases in social anxiety disorder: Changes during treatment and relationship to outcome. International Journal of Cognitive Therapy. 2008;1:125–137. [Google Scholar]
- Van Velzen C, Emmelkamp P, Scholing A. The impact of personality disorders on behavioral treatment outcome for social phobia. Behaviour Research and Therapy. 1997;35:889–900. doi: 10.1016/s0005-7967(97)00052-1. [DOI] [PubMed] [Google Scholar]
- Verbeke G, Molenberghs G. Longitudinal and incomplete clinical studies. Metron. 2005;63(2):143. [Google Scholar]
- Weierich MR, Treat TA, Hollingworth A. Theories and measurement of visual attentional processing in anxiety. Cognition and Emotion. 2008;22:985–1018. [Google Scholar]
- Williams JMG, Watts FN, MacLeod C, Mathews A. Cognitive psychology and emotional disorders. 2. Chichester: Wiley; 1997. [Google Scholar]
- Wilson J, Rapee R. The interpretation of negative social events in social phobia: Changes during treatment and relationship to outcome. Behaviour Research and Therapy. 2005;43(3):373–389. doi: 10.1016/j.brat.2004.02.006. [DOI] [PubMed] [Google Scholar]