Abstract
Background
Surveys are an important tool for gaining information about physicians' beliefs, practice patterns and knowledge. However, the validity of surveys among physicians is often threatened by low response rates. We investigated whether response rates to an international survey could be increased using a more personalized cover letter.
Methods
We conducted an international survey of the 442 surgeon-members of the Orthopaedic Trauma Association on the treatment of femoral-neck fractures. We used previous literature, key informants and focus groups in developing the self-administered 8-page questionnaire. Half of the participants received the survey by mail, and half received an email invitation to participate on the Internet. We alternately allocated participants to receive a “standard” or “test” cover letter.
Results
We found a higher primary response rate to the test cover letter (47%) than to the standard cover letter (30%) among those who received the questionnaire by mail. There was no difference between the response rates to the test and to the standard cover letters in the Internet group (22% v. 23%). Overall, there was a higher primary response rate for the test cover letter (34%) when both the mail and Internet groups were combined, compared with the standard cover letter (27%).
Conclusions
Our test cover letter to surgeons in our survey resulted in a significantly higher primary response rate than a standard cover letter when the survey was sent by mail. Researchers should consider using a more personalized cover letter with a postal survey to increase response rates.
Abstract
Contexte
Les sondages sont un moyen important de réunir de l'information sur les croyances des médecins, les tendances de leur pratique et leurs connaissances. Les faibles taux de réponse menacent souvent toutefois la validité des sondages chez les médecins. Nous avons cherché à déterminer s'il serait possible d'augmenter les taux de réponse à un sondage international en utilisant une lettre d'accompagnement plus personnalisée.
Méthodes
Nous avons réalisé un sondage international sur le traitement des fractures du col du fémur auprès des 442 chirurgiens membres de l'Orthopaedic Trauma Association. Nous avons utilisé des publications, des personnes-ressources clés et des groupes de discussion pour créer un questionnaire de huit pages autoadministré. La moitié des participants ont reçu le questionnaire par la poste et la moitié ont été invités par courrier électronique à participer sur Internet. Nous avons réparti en alternance les participants pour qu'ils reçoivent une lettre d'accompagnement « type » ou « d'essai ».
Résultats
Nous avons constaté que la lettre d'accompagnement d'essai produisait un taux de réponse primaire plus élevé (47 %) que la lettre d'accompagnement type (30 %) chez les médecins qui ont reçu leur questionnaire par la poste. Il n'y avait aucune différence entre les taux de réponse aux lettres d'accompagnement d'essai et lettres types chez les membres du groupe Internet (22 % c. 23 %). Dans l'ensemble, la lettre d'accompagnement à l'essai a produit un taux de réponse primaire plus élevé (34 %) lorsque l'on combine les groupes qui l'ont reçue par la poste et par courriel comparativement à la lettre d'accompagnement type (27 %).
Conclusions
La lettre d'accompagnement d'essai que nous avons envoyée aux chirurgiens dans le cadre de notre sondage a produit un taux de réponse primaire beaucoup plus élevé que la lettre d'accompagnement type lorsque le questionnaire a été envoyé par la poste. Les chercheurs devraient envisager de joindre une lettre d'accompagnement plus personnalisée à un sondage postal afin d'augmenter les taux de réponse.
In health research, we often conduct health care surveys to study the attitudes, beliefs, behaviours, practice patterns and concerns of physicians.1 For physician surveys, we find that response rates are typically low. A recent review found that mail surveys published in medical journals had a mean response rate of 62% (standard deviation [SD] 15%).2 Specifically in surveys of surgeons, response rates have been as low as 15% and as high as 77%.3–6 Response rates may be low, because increasing practice workloads cause physicians to place a low priority on completing surveys. Nonresponse bias can occur when response rates are low and can threaten the validity of a survey.1,7,8
The current standard for conducting mail and Internet surveys is Dillman's Tailored Design Method.9 The success of these strategies in achieving higher response rates in the general population was recently verified in a Cochrane Methodology Review.10,11 In physician surveys, similar strategies such as monetary incentives, stamps on outgoing and return envelopes, and short questionnaires have been confirmed as being quite effective.1
Given the reported low response rates among surgeons, it is important to explore alternative survey administration strategies to improve response rates. Dillman suggests writing a cover letter that is short and has a personal style that simulates conversational communication with a friendly acquaintance.9 Dillman considers the following elements essential for an effective letter: (1) the date, (2) the recipient's name and address on the letter as well as the envelope, (3) an appropriate salutation, (4) a description of what is being requested and why, (5) a statement that answers are confidential and participation is voluntary, (6) the enclosing of a stamped return envelope and a token of appreciation, (7) a statement concerning who to contact with questions and (8) the inclusion of a signature written, and not typed, in contrasting ink. The use of a personalized cover letter can increase physician response rates,12 as can a personalized note from the principal investigator.13
We chose to investigate the effect of a more personal approach in our cover letter on an international survey of surgeons. We hypothesized that surgeons who were invited to participate in the questionnaire with a letter that emphasized the importance of their individual response and their expertise would participate at a higher rate. Therefore, we examined the effect of 2 different cover letters on primary response rates among surgeons.
Methods
As we currently have little information about the preferences and practice patterns of orthopedic traumatologists in the operative treatment of femoral-neck fractures, we decided to develop an 8-page self-administered questionnaire to ask them about treating these fractures. We identified 6 areas of importance using previous literature, focus groups and key informants: (1) surgeons' experience, (2) classification of fracture types, (3) treatment options, (4) technical considerations in the operative technique, (5) predictors of patient outcome and (6) patient outcomes. We established the comprehensibility, face validity and content validity of the questionnaire by pretesting it with a similar group of surgeons.14 We administered both a paper version and an Internet version of the questionnaire, in which the questions were displayed in exactly the same order and format.
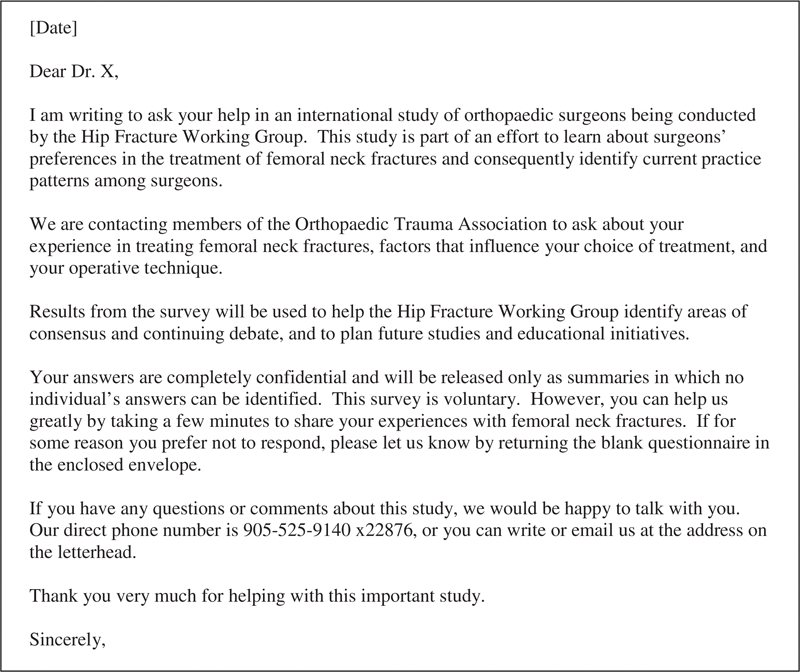
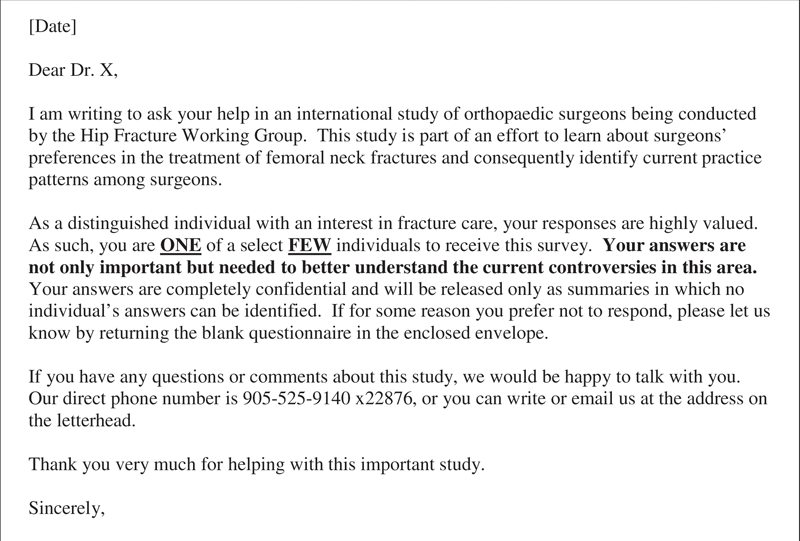
We administered the survey to the 442 surgeon-members of the Orthopaedic Trauma Association using the association's alphabetical membership list. The participants were either given a paper version of the questionnaire or invited to complete the questionnaire on the Internet. One of us (P.L.) then alternately allocated the participants to receive either a “standard” or a novel “test” cover letter. The standard cover letter was a modified version of the cover letter recommended by Dillman,9 and the test cover letter used a more personal approach, which stressed the importance of the individual's response (Fig. 1 and Fig. 2).

FIG. 1. Text for standard cover letter. The standard cover letter was a modified version of the cover letter recommended by Dillman. 9 We sent this standard cover letter by mail ( n = 111) or by email ( n = 111) to participants, inviting them to complete our survey.

FIG. 2. Text for test cover letter. The test cover letter used a more personal approach, which stressed the importance of the individual's response. We sent this test cover letter by mail ( n = 110) or by email ( n = 110) to participants, inviting them to complete our survey.
We made up to 5 contacts with the participants, which included a pre-notification and initial administration of the questionnaire, with additional contacts for nonrespondents. It was only at the time of the initial survey administration that the “standard” and “test” cover letters were used. We compared the 2 groups at 6 weeks, before any additional copies of the survey were administered. Three follow-up contacts were initiated for all nonrespondents at 6 and 12 weeks, and a final mailing between 19 and 22 weeks. Before beginning this research, McMaster Research Ethics Board reviewed and approved our study.
We summarized response rates by the proportion of respondents in each of the 4 groups, namely, those who received a standard cover letter, standard email, the test cover letter or test email. We used χ2 analyses to compare the proportion of respondents between groups. All statistical tests were 2-sided, with a predetermined α level of 0.05.
Results
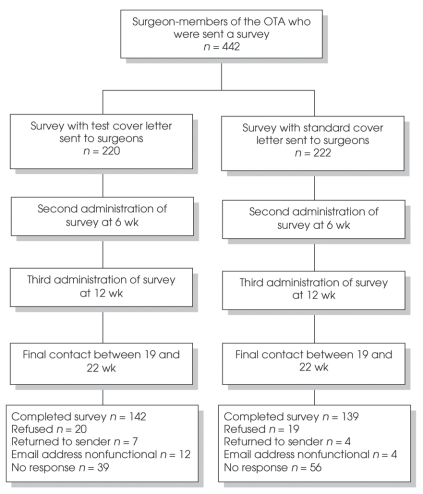
We sent half of the 442 surgeons a copy of the questionnaire by mail, and we sent the other half of the surgeons an email message inviting them to complete the survey on our Web site. All participants were alternately allocated to receive either a standard cover letter (n = 111) or email (n = 111), or a test cover letter (n = 110) or email (n = 110) (Fig. 1 and Fig. 2). Here we present the primary response rates for these 4 groups at 6 weeks, before we sent a second copy of the survey. Surgeons in the 4 groups who responded by 6 weeks were similar in their age, type of practice, geographical location and the proportion who had completed a fellowship in trauma (Table 1). During the study, 11 surveys were returned to sender (i.e., wrong address), 39 surgeons refused to participate and 16 email addresses were nonfunctional (Fig. 3).
Table 1
FIG. 3. Administration of the survey. We administered the survey to the 442 surgeon-members of the Orthopaedic Trauma Association (OTA). The participants were alternately allocated to receive either a “standard” or a novel “test” cover letter. Three follow-up contacts were initiated for all nonrespondents at 6 and 12 weeks and a final mailing between 19 and 22 weeks. At the final follow-up, 142 participants who had received the test cover letter responded, compared with 139 participants who had received the standard cover letter.
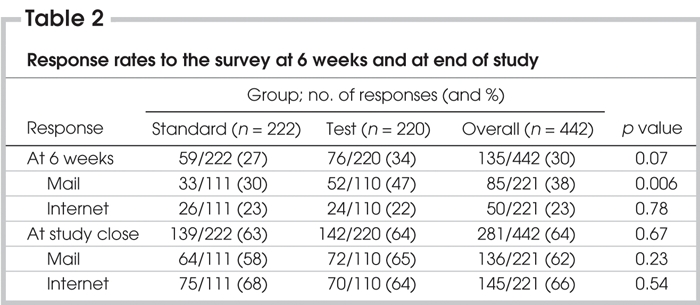
The overall primary response rate among surgeons at 6 weeks was 135 of 442 (30%). Overall, the primary response rate for the standard cover letter (59/222 [27%]) was similar to that for the test cover letter (76/220 [34%]) (p = 0.07).
Within the first 6 weeks, significantly more responses occurred with the test cover letter (52/110 [47%]) compared with the standard cover letter (33/111 [30%]) among those who received the survey by mail (p = 0.006).
There was no significant difference in primary response rates between those who received the standard email (26/111 [23%]) compared with those who received the test email (24/110 [22%]) among those who completed the Internet version of the survey (p = 0.78, 95% confidence interval [CI] –9% to 12%).
The final response rate for the survey was 64% (281/442). Final response rates between the standard cover letter (139/222 [63%]) and test cover letter (142/220 [64%]) groups did not differ (absolute difference 1%, 95% CI –10% to 7%) (Table 2).
Table 2

Discussion
We should aim to achieve a high response rate when conducting health care surveys in order to reduce nonresponse bias. We have found from reviews of the literature on response rates to physician surveys that monetary incentives, stamped return envelopes, telephone reminders, shorter length of survey and topics of great interest to physicians can increase response rates.1,2 To our knowledge, there is very little evidence regarding how different types of cover letters affect response rates to surveys.
We hypothesized that we would find a higher response rate among surgeons if we used a more personalized cover letter compared with a standard letter. We expected that surgeons might find the “test” cover letter more appealing and be more inclined to respond to the survey. Both cover letters included the essential information about the survey, were addressed to specific individuals and were personally signed. The difference between the 2 letters was in stressing the importance of the individual's response and acknowledging their expertise. The aggregate primary response rate was 34% (n = 76) for the group who received the test cover letter versus 27% (n = 59) for the standard cover letter.
It was interesting that the difference was only found between cover letters in the group who received the survey by mail (47% v. 30%). In the Internet group, the cover letter did not seem to make a difference (22% v. 23%). It remains plausible that surgeons were not the primary individuals checking their emails and, thus, the impact of our letter may have been lost. In addition, fewer surgeons responded to the Internet-based questionnaire as a whole, suggesting that the mode of delivery (Internet) played a stronger role in response rates than the cover letter itself.
Although much research has focused upon strategies to improve response rates in health care surveys,2 we found little research that evaluated alternative cover letter strategies beyond that proposed by Dillman.9 Mullner and colleagues15 investigated the relation between response rates of community hospitals to a survey conducted by the American Hospital Association and found that the format of the cover letter and a promise to share the results of the study with the respondents had no statistically significant effect.15 In contrast to the work by Mullner and colleagues, our cover letter focused on the individual's importance in the field and our desire to have this individual provide valuable insight into a controversial issue.
Our survey has a few limitations. First, it may not be generalizable beyond the surgeon-members of the Orthopaedic Trauma Association. Second, the incorrect email and postal addresses were over 3 times more common in the “test” group than in the “standard” cover letter group. This may have biased the results in favour of the “standard” cover letter group; however, the characteristics of the surgeons who responded in the first 6 weeks were similar in both groups (Table 1). Our comparison was “pseudo-randomized” because we did not use a random number generator, although our method likely produced a similar effect.
Our study demonstrates that surgeons who receive a personalized cover letter stressing their importance in the field are significantly more likely to respond to the initial mailing in mail surveys than those who receive standard cover letters. This effect does not appear to extend to Internet-based survey administration.
Acknowledgments
This study was funded, in part, by a grant from the Department of Surgery, McMaster University, Hamilton, Ont.
Competing interests: None declared.
Correspondence to: Dr. Mohit Bhandari, Division of Orthopaedic Surgery, McMaster University, Hamilton General Hospital, 237 Barton St. E, 7 North, Suite 727, Hamilton ON L8L 2X2; bhandam@mcmaster.ca
References
- 1.Kellerman SE, Herold J. Physician response to surveys: a review of the literature. Am J Prev Med 2001;20:61-7. [DOI] [PubMed]
- 2.Asch DA, Jedrziewski MK, Christakis NA. Response rates to mail surveys published in medical journals. J Clin Epidemiol 1997;50:1129-36. [DOI] [PubMed]
- 3.Matarasso A, Elkwood A, Rankin M, et al. National plastic surgery survey: face lift techniques and complications. Plast Reconstr Surg 2000;106:1185-95. [DOI] [PubMed]
- 4.Almeida OD Jr. Current state of office laparoscopic surgery. J Am Assoc Gynecol Laparosc 2000;7:545-6. [DOI] [PubMed]
- 5.Khalily C, Behnke S, Seligson D. Treatment of closed tibial shaft fractures: a survey from the 1997 Orthopaedic Trauma Association and Osteosynthesis International Gerhard Kuntscher Kreis Meeting. J Orthop Trauma 2000;14:577-81. [DOI] [PubMed]
- 6.Bhandari M, Guyatt GH, Swiontkowski MF, et al. Surgeons' preferences in the operative treatment of tibial shaft fractures: an international survey. J Bone Joint Surg Am 2001;83:1746-52. [DOI] [PubMed]
- 7.Cummings SM, Savitz LA, Konrad TR. Reported response rates to mailed physician questionnaires. Health Serv Res 2001; 35:1347-55. [PMC free article] [PubMed]
- 8.Sibbald B, Addington-Hall J, Brenneman D, et al. Telephone vs postal surveys of general practitioners: methodological considerations. Br J Gen Pract 1994;44:297-300. [PMC free article] [PubMed]
- 9.Dillman DA. Mail and Internet surveys: the tailored design method. New York: John Wiley and Sons; 1999.
- 10.Edwards P, Roberts I, Clarke M, et al. Increasing response rates to postal questionnaires: systematic review. BMJ 2002;324:1183-5. [DOI] [PMC free article] [PubMed]
- 11.Edwards P, Roberts I, Clarke M, et al. Methods to influence response to postal questionnaires [Cochrane Methodology Review]. In: The Cochrane Library; Issue 3, 2002. Oxford: Update Software.
- 12.Field TS, Cadoret CA, Brown ML, et al. Surveying physicians: Do components of the “total design approach” to optimizing survey response rates apply to physicians? Med Care 2002;40:596-606. [DOI] [PubMed]
- 13.Maheux B, Legault C, Lambert J. Increasing response rates in physicians' mail surveys: an experimental study. Am J Public Health 1989;79:638-9. [DOI] [PMC free article] [PubMed]
- 14.Feinstein AR. The theory and evaluation of sensibility. In: Feinstein AR, editor. Clinimetrics. New Haven (CT): Yale University Press; 1987. p. 23-30.
- 15.Mullner RM, Levy PS, Byre CS, et al. Effects of characteristics of the survey instrument on response rates to a mail survey of community hospitals. Public Health Rep 1982;97:465-9. [PMC free article] [PubMed]


