

Abstract
While an extensive body of knowledge has accumulated on the structures of transcription factors, DNA and their complexes from both NMR and crystallography, much less is known at a molecular level regarding the mechanisms whereby transcription factors locate their specific DNA target site within an overwhelming sea of non-specific DNA sites. Indirect kinetic data suggested that three processes are involved in the search procedure: jumping by dissociation of the protein from the DNA followed by re-association at another site, direct transfer from one DNA molecule or segment to another, and one-dimensional sliding. In this brief perspective we summary recent NMR developments from our laboratory that have permitted direct characterization of the species and molecular mechanisms involved in the target search process, including the detection of highly transient sparsely-populated states. The main tool in these studies involves the application of paramagnetic relaxation enhancement, supplemented by z-exchange spectroscopy, lineshape analysis and residual dipolar couplings. These studies led to the first direct demonstration of rotation-coupled sliding of a protein along the DNA and the direct transfer of a protein from one DNA molecule to another without dissociating into free solution.
Keywords: protein-DNA interactions, sliding, direct transfer, target search process, paramagnetic relaxation enhancement, z-exchange spectroscopy, lineshape analysis
The interaction of proteins with DNA plays a critical role in gene expression. Much has been learnt from static structures of protein-DNA complexes determined by crystallography and NMR. The first NMR structures of protein-DNA complexes were published in 1993 (Omichinski et al., 1993; Billeter et al., 1993; Chuprina et al., 1993), and since that time NMR has continued to make significant contributions to the study of protein-DNA complexes. This includes, among many others, structures of the minor groove binding architectural proteins SRY (Werner et al., 1995; Murphy et al., 2001), LEF-1 (Love et al., 1995; Love et al., 2004), HMG-I/Y (Huth et al., 1997) and NHP6A (Allain et al., 1999) complexed to DNA, structures of zinc finger-DNA complexes (Foster et al., 1997; Omichinski et al., 1997; Wuttke et al., 1997; Tsui et al., 2000; Tsui et al., 2000; Stoll et al., 2007), the structure of an Oct1/Sox2/DNA ternary complex (Williams et al., 2004), structures of specific and non-specific complexes of lac repressor with DNA (Boelens et al., 1987; Spronk et al., 1999; Kalodimos et al., 2002; Kalodimos et al., 2004), and the structures of complexes of Myb (Ogata et al., 2004) and the Trp repressor (Zhang et al., 1994) with DNA. Much less is known, however, of the mechanisms at an atomic level whereby transcription factors efficiently locate their specific DNA binding site. In this brief perspective, I will highlight some recent NMR developments that have taken place in our laboratory over the last 5 years that have sought to shed light on this problem. Some of the experiments, such as line shape analysis, are relatively simple, while others such as z-exchange spectroscopy and paramagnetic relaxation enhancement are more complex in their execution and interpretation.
A fundamental problem in specific DNA recognition is that transcription factors have to be able to rapidly locate their specific DNA target site(s) among a sea of non-specific sites. In the context of eukaryotic cells, the concentration of nuclear DNA is ~100 mg/ml which corresponds to a concentration of 150 mM on a base-pair basis. Thus, even if a transcription factor covers 10 base pairs, the concentration of potentially available non-specific sites would be 15 mM. This value represents an upper limit since ~90% of the DNA is covered by chromatin. Hence, the effective concentration of non-specific sites would be reduced to 1.5 mM, which is still many orders of magnitude larger than the concentration of specific sites, which could be as low as one site per nucleus. Three mechanisms (Fig. 1), based largely on indirect kinetic measurements and theoretical calculations, have been proposed to facilitate the target search process: jumping, direct transfer and sliding (Riggs et al., 1970; Berg et al., 1981; Winter et al., 1981; Berg and von Hippel, 1985; von Hippel and Berg, 1989; Halford and Marko, 2004; Levy et al., 2007; Toth-Petroczy et al., 2009; Vuzman et al., 2010; Vuzman and Levy, 2010). Jumping simply involves dissociation of the transcription factor from one DNA site into free solution followed by reassociation at another DNA site. Direct transfer of a transcription factor from one DNA site to another site located either distally on the same DNA molecule (>150 base pairs away) or on another DNA molecule can occur via the formation of a bridged complex without dissociation into free solution. Jumping and direct transfer involve intermolecular translocation events. Sliding, on the other hand, represents an intramolecular translocation event involving one-dimensional diffusion along the DNA. In this brief perspective I summary recent studies that directly demonstrate the existence of these search mechanisms and permit one to obtain direct kinetic data on the rates of these processes.
Figure 1.

Diagrammatic representation of (A) sliding, (B) direct/intersegment transfer and (C) jumping. Molecules of DNA are shown in blue and green, and the protein in red. Sliding involves one-dimensional rotational-coupled diffusion on the DNA whereby the protein tracks the grooves of the DNA. In direct/intersegment transfer, a protein bound to one segment of DNA is directly transferred to another segment or molecule of DNA via a bridged intermediate without ever dissociating into free solution. Finally, in jumping, the protein dissociations from ne molecule of DNA, diffuses in three-dimensions in solution and reassociates with another molecule or segment of DNA.
Direct measurement of the kinetics of intermolecular translocation
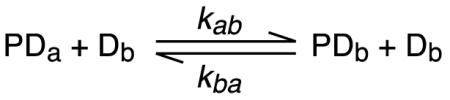
The general strategy for studying the kinetics of intermolecular translocation relies on carrying out measurements on a sample comprising protein plus a roughly equal mixture of two DNA duplexes differing slightly in their DNA sequence (Iwahara and Clore, 2006a; Iwahara et al., 2006b; Doucleff and Clore, 2008; Takayama et al., 2010). This will result in distinct chemical shifts for the two complexes while leaving the affinity for the protein essentially unaltered. For a specific complex, only one base pair change at the edge of the site is required (Iwahara and Clore, 2006a; Doucleff and Clore, 2008; Takayama et al., 2010). For non-specific complexes, more base pair changes may be needed (Iwahara et al., 2006a). In such samples, intermolecular exchange reactions will take place by direct transfer
 |
(1) |
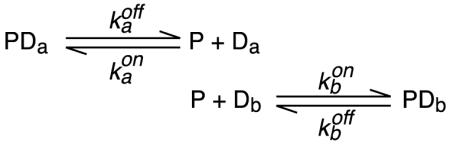
and jumping
 |
(2) |
where PDa is the complex with one DNA duplex (Da), and PDb, the complex with the second duplex (Db).
In the case of direct transfer (Equ. 1), the apparent rate constants and for the transfer of the protein from Da to Db and from Db to Da, respectively, will be directly proportional to the concentration of free DNA; i.e. and . Under conditions where the total DNA concentration ([Da] + [Db] is in excess over protein and the dissociation rate constant koff << kon[DNAfree], where kon is the second order association rate constant), the rate limiting step for jumping (Equ. 2) will be governed by the dissociation rate constants and . The apparent first order translocation rate constants and will be independent of the concentration of free DNA and approximately equal to / 2 and / 2 (where the statistical factor of 2 arises from transitions between the same species). Thus, the second order rate constant for direct transfer and the first order dissociation rate constant for jumping can be obtained from the slope and intercept, respectively, of a plot of apparent translocation rate constant versus free DNA concentration (Iwahara and Clore, 2006a; Doucleff and Clore, 2008). The specific technique used to measure the apparent translocation rate constants will be dependent on the exchange regime.
If intermolecular translocation is very slow (on the minutes to hours time scale), real-time NMR-based kinetic measurements can be made using for example, 1H-15N correlation spectroscopy (Takayama et al., 2010). A particularly useful variant, in this regard, is the use of a sensitivity-enhanced HSQC sequence known as COST-HSQC, based on a selective E-BURP pulse on 1HN, to cool overall spin temperature, thereby permitting shorter recovery delays to be employed (Deschamps and Campbell, 2006). This approach was used to study the very slow direct transfer of the three zinc-finger protein Zif268 from one specific DNA binding site to another where kDT, the rate constant for direct transfer (equivalent to and in Eq. 1), has a value of ~1 M−1s−1, and koff (equivalent to and in Eq. 2) value of 10−4 s−1 (Takayama et al., 2010).
When exchange is slow on the chemical shift time scale, but equal to or faster than the longitudinal relaxation rate, the kinetics of intermolecular translocation can be studied by z-exchange spectroscopy based on 2D heteronuclear correlation experiments (Montelione and Wagner, 1989; Farrow et al., 1994). Rate constants are readily obtained by simultaneously fitting the dependence of the auto- and exchange cross-peak intensities as a function of the z mixing time, and in general rates up to ~50 s−1 are accessible using this approach (Iwahara and Clore, 2006a). In most instances, it is advantageous to use a TROSY version of the experiment taking care to include an S scheme during the z-mixing period to eliminate the buildup of spurious semi-TROSY peaks (Sahu et al., 2007). This approach has been used to study intermolecular translocation of the homeodomain Hox D9 (Iwahara and Clore, 2006a) and the multidomain transcription factor Oct1 (Doucleff and Clore, 2008).
Two DNA binding proteins that we have studied extensively are HoxD9 and Oct1. HoxD9 is a homeodomain protein comprising a helix-turn-helix DNA binding domain that binds in the major groove and an N-terminal tail that contacts the minor groove. Oct1 is a bi-domain DNA binding protein comprising a POU specific domain (POUS) and a homeodomain (POUHD); both domains are of the helix-turn-helix variety and bind in the major groove of the DNA. HoxD9 and Oct1 bind sequence specifically to DNA with an equilibrium dissociation constant in the sub-nanomolar to nanomolar range. In the case of HoxD9, intermolecular tranlsocation proceeds almost entirely via direct transfer, with the N-terminal tail acting as a fly-cast to latch on to a second DNA molecule (Iwahara and Clore, 2006a). At 20 mM NaCl the rate constant for direct transfer of HoxD9 has a value of ~5-6×10⁴ M−1 s−1. Oct1 has two DNA binding domains, POUS and POUHD, connected by a relatively short flexible linker. The two domains exchange between specific sites at significantly different rates, with translocation rates for the POUS domain being a factor of ~1.5 higher than those for the POUHD domain (Doucleff and Clore, 2008). In contrast to HoxD9, a plot of the apparent translocation rates as a function of free DNA concentration yields a measurable intercept when extrapolated to zero free DNA. This intercept is equal to half the dissociation rate constant, koff, of the domains from DNA into solution, and reflects the jumping process. At 150 mM NaCl and 30°C, the global association and dissociation rate constants have values of ~2×10⁸ M−1s−1 and 4-5 s−1, respectively; the direct transfer rate constants have values of 2-4×10⁴ M−1s−1 (Doucleff and Clore, 2008). On the HoxB1 promoter Oct1 forms a ternary complex with another transcription factor Sox2, an architectural protein that binds to the minor groove and bends the DNA (Williams et al., 2004). Addition of Sox 2 reduces the intermolecular translocation rates for Oct1 by ≥5 fold, primarily by slowing the exchange rate for the POUS domain which directly contacts Sox2 in the complex (Doucleff and Clore, 2008).
When exchange is fast on the chemical shift time scale, the overall translocation rate constant can be readily extracted from linewidth analysis as the populations and chemical shift differences can be obtained directly from correlation spectra of the 1:1 mixture of the two complexes and the individual complexes (Iwahara et al., 2006). The apparent first-order forward and backward translocation rate constants can then be derived from the overall translocation rate constant and the known populations of the two complexes. This approach has been used to study intermolecular translocation of HoxD9 between different non-specific 24 bp DNA duplexes and allows for apparent first order rate constants up to ~1500 s−1 to be reliably determined (Iwahara et al., 2006). For HoxD9 the overall apparent first-order translocation rate constant is linearly proportional to the concentration of free DNA. From these data the direct transfer rate constant is calculated to be ~1.5×10⁶ M−1s−1, which is about 25 times faster than the transfer between specific sequences under similar conditions (20 mM NaCl). The exchange contributions arising from intramolecular translocation (i.e. one-dimensional diffusion) are included in the R2 rates for the individual non-specific complexes. Since the latter are independent of DNA concentration, whereas the R2 rate for the mixture decreases with DNA concentration (corresponding to an increase in ), and the chemical shift differences for HoxD9 bound to each potential nonspecific site are expected to be just as large as the difference in observed chemical shifts between the two non-specific complexes, one can deduce that the first order rate constant for intramolecular translocation, , is much larger than the apparent first order rate constant, , for intermolecular translocation. An upper limit for the value of can be obtained by extrapolating the concentration of free DNA at which the R2 rates for the mixture are the same as those for the individual complexes. This procedure yields a lower limit of ~1500 s−1.
The one-dimensional diffusion coefficients for proteins undergoing rotation-coupled sliding along DNA measured from single molecule experiments range from 1 × 10⁻⁴ to 2 × 10⁻⁴ μm2.s−1 (Blainey et al., 2009; Gorman et al., 2010). How does a value of 1500 s−1 measured on a 24 bp DNA duplex translate to a one-dimensional diffusion coefficient? An estimate can be obtained as follows. Since only one set of protein chemical shifts is observed for the ensemble of non-specific complexes formed with each 24 bp DNA duplex, complexes with HoxD9 located at the extreme ends of the DNA must be in fast exchange with one another. The binding size for HoxD9 is 6 bp, so the center-to center distance separating HoxD9 at the two extreme ends of a 24 bp DNA duplex is 18 bp, corresponding to a distance L of ~60 Å or 60 × 10−4 μm. The protein can be bound to the DNA in two orientations related by a 180° rotation with respect to the long axis of the DNA; hence there are 4 possible combinations of complexes located at the ends of the DNA that must be in fast exchange with one another. Exchange between proteins bound in the same orientation can occur solely by sliding, whereas proteins bound in opposite orientations can only exchange by a combination of sliding and a direct intermolecular transfer event. Bearing this in mind, the one-dimensional diffusion coefficient is given approximately by 2Lkex ~ 1 ×10⁻⁴ μm2.s−1 which is fully consistent with the results obtained from single molecule experiments.
Characterizing intra- and intermolecular translocation by paramagnetic relaxation enhancement measurements
The PRE arises from magnetic dipolar interactions between the unpaired electrons of a paramagnetic center and a nucleus such as a proton (Solomon, 1955; Bloembergen and Morgan, 1961). The PRE results in an increase in the nuclear magnetization relaxation rate that is proportional to the <r−6> average distance between the electron and the nucleus of interest. Because the magnetic moment of the electron is very large, the PRE effect is also very large and can extend to distances up to ~35 Å. In the absence of an intrinsic paramagnetic center, a paramagnetic label must be introduced into the system, and the most suitable are those that have an unpaired electron with an isotropic g-tensor (Clore and Iwahara, 2009). Examples of common paramagnetic labels include nitroxide spin labels and metal ions such as Mn2+ and Gd3+ chelated, for example, to EDTA with functional groups that permit their site-specific conjugation to DNA or protein. For DNA, EDTA-derivatized deoxythymidine is ideally suited for PRE studies, and synthetic oligonucleotides containing dT-EDTA can be readily purchased (Iwahara et al., 2003).
Since the paramagnetic center is generally conjugated to the protein or DNA via several rotatable bonds, quantitative analysis of the PRE necessitates taking the flexibility of the paramagnetic center into account in order to accurately back-calculate PRE rates from structure coordinates (Iwahara et al., 2004). This involves representing the paramagnetic center by an ensemble of states and taking care to calculate PRE order parameters from the coordinates during the course of structure refinement. Quantitative assessment of the agreement between observed and experimental PRE rates is given by a Q-factor that is broadly analogous to a crystallographic R-factor (Iwahara et al., 2004). It should also be noted that quantitative analysis requires that actual PRE relaxation rates be measured, rather than simply taking the ratio of cross-peak intensities in the spectra of the paramagnetic state and the diamagnetic control (Iwahara et al., 2007). The PRE rates are simply given by the difference in relaxation rates between the paramagnetic sample and the diamagnetic control. In most instances a two-time point measurement is sufficient to obtain accurate relaxation rates (Iwahara et al., 2007). PREs can be measured on both longitudinal (Γ1) and transverse (Γ2) relaxation rates. In general, transverse PRE rates are preferred since the 1H-Γ2 rate is much larger than the 1H-Γ1 rate, making the former a more sensitive probe. In addition, the 1H-Γ2 rate is much less susceptible to internal motions and cross-relaxation effects than the 1H-Γ1 rate (Iwahara et al., 2004; Clore and Iwahara, 2009; Iwahara and Clore, 2010).
The key to using the PRE to detect rare events such as sliding and direct transfer that involve species populated at very low levels, relies on the existence of rapid exchange between an NMR observable species and the sparsely-populated states (Iwahara and Clore, 2006b; Clore, 2008; Clore and Iwahara, 2009). If exchange between major (NMR visible) and minor (NMR invisible) species is fast on the PRE time scale (i.e. kex is much larger than the difference in PRE rates for the two species), the observed PRE, measured on the cross-peaks on the major species, will be a population weighted average of the PRE rates of the major and minor species. Under these conditions, the footprint of the minor species will be manifested in the PRE profiles observed for the major species providing the distances between the paramagnetic center and the protons of interest are significantly shorter in the minor species than the major one. As a simple example, consider a system comprising two species, A and B, populated at 99 and 1%, respectively, with paramagnetic center-1H distances of 30 and 8 Å, respectively (Fig. 2). For a 30 kDa system, the corresponding PRE rates will have values of ~2 and 5600 s−1, respectively. In the fast exchange regime, the PRE rate measured on the resonance of the major species will have a value of ~50 s−1, much larger than that expected for species A alone (Iwahara and Clore, 2006b).
Figure 2.

Detecting transient sparsely-populated states by PRE. (A) Schematic diagram of a two-site exchange system in which the distance between the paramagnetic probe (green circle) and the proton of interest (red circle) is 30 Å in the major species populated at 99%, and 8 Å in the minor species populated at 1%. (B) Effect of exchange of the lineshape of the resonance of the major species A in the presence (red) and absence (black) of the PRE. The resonances of the major and minor species are located at −50 and =50 Hz, respectively of the carrier frequency. Reproduced from Iwahara et al. (2006b) published in Nature (MacMillan Press) while the authors were US Government employees at the National Institutes of Health.
The general experimental strategy used to probe sliding and direct transfer by PRE involves measuring PRE profiles at different salt concentrations for the transcription factor bound specifically to DNA, with the paramagnetic label placed at either end of the DNA. PREs will be observed from the specific complex as well as from any minor species that exchange rapidly with the specific complex and come into close proximity with the paramagnetic label (Iwahara and Clore, 2006b). To distinguish contributions from sliding and direct transfer, experiments are conducted on 1:1:1 mixtures of transcription factor, specific DNA duplex and non-specific DNA duplex (Iwahara and Clore, 2006b; Takayama and Clore, 2011). When the paramagnetic label is located on the non-specific DNA duplex (sample 1), any observed PREs can only arise from direct transfer from the specific duplex to the non-specific duplex and back to the specific duplex (Fig. 3 left). When the paramagnetic label is located on the specific duplex (sample 2), however, contributions from both intra and intermolecular translocation will be present as the protein can directly hop between DNA molecules bearing the specific site (Fig. 3 right). Thus, if the ratio of a given PRE for sample 2 to sample 1 has a value greater than 1 outside any regions where the PREs can be directly attributable to the specific complex, that PRE must arise from both intra and intermolecular translocation.
Figure 3.

Strategy for dissecting sliding and direct transfer. Two samples are employed comprising an equal mixture of specific and non-specific DNA. In sample 1, the non-specific DNA bears the paramagnetic label (red circle) so that any observed PRE effects can only arise from direct transfer. In sample 2, the specific DNA contains the paramagnetic label so that both sliding and direct transfer contribute to the PRE. The protein (shown in orange) occupies the specific site (blue) the vast majority of the time. Adapted from Iwahara et al. (2006b) published in Nature (MacMillan Press) while the authors were US Government employees at the National Institutes of Health.
Non-specific protein-DNA interactions probed by PRE and RDCs
To date there are three examples of the use of the PRE to study non-specific DNA binding, the first involves the minor groove binding architectural factor HMGB-1A (Iwahara et al., 2004), the second the major groove binding homeodomain HoxD9 (Iwahara et al., 2006), and the third the bi-domain transcription factor Oct1 (Takayama and Clore, 2011). In non-specific complexes, the protein can bind to multiple sites on the DNA. For a given DNA binding domain, the number of binding sites is equal to (N − X + 1) × 2, where N is the number of basepairs, X the size of the binding site in units of base pairs, and the factor of 2 is due to the fact that non-specific binding involves two equivalent orientations of the protein on the DNA related by a 180° rotation. There may even be more non-specific sites, albeit with progressively weaker affinity, if the protein can still bind to sites of reduced length. Since exchange between the different binding sites is fast, the observed PRE profiles will be a weighted average of all binding configurations. In each example studied, very large PREs are observed in structural elements that can come into close proximity with the paramagnetic label; and equally importantly, the PREs observed with the paramagnetic label placed at either end of the DNA are generally very similar.
A comparison of PRE profiles for specific and non-specific HoxD9-DNA complexes at 20 mM NaCl is shown in Fig. 4 (Iwahara et al., 2006). With the paramagnetic labels placed at either end of a 24 bp DNA duplex, very small PRE effects are observed for the specific complex with maximum values <20 s−1 (Fig. 4A), consistent with the Mn2+-1HN distances in the structure of the specific complex. For the non-specific complex, however, large PREs are observed with the cross-peaks for residues located in the N-terminal tail and the N-terminal ends of helices 1 and 2 broadened beyond detection, and as expected the PRE profiles obtained with the paramagnetic label placed at either end of the DNA are very similar (Fig. 4B).
Figure 4.

PREs observed for (A) specific and (B) non-specific complexes of HoxD9 with a 24 bp DNA duplex. In each instance, the paramagnetic label was placed at each end (individually) of the DNA duplex (24 bp in length) (denoted by sites I and II in the figure). In the specific complex, the paramagnetic labels are too far away from HoxD9 bound to the central 6 bp of the DNA duplex. In contrast, large PREs are observed for the non-specific complex, since a large number of non-specific complexes in rapid exchange with one another are sampled, some of which come into very close proximity to the paramagnetic labels. The observation that the non-specific PRE profiles are very similar when the paramagnetic label is placed at either end of the DNA indicates that the protein samples two orientations related by a 180° rotation with respect to the long axis of the DNA. Adapted from Iwahara et al. (2006) published in the Proceeding of the National Academy of Sciences while the authors were US Government employees at the National Institutes of Health.
Residual dipolar couplings (RDCs) provide complementary information to the PREs and yield additional structural insights on dynamic ensembles of non-specific protein-DNA complexes. In the case of proteins that do not significantly bend the DNA, phage pf1 induced alignment is dominated by the electrostatic properties and shape of the DNA such that the principal axis of the alignment tensor closely coincides with the long axis of the DNA. The net result is that RDCs measured on a dynamic ensemble of non-specific protein-DNA complexes are highly correlated with those measured for the corresponding complex, indicating that the orientation of the protein with respect to the long axis of the DNA is basically the same in specific and non-specific complexes (Iwahara et al., 2006; Takayama and Clore, 2011). Thus, one-dimensional diffusion of a protein along the DNA occurs by rotation-coupled sliding in which the protein tracks the grooves of the DNA. This was subsequently confirmed by single molecule fluorescence experiments (Blainey et al., 2009; Finkelstein et al., 2010; Gorman et al., 2010).
In the case of Oct1, the RDCs provide yet further information (Takayama and Clore, 2011). At low salt, the RDCs for both the POUS and POUHD domains measured for the non-specific complex are highly correlated with those measured for the specific complex, indicating that the orientations of the POUS and POUHD domains relative to the long axis of the DNA are the same for specific and non-specific complexes. At higher salt, however, the correlation for the POUHD domain is preserved while that for the POUS domain is not. 1HN/15N chemical shift perturbations as a function of salt and non-specific DNA display a co-linear dependence indicating that that at high salt the POUS domain is partially dissociated from the DNA and exists in dynamic equilibrium between direct contact and tethered states. Thus, in the tethered state the POUS domain is not itself directly bound to the DNA but its distance from the DNA is limited by the length of the linker connecting the POUS and POUHD domains, as the POUHD domain remains directly bound to the DNA.
Transient exchange between specific and non-specific binding revealed by PRE
The PRE has been used to study rapid transient excursions between a specific complex and non-specific binding modes arising from sliding and direct transfer in two cases, the homeodomain HoxD9 (Iwahara and Clore, 2006b) and Oct1 (Takayama and Clore, 2011). In both instances the ratio of the non-specific to specific equilibrium dissociation constants is ≥100. Thus, in the context of a DNA duplex containing the specific site the population of transient non-specifically bound complexes arising from sliding and direct transfer is less than 1% of the population of specific complex, and therefore only the spectrum of the specific complex is directly observed.
At low salt (20 mM NaCl), the PRE profiles observed for HoxD9 arising from paramagnetic labels placed at 4 different sites on a 24mer DNA duplex (Fig. 5A) are fully consistent with the crystal structure of the complex, with a PRE Q-factor of only 0.26 (Figs. 5C,E). However, at 100 and 150 mM NaCl, despite the fact that the 1H-15N correlation spectrum of HoxD9 is essentially unperturbed, very large PREs are observed (Fig. 5F) and agreement between observed and calculated PREs is very poor (Q factor = 0.66, Fig. 5D). Moreover, the PREs observed for symmetrically placed labels at opposite ends of the DNA duplex (sites 1 and 4, and sites 2 and 3) are virtually identical to one another (Fig. 5F). These large PREs are due to transient sparsely-populated, NMR “invisible”states, arising from a combination of sliding (Figs. 1 and 5B) and direct transfer (Fig. 1B).
Figure 5.

Intermolecular PREs observed for the specific HoxD9/DNA complex at low (20 mM) and high (100 and 150 mM) NaCl corresponding to the slow and fast PRE exchange regimes. (A) DNA sequence employed with the specific site boxed and the four paramagnetic labeling sites indicated. (Note the sites are labeled one at a time). (B) Diagrammatic representation of the ground state representing the specific complex and the transiently sampled states, generated by sliding, involved in the target search process. Agreement between observed and calculated PREs (based on the crystal structure of the Antennapedia homeodomain/DNA complex) at (C) low and (D) high salt. PRE profiles observed for the four paramagnetic sites at low (E) and high (F) salt. PREs at low and high salt mapped onto the structure of the specific complex are shown as insets in (E) and on the right of the PRE profiles in (F), respectively. Adapted from Iwahara et al. (2006b) published in Nature (MacMillan Press) while the authors were US Government employees at the National Institutes of Health.
When experiments with HoxD9 are conducted with samples containing an equal mixture of specific and non-specific DNA duplexes, with the paramagnetic label located either on the non-specific duplex (sample 1) or on the specific duplex at site 4 (sample 2), very similar PRE profiles are observed (Iwahara and Clore, 2006b) (Fig. 6). The ratios of the sample 2 to sample 1 PREs for the N-terminal tail have values of ~1 (Fig. 6A, bottom panel), indicating that the N-terminal tail is predominantly involved in direct transfer. In contrast, the ratio of the sample 2 to sample 1 PREs for residues in helices 2 and 3 have values ranging from 1.5 to 2 (Fig. 6A, bottom panel), providing direct evidence for the existence of sliding in addition to direct transfer. The reason that the PREs for helices 2 and 3 but not the N-terminal tail are larger in sample 2 than sample 1 is due to the fact that sliding starting from the specific complex allows helices 2 and 3 to come into close proximity to the paramagnetic label at site 4 (cf. Fig. 5A), whereas the N-terminal tail is always distant from the label in this orientation. The only way that the N-terminal tail can come into close proximity to the paramagnetic label is following an intermolecular translocation event accompanied by a 180° change in binding orientation on the DNA containing the specific site.
Figure 6.

Discriminating sliding and direct transfer for the HoxD9/DNA complex by PRE. (A) PRE profiles and PRE ratios obtained for two samples comprising an equal mixture of specific and non-specific DNA in which the paramagnetic label was placed either on the specific DNA (sample 2) or on the non-specific DNA (sample 1). The paramagnetic label is positioned at one end of the DNA, which, in the case of the specific duplex, corresponds to site 4 in Fig. 5A. PREs in sample 1 can only arise from direct transfer from the specific DNA duplex to the non-specific DNA duplex and back again (see Fig. 2). In sample 2, both sliding and direct transfer contribute to the PREs (see Fig. 2). The ratio of the PREs for sample 2 to sample 1 enable one to assess the contribution of sliding on top of direct transfer to the observed PREs. (B) Sample 2 to sample 1 PRE ratios color codes on the structure of HoxD9 diffusing along the DNA by rotation-coupled sliding with HoxD9 in the specific site shown as a solid ribbon, and in two non-specific sites as transparent ribbons. The larger ratios observed for helices 2 and 3 are due to a memory effect: sliding starting from the specific complex allows helices 2 and 3 to come into close proximity to the paramagnetic label located at site 4 (cf. Fig. 5A), whereas the N-terminal tail can only come into close proximity to the paramagnetic label following an intermolecular translocation event accompanied by a 180° change in binding orientation on the DNA containing the specific site. Adapted from Iwahara et al. (2006b) published in Nature (MacMillan Press) while the authors were US Government employees at the National Institutes of Health.
Unlike HoxD9 which is a single domain DNA binding protein with an N-terminal tail, Oct 1 has two globular domains, POUS and POUHD connected by a relatively short linker. PRE measurements reveal that the two domains of Oct1 play distinct and complementary roles in intra- and intermolecular translocation processes (Takayama and Clore, 2011). In contrast to HoxD9 where no evidence for transient species arising from sliding or direct transfer could be detected at low salt, both sliding and direct transfer of Oct1 can be observed by PRE at low salt. As the salt concentration increases, the magnitude of the PREs is progressively increased while leaving the PRE profiles essentially unaltered. This is due to electrostatic screening resulting in enhanced sliding and direct transfer. (i.e. salt either increases the exchange rate between Oct1 located at specific and nonspecific DNA sites and/or increases the population of sparsely-populated nonspecific sites). PRE experiments with samples comprising equal mixtures of specific and non-specific DNA, with the label placed either on the non-specific duplex or at the two ends (separately) of the specific duplex, reveal distinct roles for the two domains in the target search process (Fig. 7). The POUHD domain largely searches the DNA by sliding. The POUS domain, on the other hand, serves as an antenna to promote direct transfer. Transfer from one DNA molecule to another occurs via a bridged intermediate formed when the POUS domain latches onto to a second DNA molecule. Once this intermediate is formed, the probability of completing the direct transfer of Oct1 by dissociation of the POUHD domain from the first DNA molecule followed by reassociation with the second is significantly enhanced as this involves a first order process. Thus cross-talk between the POUS and POUHD domains,, each fulfilling distinct but complementary components of the search process, promotes efficient exploration of the DNA landscape to enhance the rate at which the specific site is located (Takayama and Clore, 2011). These experimental results are in complete agreement with theoretical calculations based on coarse-grained simulations (Vuzman et al., 2010).
Figure 7.

Model for the predominant translocation processes involving the POUS and POUHD domains of Oct1 derived from PRE measurements. In the target search process for the specific DNA binding site, POUS is predominantly involved in direct transfer, while POUHD slides along the DNA. Reproduced from Takayama and Clore (2011) published in the Proceeding of the National Academy of Sciences while the authors were US Government employees at the National Institutes of Health.
Concluding remarks
Recent developments in NMR, including paramagnetic relaxation enhancement, residual dipolar couplings and z-exchange spectroscopy, have shed significant light on the mechanisms whereby transcription factors are able to locate their specific target site within an overwhelming sea of non-specific sites. PRE measurements combined with RDCs provided the first direct demonstration of rotation-coupled sliding whereby a protein can diffuse in one-dimension by tracking the grooves of the DNA, confirming a large body of indirect evidence afforded by traditional kinetic data. Further, PRE measurements together with z-exchange spectroscopy provided the first direct demonstration of direct transfer of a protein from one DNA molecule to another without ever dissociating into free solution. Many questions still remain regarding how interactions between multiple transcription factors and the presence of other proteins on the DNA (such as chromatin) impact the target search process. The NMR techniques and experimental design briefly described in this perspective promise to shed significant light and insights on these questions.
References
- Allain FH, Yen YM, Masse JE, Schultze P, Dieckmann T, et al. Solution structure of the HMG protein NHP6A and its interaction with DNA reveals the structural determinants for non-sequence-specific binding. EMBO J. 1999;18:2563–2579. doi: 10.1093/emboj/18.9.2563. [DOI] [PMC free article] [PubMed] [Google Scholar]
- Berg OG, von Hippel PH. Diffusion-controlled macromolecular interactions. Annu Rev Biophys Biophys Chem. 1985;14:131–160. doi: 10.1146/annurev.bb.14.060185.001023. [DOI] [PubMed] [Google Scholar]
- Berg OG, Winter RB, von Hippel PH. Diffusion-driven mechanisms of protein translocation on nucleic acids. 1. Models and theory. Biochemistry. 1981;20:6929–6948. doi: 10.1021/bi00527a028. [DOI] [PubMed] [Google Scholar]
- Billeter M, Qian YQ, Otting G, Muller M, Gehring W, et al. Determination of the nuclear magnetic resonance solution structure of an Antennapedia homeodomain-DNA complex. J Mol Biol. 1993;234:1084–1093. doi: 10.1006/jmbi.1993.1661. [DOI] [PubMed] [Google Scholar]
- Blainey PC, Luo G, Kou SC, Mangel WF, Verdine GL, et al. Nonspecifically bound proteins spin while diffusing along DNA. Nat Struct Mol Biol. 2009;16:1224–1229. doi: 10.1038/nsmb.1716. [DOI] [PMC free article] [PubMed] [Google Scholar]
- Bloembergen N, Morgan LO. Proton relaxation times in paramagnetic solution. J Chem Phys. 1961;34:842–850. [Google Scholar]
- Boelens R, Scheek RM, van Boom JH, Kaptein R. Complex of lac repressor headpiece with a 14 base-pair lac operator fragment studied by two-dimensional nuclear amgnetic resonance. J Mol Biol. 1987;193:213–216. doi: 10.1016/0022-2836(87)90638-3. [DOI] [PubMed] [Google Scholar]
- Chuprina VP, Rullmann JA, Lamerichs RM, van Boom JH, Boelens R, Kaptein R. structure of the complex of lac repessor headpiece and a 11 base-pair half-opearyopr determined by nuclear magnetic resonance spectroscopy and restrained molecular dynamics. J Mol Biol. 1993;234:446–462. doi: 10.1006/jmbi.1993.1598. [DOI] [PubMed] [Google Scholar]
- Clore GM. Visualizing lowly-populated regions of the free energy landscape of macromolecular complexes by paramagnetic relaxation enhancement. Mol Biosyst. 2008;4:1058–1069. doi: 10.1039/b810232e. [DOI] [PMC free article] [PubMed] [Google Scholar]
- Clore GM, Iwahara J. Theory, practice, and applications of paramagnetic relaxation enhancement for the characterization of transient low-population states of biological macromolecules and their complexes. Chem Rev. 2009;109:4108–4139. doi: 10.1021/cr900033p. [DOI] [PMC free article] [PubMed] [Google Scholar]
- Deschamps M, Campbell ID. Cooling overall spin temperature: protein NMR experiments optimized for longitudinal relaxation effects. J Magn Reson. 2006;178:206–211. doi: 10.1016/j.jmr.2005.09.011. [DOI] [PubMed] [Google Scholar]
- Doucleff M, Clore GM. Global jumping and domain-specific intersegment transfer between DNA cognate sites of the multidomain transcription factor Oct-1. Proc Natl Acad Sci U S A. 2008;105:13871–13876. doi: 10.1073/pnas.0805050105. [DOI] [PMC free article] [PubMed] [Google Scholar]
- Farrow NA, Zhang O, Forman-Kay JD, Kay LE. A heteronuclear correlation experiment for simultaneous determination of 15N longitudinal decay and chemical exchange rates of systems in slow equilibrium. J Biomol NMR. 1994;4:727–734. doi: 10.1007/BF00404280. [DOI] [PubMed] [Google Scholar]
- Finkelstein IJ, Visnapuu ML, Greene EC. Single-molecule imaging reveals mechanisms of protein disruption by a DNA translocase. Nature. 2010;468:983–987. doi: 10.1038/nature09561. [DOI] [PMC free article] [PubMed] [Google Scholar]
- Foster MP, Wuttke DS, Radhakrishnan I, Case DA, Gottesfeld JM, et al. Domain packing and dynamics in the DNA complex of the N-terminal zinc fingers of TFIIIA. Nat Struct Biol. 1997;4:605–608. doi: 10.1038/nsb0897-605. [DOI] [PubMed] [Google Scholar]
- Gorman J, Plys AJ, Visnapuu ML, Alani E, Greene EC. Visualizing one-dimensional diffusion of eukaryotic DNA repair factors along a chromatin lattice. Nat Struct Mol Biol. 2010;17:932–938. doi: 10.1038/nsmb.1858. [DOI] [PMC free article] [PubMed] [Google Scholar]
- Halford SE, Marko JF. How do site-specific DNA-binding proteins find their targets? Nucleic Acids Res. 2004;32:3040–3052. doi: 10.1093/nar/gkh624. [DOI] [PMC free article] [PubMed] [Google Scholar]
- Huth JR, Bewley CA, Nissen MS, Evans JN, Reeves R, et al. The solution structure of an HMG-I(Y)-DNA complex defines a new architectural minor groove binding motif. Nature Struct Biol. 1997;4:657–665. doi: 10.1038/nsb0897-657. [DOI] [PubMed] [Google Scholar]
- Iwahara J, Anderson DE, Murphy EC, Clore GM. EDTA-derivatized deoxythymidine as a tool for rapid determination of protein binding polarity to DNA by intermolecular paramagnetic relaxation enhancement. J Am Chem Soc. 2003;125:6634–6635. doi: 10.1021/ja034488q. [DOI] [PubMed] [Google Scholar]
- Iwahara J, Clore GM. Direct observation of enhanced translocation of a homeodomain between DNA cognate sites by NMR exchange spectroscopy. J Am Chem Soc. 2006a;128:404–405. doi: 10.1021/ja056786o. [DOI] [PubMed] [Google Scholar]
- Iwahara J, Clore GM. Detecting transient intermediates in macromolecular binding by paramagnetic NMR. Nature. 2006b;440:1227–1230. doi: 10.1038/nature04673. [DOI] [PubMed] [Google Scholar]
- Iwahara J, Clore GM. Structure-independent analysis of the breadth of the positional distribution of disordered groups in macromolecules from order parameters for long, variable-length vectors using NMR paramagnetic relaxation enhancement. J Am Chem Soc. 2010;132:13346–13356. doi: 10.1021/ja1048187. [DOI] [PMC free article] [PubMed] [Google Scholar]
- Iwahara J, Schwieters CD, Clore GM. Characterization of nonspecific protein-DNA interactions by 1H paramagnetic relaxation enhancement. J Am Chem Soc. 2004;126:12800–12808. doi: 10.1021/ja046246b. [DOI] [PubMed] [Google Scholar]
- Iwahara J, Schwieters CD, Clore GM. Ensemble approach for NMR structure refinement against (1)H paramagnetic relaxation enhancement data arising from a flexible paramagnetic group attached to a macromolecule. J Am Chem Soc. 2004;126:5879–5896. doi: 10.1021/ja031580d. [DOI] [PubMed] [Google Scholar]
- Iwahara J, Tang C, Clore GM. Practical aspects of 1H transverse paramagnetic relaxation enhancement measurements on macromolecules. J Magn Reson. 2007;184:185–195. doi: 10.1016/j.jmr.2006.10.003. [DOI] [PMC free article] [PubMed] [Google Scholar]
- Iwahara J, Zweckstetter M, Clore GM. NMR structural and kinetic characterization of a homeodomain diffusing and hopping on nonspecific DNA. Proc Natl Acad Sci U S A. 2006;103:15062–15067. doi: 10.1073/pnas.0605868103. [DOI] [PMC free article] [PubMed] [Google Scholar]
- Kalodimos CG, Biris N, Bonvin AM, Levandoski MM, Guennuegues M, et al. Structure and flexibility adaptation in nonspecific and specific protein-DNA complexes. Science. 2004;305:386–389. doi: 10.1126/science.1097064. [DOI] [PubMed] [Google Scholar]
- Kalodimos CG, Bonvin AM, Salinas RK, Wechselberger R, Boelens R, et al. Plasticity in protein-DNA recognition: lac repressor interacts with its natural operator 01 through alternative conformations of its DNA-binding domain. EMBO J. 2002;21:2866–2876. doi: 10.1093/emboj/cdf318. [DOI] [PMC free article] [PubMed] [Google Scholar]
- Levy Y, Onuchic JN, Wolynes PG. Fly-casting in protein-DNA binding: frustration between protein folding and electrostatics facilitates target recognition. J Am Chem Soc. 2007;129:738–739. doi: 10.1021/ja065531n. [DOI] [PubMed] [Google Scholar]
- Love JJ, Li X, Case DA, Giese K, Grosschedl R, et al. Structural basis for DNA bending by the architectural transcription factor LEF-1. Nature. 1995;376:791–795. doi: 10.1038/376791a0. [DOI] [PubMed] [Google Scholar]
- Love JJ, Li X, Chung J, Dyson HJ, Wright PE. The LEF-1 high-mobility group domain undergoes a disorder-to-order transition upon formation of a complex with cognate DNA. Biochemistry. 2004;43:8725–8734. doi: 10.1021/bi049591m. [DOI] [PubMed] [Google Scholar]
- Montelione GT, Wagner G. 2D Chemical-Exchange NMR Spectroscopy by Proton-Detected Heteronuclear Correlation. J Am Chem Soc. 1989;111:3096–3098. [Google Scholar]
- Murphy EC, Zhurkin VB, Louis JM, Cornilescu G, Clore GM. Structural basis for SRY-dependent 46-X,Y sex reversal: modulation of DNA bending by a naturally occurring point mutation. J Mol Biol. 2001;312:481–499. doi: 10.1006/jmbi.2001.4977. [DOI] [PubMed] [Google Scholar]
- Ogata K, Morikawa S, Nakamura H, Sekikawa A, Inoue T, Kanai H, Sarai A, Ishii S, Nishimura Y. Solution structure of a specific DNA complex of the Myb DNA binding domain with cooperative recognition helices. Cell. 1994;79:639–648. doi: 10.1016/0092-8674(94)90549-5. [DOI] [PubMed] [Google Scholar]
- Omichinski JG, Clore GM, Schaad O, Felsenfeld G, Trainor C, et al. NMR structure of a specific DNA complex of a Zn-containing DNA binding domain of GATA-1. Science. 1993;261:438–446. doi: 10.1126/science.8332909. [DOI] [PubMed] [Google Scholar]
- Omichinski JG, Pedone PV, Felsenfeld G, Gronenborn AM, Clore GM. The solution structure of a specific GAGA factor-DNA complex reveals a modular binding mode. Nat Struct Biol. 1997;4:122–132. doi: 10.1038/nsb0297-122. [DOI] [PubMed] [Google Scholar]
- Riggs AD, Bourgeois S, Cohn M. The lac repressor-operator interaction. 3. kinetic studies. J Mol Biol. 1970;53:401–417. doi: 10.1016/0022-2836(70)90074-4. [DOI] [PubMed] [Google Scholar]
- Sahu D, Clore GM, Iwahara J. TROSY-based z-exchange spectroscopy: application to the determination of the activation energy for intermolecular protein translocation between specific sites on different DNA molecules. J Am Chem Soc. 2007;129:13232–13237. doi: 10.1021/ja074604f. [DOI] [PubMed] [Google Scholar]
- Solomon I. Relaxation processes in a system of two spins. Phys Rev. 1955;99:559–565. [Google Scholar]
- Spronk CA, Bonvin AM, Radha PK, Melacini G, Boelens R, et al. The solution structure of Lac repressor headpiece 62 complexed to a symmetrical lac operator. Structure. 1999;7:1483–1492. doi: 10.1016/s0969-2126(00)88339-2. [DOI] [PubMed] [Google Scholar]
- Stoll R, Lee BM, Debler EW, Laity JH, Wilson IA, et al. Structure of the Wilms tumor suppressor protein zinc finger domain bound to DNA. J Mol Biol. 2007;372:1227–1245. doi: 10.1016/j.jmb.2007.07.017. [DOI] [PubMed] [Google Scholar]
- Takayama Y, Clore GM. PNAS Plus: Intra- and intermolecular translocation of the bi-domain transcription factor Oct1 characterized by liquid crystal and paramagnetic NMR. Proc Natl Acad Sci U S A. 2011 doi: 10.1073/pnas.1100050108. [DOI] [PMC free article] [PubMed] [Google Scholar]
- Takayama Y, Sahu D, Iwahara J. NMR studies of translocation of the Zif268 protein between its target DNA Sites. Biochemistry. 2010;49:7998–8005. doi: 10.1021/bi100962h. [DOI] [PubMed] [Google Scholar]
- Toth-Petroczy A, Simon I, Fuxreiter M, Levy Y. Disordered tails of homeodomains facilitate DNA recognition by providing a trade-off between folding and specific binding. J Am Chem Soc. 2009;131:15084–15085. doi: 10.1021/ja9052784. [DOI] [PubMed] [Google Scholar]
- Tsui V, Radhakrishnan I, Wright PE, Case DA. NMR and molecular dynamics studies of the hydration of a zinc finger-DNA complex. J Mol Biol. 2000;302:1101–1117. doi: 10.1006/jmbi.2000.4108. [DOI] [PubMed] [Google Scholar]
- Tsui V, Zhu L, Huang TH, Wright PE, Case DA. Assessment of zinc finger orientations by residual dipolar coupling constants. J Biomol NMR. 2000;16:9–21. doi: 10.1023/a:1008302430561. [DOI] [PubMed] [Google Scholar]
- von Hippel PH. Completing the view of transcriptional regulation. Science. 2004;305:350–352. doi: 10.1126/science.1101270. [DOI] [PubMed] [Google Scholar]
- von Hippel PH, Berg OG. Facilitated target location in biological systems. J Biol Chem. 1989;264:675–678. [PubMed] [Google Scholar]
- Vuzman D, Azia A, Levy Y. Searching DNA via a “Monkey Bar” mechanism: the significance of disordered tails. J Mol Biol. 2010;396:674–684. doi: 10.1016/j.jmb.2009.11.056. [DOI] [PubMed] [Google Scholar]
- Vuzman D, Levy Y. DNA search efficiency is modulated by charge composition and distribution in the intrinsically disordered tail. Proc Natl Acad Sci U S A. 2010;107:21004–21009. doi: 10.1073/pnas.1011775107. [DOI] [PMC free article] [PubMed] [Google Scholar]
- Vuzman D, Polonsky M, Levy Y. Facilitated DNA search by multidomain transcription factors: cross talk via a flexible linker. Biophys J. 2010;99:1202–1211. doi: 10.1016/j.bpj.2010.06.007. [DOI] [PMC free article] [PubMed] [Google Scholar]
- Werner MH, Huth JR, Gronenborn AM, Clore GM. Molecular basis of human 46X,Y sex reversal revealed from the three-dimensional solution structure of the human SRY-DNA complex. Cell. 1995;81:705–714. doi: 10.1016/0092-8674(95)90532-4. [DOI] [PubMed] [Google Scholar]
- Williams DC, Jr., Cai M, Clore GM. Molecular basis for synergistic transcriptional activation by Oct1 and Sox2 revealed from the solution structure of the 42-kDa Oct1.Sox2.Hoxb1-DNA ternary transcription factor complex. J Biol Chem. 2004;279:1449–1457. doi: 10.1074/jbc.M309790200. [DOI] [PubMed] [Google Scholar]
- Winter RB, Berg OG, von Hippel PH. Diffusion-driven mechanisms of protein translocation on nucleic acids. 3. The Escherichia coli lac repressor-operator interaction: kinetic measurements and conclusions. Biochemistry. 1981;20:6961–6977. doi: 10.1021/bi00527a030. [DOI] [PubMed] [Google Scholar]
- Wuttke DS, Foster MP, Case DA, Gottesfeld JM, Wright PE. Solution structure of the first three zinc fingers of TFIIIA bound to the cognate DNA sequence: determinants of affinity and sequence specificity. J Mol Biol. 1997;273:183–206. doi: 10.1006/jmbi.1997.1291. [DOI] [PubMed] [Google Scholar]
- Zhang H, Zhao D, Revington M, Lee W, Jia X, Arrowsmith C, Jardtzky O. The solution structures of the trp repressor-operator DNA complex. J Mol Biol. 1994;239:592–614. doi: 10.1006/jmbi.1994.1317. [DOI] [PubMed] [Google Scholar]