Abstract
What are the physical limits to cell behavior? Often, the physical limitations can be dominated by the proteome, the cell’s complement of proteins. We combine known protein sizes, stabilities, and rates of folding and diffusion, with the known protein-length distributions P(N) of proteomes (Escherichia coli, yeast, and worm), to formulate distributions and scaling relationships in order to address questions of cell physics. Why do mesophilic cells die around 50 °C? How can the maximal growth-rate temperature (around 37 °C) occur so close to the cell-death temperature? The model shows that the cell’s death temperature coincides with a denaturation catastrophe of its proteome. The reason cells can function so well just a few degrees below their death temperature is because proteome denaturation is so cooperative. Why are cells so dense-packed with protein molecules (about 20% by volume)? Cells are packed at a density that maximizes biochemical reaction rates. At lower densities, proteins collide too rarely. At higher densities, proteins diffuse too slowly through the crowded cell. What limits cell sizes and growth rates? Cell growth is limited by rates of protein synthesis, by the folding rates of its slowest proteins, and—for large cells—by the rates of its protein diffusion. Useful insights into cell physics may be obtainable from scaling laws that encapsulate information from protein knowledge bases.
Keywords: cell biophysics, protein dynamics, protein stability, diffusion and folding, proteome modeling
What physical limits are imposed upon cells by the equilibria and kinetics of their proteomes? For example, how stable are the proteins in the proteome? What limits the speed of cell growth and replication? What determines the densities of proteins in cells? A cell’s mass is largely protein [50% of the nonaqueous component (1–3)]. So, some behaviors of cells are likely to be dominated by the physical properties of its proteome—the collection of its thousands of different types of proteins. We develop here some biophysical scaling relationships of proteomes, and we use those relationships to make estimates of the physical limits of cell behavior. Our scaling relationships come from combining current databases of the properties of proteins that have been measured in vitro, with P(N), the length distributions of proteins that are known for several proteomes. Some of the hypotheses we explore are not new; what is previously undescribed is the use of modern databases to make quantitative estimates of physical limits. A key point, previously also made by Thirumalai (4), is that many physical properties of proteins just depend on N, the number of amino acids in the protein. We estimate the folding stabilities for mesophiles and thermophiles, the folding rates, and the diffusion coefficients of whole proteomes, and we compare these various rates at the end. We first consider the folding stabilities of proteomes.
Proteomes Are Marginally Stable to Denaturation
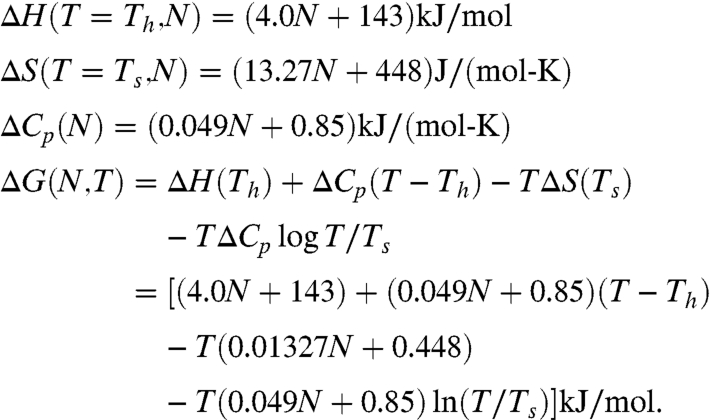
For at least 116 monomeric, two-state and reversible folding proteins there are calorimetric measurements of the folding stability, ΔG = Gunfolded - Gfolded, enthalpy ΔH, entropy ΔS, and heat capacity, ΔCp. Data are now available for both mesophilic and thermophilic proteins. Taken over the full set of proteins, these thermal quantities depend, remarkably, mainly just on the number, N, of amino acids in the chain. The relationship is simply linear. For both enthalpy and entropy the correlation with chain length is found to be the best at two reference temperatures, Th = 373.5 K and Ts = 385 K, respectively (5–7). These linear dependencies for mesophilic proteins (59 from the list of 116 proteins) are well-fit by the expressions (see Fig. 1) (7):
 |
[1] |
A simple generalization of Eq. 1 also accounts for the effects of pH, salts, and denaturants on protein stability, in addition to temperature (6).
Fig. 1.
Thermal protein properties depend linearly on chain length. (A) ΔH, enthalpy of unfolding at 100.5 °C, (B) ΔS, entropy of unfolding at 112 °C, and (C) ΔCp, temperature independent heat capacity of unfolding. (D) Free energy of folding at 37 °C determined for 59 different proteins are plotted as a function of chain length, N. The red lines in A, B, and C are the linear regressions. The red line in D is the predicted ΔG; it combines the best-fit values of changes in enthalpy, entropy, and specific heat on chain lengths obtained in A, B, and C. Reprinted from ref. 7, Copyright 2011, with permission from Elsevier.
So far, extensive studies have shown no other strong dependence of the thermal properties of folding stability. Stability does not appear to depend on amounts of secondary structure or types of tertiary structure, or numbers of hydrophobic amino acids or hydrogen bonds, or counts of salt-bridging ion pairs, for example. This is remarkable because other important properties of proteins—such as their native structures and biochemical mechanisms—often do depend strongly on details. Predicting protein stabilities is not, in general, improved by using knowledge of the native structure. So, we can predict the thermal stabilities of whole proteomes just from knowledge of their chain-length distributions. The distribution of chain lengths over the proteomes of 22 fully sequenced organisms is obtainable from genomics and proteomics databases and is known to be well approximated by a gamma distribution (8):
 |
[2] |
The two parameters, α and θ, of the protein chain-length distribution are obtained from the measured mean and variance observed for a given proteome, using the expressions
| [3] |
where the brackets  indicate averaging over all the proteins in a proteome. For Escherichia coli, for example, the average protein length is
  , and α = 2.33 (8), so
| [4] |
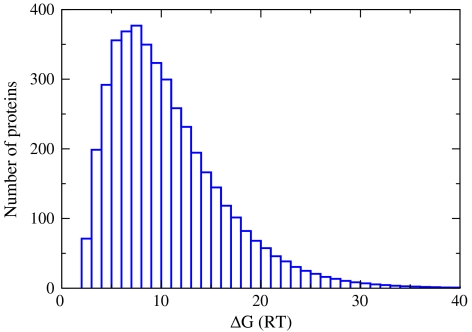
Now, by combining Eq. 1 for the stability of a protein of length N with Eq. 2 for the distribution P(N) of protein lengths in a proteome, we obtain an expression for the distribution of stabilities of a proteome’s proteins, for a given temperature T, which is plotted in Fig. 2. Below, we use these expressions to explore how heat stresses affect cells.
Fig. 2.
Distribution of free energies of folding of the proteins in the proteomes of E. coli at 37 °C. The free-energy bin size is 1RT. Area under the curve equals the total number of proteins in the proteome (4,300 for E. coli).
Cells Are Sensitive to Small Changes in Temperature.
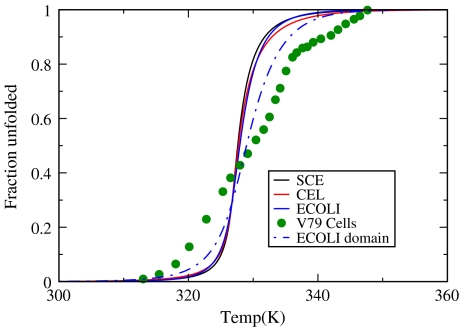
It has been suggested that the reason that cells undergo a sharp heat-death transition is that their proteins all denature near the same temperature (9, 10), which is around 50 °C for E. coli; see Fig. 3. Fig. 2 gives a quantitative model and predicts that under normal physiological conditions the E. coli proteome is marginally stable. We find that a significant fraction of the proteome’s proteins are poised near a denaturation catastrophe. Around 550 of E. coli’s 4,300 proteins are less than 3 kcal/mol stable to denaturation. This is a statement about the shape of the distribution function, not the average (11). The average protein at 37 °C is predicted to be stable by 6.8 kcal/mol. Rather, the marginal stability of the proteome comes from the broad left side of the distribution shown in Fig. 2; i.e., from the large numbers of proteins having small stabilities. This is a prediction (see also ref. 12); the actual shape of this distribution in vivo is not yet known from experiments. Note that although our conclusion is based on in vitro protein stability, experiments show that protein stabilities in vivo are not much different than in vitro (13, 14, 15).
Fig. 3.
The fraction of proteins that are unfolded in the proteomes of E. coli, yeast (SCE), and worm (CEL) as a function of temperature. Solid circles show experimentally measured fraction denatured proteins as a function of temperature for mammalian V79 cells using differential scanning calorimetry (9). The blue dashed line shows the results based on domain length distribution (69) in E. coli genome.
Some cellular properties are highly sensitive to temperature. Upshifting by only 4 °C can often induce heat shock. This is puzzling because the thermal behaviors of materials are typically governed by RT, which means that a change of 4 °C would cause only a 1% effect. In contrast, the present model suggests that temperature effects are highly leveraged by the proximity of 37 °C to the proteome’s denaturation phase boundary. The model shows that upshifting the temperature by only 4° from 37° to 41 °C destabilizes a proteome by nearly 16%. There are various biological properties of cells that show such high sensitivities, including the rates of evolution (16–18), some aspects of development (19, 20), and are the basis for some cancer treatments (21–23). Cells have evolved substantial machinery to handle the thermal denaturation of the proteome, including stress-responsive signaling pathways that transcriptionally up-regulate the proteostasis capacity of cells using chaperones, folding enzymes, and coupled disaggregation and degradation activities (24, 25). In addition, small changes in geological temperatures can cause ecological shifts in populations. We note that the stabilities reported here differ slightly from those given elsewhere (11) because of updated data (7).
Thermophilic Proteomes Are Different from Mesophilic Proteomes.
Above, we described the stabilities of mesophiles, organisms that grow at temperatures between 25 and 40 °C. The same approach can be applied to thermophiles, organisms that grow at temperatures higher than 40 °C. There is now a substantial database of two-state monomeric thermophilic proteins. What is the difference between the proteomes of mesophiles vs. thermophiles? A study of 59 mesophilic proteins and 57 thermophilic proteins indicates some systematic differences (7). Whereas the free energy of folding mesophilic proteomes is given by Eq. 1, we find that the free energy of folding thermophilic proteomes is given by
 |
[5] |
Comparing Eq. 1 with Eq. 5 and analyzing the database show that thermophilic proteomes have less positive entropies and enthalpies of unfolding, on average, than mesophilic proteomes (7). This suggests that the denatured states of thermophilic proteins may be more compact than the denatured states of mesophilic proteins. The reasons for these differences are not yet known, but may include differences in hydrophobic residues, disulfide bonds, electrostatic interactions (7, 26–36), different amino acid flexibilities (37–41), or loop deletions (42).
A Model for the Optimal Growth Temperatures of Cells.
A cell has an optimal growth temperature. That is, cells grow fastest at one particular temperature, and slower at either higher or lower temperatures. The general view is that this optimum follows from a balance of two factors (7, 11, 43). On the one hand, biochemical processes have activation barriers, so heating a cell should accelerate its cellular metabolism. On the other hand, if a cell is heated too much, its proteome will denature. Here, we give a quantitative expression for cell growth vs. temperature, based on the stability expressions above. We model the growth rate, r(T), of an organism as a function of temperature T using the expression
 |
[6] |
where r0 is an intrinsic growth-rate parameter, ΔH† is a dominant activation barrier, Γ is the number of proteins that are essential to growth, and
 |
[7] |
is the probability that the ith essential protein (having chain length Ni) is in the folded state. Following earlier work (43), Eq. 6 expresses the assumption that there are essential proteins, all of which, by definition, must be folded independently at a sufficient level for a cell to be viable. By definition, if any one essential protein is not folded, the cell is not viable. We compute f(Ni,T) using Eq. 7 for the folding free energy ΔG(Ni,T). We simplify this expression by taking the logarithm and approximating the product by averaging over the entire proteome distribution (7, 11, 43). The result is
 |
[8] |
where P(N) is the proteome chain-length distribution and f(N,T) is computed using G(N,T) following Eq. 1 for mesophiles or Eq. 5 for thermophiles.
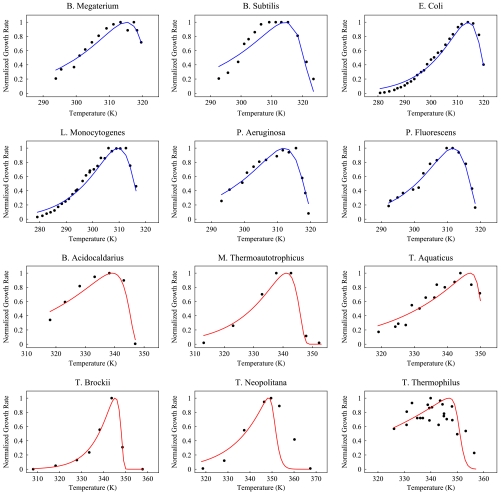
Fig. 4 shows that this model provides reasonable fits to growth curves for cells using two parameters, ΔH† and Γ, for each cell type (7). It appears that cells have evolved to run as “hot” as possible for maximizing the speeds of their biochemical reactions, while remaining just cool enough to avoid a denaturation catastrophe. The reason this optimum growth temperature can be so close to the death temperature is because the denaturation of the proteome is so sharply cooperative (see Fig. 3).
Fig. 4.
Black circles denote growth rate as a function of temperature for species listed. On the Y axis, we plot growth rate normalized with respect to maximum growth rate, whereas on the X axis we plot temperature. Solid lines are fit to data from Eq. 8. Red graphs denote thermophilic species, whereas blue curves are for mesophiles. Sources of the data are given in table 2 in the supplemental material of ref. 7. Reprinted from ref. 7, Copyright 2011, with permission from Elsevier.
Proteome stability models such as this may be useful for exploring other properties of cells. For example, Drummond et al. have proposed a relationship between the stability and rate of evolution of a protein. They argue that the most highly expressed proteins are optimized for stability; this enables those proteins to avoid misfolding and aggregation from sporadic mistranslation events. Stable proteins (which are highly expressed) have slower rates of evolution than less stable proteins (which have lower expression levels) (44–47).
Diffusional Transport of Proteins Within Cells
A limitation on the rates of a cell’s biochemical processes is the rate at which proteins can diffuse throughout the cell. For the purpose of computing diffusion rates, native proteins are often treated as being approximately spherical. The diffusion constant of a sphere is given by the Stokes–Einstein expression
 |
[9] |
where η is the viscosity of the solvent in a dilute solution, RT is Boltzmann’s constant multiplied by temperature, and Rh is the radius of hydration of the sphere. Eq. 9 shows how the diffusion coefficient depends on the radius of the molecule. In the sections below, we simplify by expressing the radius, Rh(N), of a native protein as a function of its number of amino acids, N, in the protein chain.
Native-Protein Sizes Scale as Rn ≈ N2/5.
If native proteins were perfect spheres, their radii, Rn, should scale with chain length N as Rn(N) ≈ N1/3 (48–50). However, recent studies of the Protein Data Bank show instead a scaling approximately with N2/5 (51):
| [10] |
based on an analysis of 37,000 protein structures, where N is the number of amino acids in the protein and Rn is given in angstroms. No major dependence was found of the native-state radius on the type or degree of secondary structure in the protein (51). The physical basis for the exponent of 2/5 is not fully clear, but can be rationalized either as being due to a balance between excluded volume and intermonomer elastic interactions (51) or because of the multidomain nature of many proteins. The difference in exponents between 1/3 and 2/5 would lead to negligible differences in fitting diffusion coefficients, of interest here; we use Eq. 10 below.
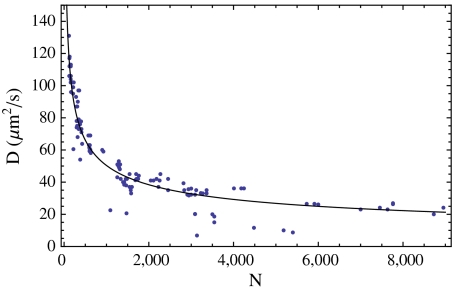
Now, in order to compute the diffusion properties, we need to obtain the hydrodynamic radius, Rh. We could adopt the expression for a perfect sphere, Rh = (5/3)1/2Rn ≃ 1.3Rn. However, in a survey of native proteins, Tyn and Gusek demonstrated that a better approximation is Rh = 1.45Rn (52). Fig. 5 compares theory (combining this approximation with Eqs. 9 and Eq. 10) to experimental diffusion coefficients measured in vitro. The agreement is quite good. Combining the Tyn and Gusek expression with Eq. 10 and with the standard diffusion expression gives, for the time t required for a native protein of N amino acids to diffuse an rms distance of  ,
,
 |
[11] |
where  . Combining Eq. 11 with the chain-length distribution, Eq. 4, gives the distribution of native-protein diffusion coefficients, at infinite dilution, for a proteome. However, to treat proteins in the cell, we must also account for the density of the molecular obstacles inside the cell. A protein will diffuse less distance in a given time in a crowded environment. We approximate the cell’s internal viscosity in terms of monodisperse hard spheres (53),
| [12] |
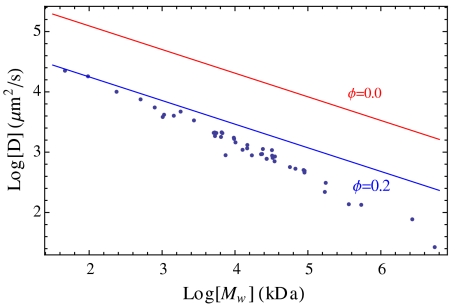
where η0 is the viscosity of water in the absence of crowding agents, and ϕc ≃ 0.58 is the critical concentration at which the glass transition occurs (54). The volume fraction of macromolecules in the cell is known to be ϕ ≃ 0.2 (55–57). Using Eq. 12 for the viscosity, Eq. 9 gives a reasonable approximation to diffusion rates for proteins in the cell for many purposes; see Fig. 6. We neglected attractive interactions between proteins. This is consistent with the conclusions of Ando and Skolnick who argued for the dominance of excluded volume and hydrodynamic factors (58), but other work indicates that attractive forces can contribute more significantly (15).
Fig. 5.
Dependence of diffusion constant on chain length. Comparison of experimental in vitro diffusion constants (52) to Eq. 9 with the Tyn and Gusek approximation Rh = 1.45Rn. Molecular weights have been converted to amino acid numbers using N = Mw/110 Da.
Fig. 6.
Effect of crowding on diffusion constants. Computed diffusion constants at infinite dilution (ϕ = 0) and in the presence of crowding compared to the steric interaction simulation of McGuffee and Elcock (15).
Now, using Eq. 12, the expression for the diffusion time becomes
 |
[13] |
Using the proteome length distributions, P(N), we compute the distribution of diffusion times for different cells, i.e., having different values of ℓ0 (1 μm, 10 μm, and 100 μm). We now apply this model to a question of protein densities in cells.
Why Are Cells so Crowded with Proteins?
We explore here the following hypothesis: Perhaps evolution maximizes the speed of biochemical reactions by varying the size of a cell so as to optimize the density of proteins inside the cell. On the one hand, if the cell’s protein density were too low (cell size is too large), reactions would be slowed by the time required for the proteins to diffuse and collide with each other. On the other hand, if the cell’s protein density were too high (cell size is too small), diffusion would be slow because of the crowded medium through which the proteins must move.
Here is a model of that hypothesis. Consider the rate at which diffusion-limited reactions occur. Such rates are proportional to the product of the concentration of the reactants and the diffusion constant. For example, a stationary reactant of radius a will react with mobile particles at a rate rd = 4πacD, where c and D are the concentration and diffusion constant of the mobile reactants. Using the volume fraction ϕ instead of c, the rate is
 |
[14] |
Now, we treat this as an optimization problem. If we suppose that the number of protein molecules is fixed, then evolution can change a cell’s protein density by inversely changing the cell’s volume. A large cell would have a low concentration, and a small cell would have a high concentration. To find the optimal (maximum) reaction rate, we set the derivative to zero,
 |
[15] |
rd has a maximum at ϕ = ϕc/3 (59). Because ϕc = 0.58 for hard spheres (54), this model predicts the optimal density for maximal reaction rates would be ϕ = 0.19. This is close to the protein densities (ϕ ≈ 0.2) observed in cells (55–57).
Protein Folding Kinetics
The physical dynamics within a cell is also limited by the rate at which its proteome folds. In a well-known observation, Plaxco, Simons, and Baker (PSB) (60) showed that the folding rates of two-state proteins correlate with the topology of the native structure: Proteins that have more local structure (such as helices) fold faster than proteins that have more nonlocal structures (such as β-sheets).
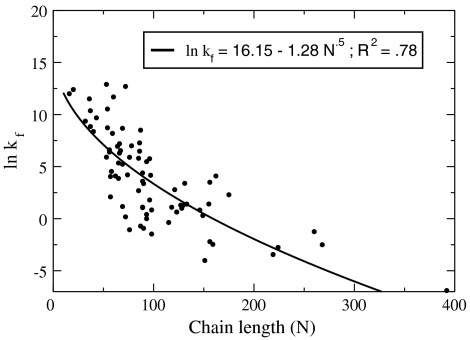
Alternatively, in equally good agreement with the experimental data, Thirumalai explained that folding rates correlate with chain length N, through the form kf ∼ exp(-N1/2) based on theory of random systems (61). Ouyang and Liang (62) looked at a broader set of proteins than PSB, including multistate folders. Other studies also give folding rates (63) under unifying conditions and study rates as a function of chain length (64–68). Here we use the Thirumalai expression to best fit the Liang data, giving
| [16] |
where kf has units of second-1. This shows that folding rates, kf(N), are relatively well predicted (correlation coefficient of 0.78) simply as a function of chain-length N (see Fig. 7). Hence, we can combine this expression with P(N), the proteome chain-length distribution, to predict the folding rates of proteomes over whole proteomes (here, taken at the denaturation temperature for each protein). Fig. 8 shows the predicted folding rate distribution for E. coli using the domain distribution (11, 69). We use this treatment below for comparing the time scales of various processes in the cell.
Fig. 7.
Chain-length dependent fit (Eq. 16 using result from ref. 61) to the folding rates of 80 proteins including two-state and multistate folders (62). Data in circles and fit in solid line.
Fig. 8.
Smoothed histograms (logarithmically spaced bins) of the time distributions for protein folding, translation, and diffusion compared to the range of reaction rates reported by ref. 72. Folding time distribution was calculated using domain length distribution in the proteome of E. coli and Eq. 16. The vertical line indicates 20 min, roughly the replication speed limit for E. coli.
Comparing the Time Scales of Dynamical Processes in the Cell.
Now, we combine the various rate distributions above. Fig. 8 shows some rate distributions (for E. coli): protein folding, protein diffusion across the cell, rates of biochemical reactions (uncatalyzed and catalyzed), and rates of protein synthesis assuming a translation rate of 15 amino acids per second (70). The vertical bar on the right shows E. coli’s roughly 20-min replication time under fast-growth conditions (1). By comparing different rates, Fig. 8 gives some useful insights about the physical limits on cells.
First, it can be inferred that E. coli has evolved to replicate at speeds approaching its maximum possible “speed limit.” Here is the argument. Imagine two limiting cases. On the one hand, E. coli could have evolved so that each cell had only a single ribosome. On the other hand, E. coli could have evolved so that every cell is full of ribosomes. In the former case, E. coli would replicate very slowly; in the latter, E. coli would replicate very rapidly. Here are simple numerical estimates for these two conceptual limiting cases: (i) Slowest possible, series replication. If each E. coli cell contained only a single ribosome, that ribosome would have to copy every protein in the cell, one at a time, in series, before the cell could reproduce. Taking the single protein-replication time to be around 20 s (see Fig. 8 and ref. 2), it would take 2 y for each E. coli cell to replicate all of its 3 million protein molecules. (ii) Fastest possible, parallel replication. E. coli can replicate much faster than this because the cell has multiple ribosomes. A cell can “parallel process” its protein synthesis. Imagine the maximum conceivable parallelization: If every protein molecule in E. coli were a ribosomal protein, then each ribosome (a 55-protein complex of about 7,400 amino acids) would need only to synthesize its own 55 proteins in series, not 3 million. In this limit, E. coli could replicate in around 8 min [7,400/(15 aa/s)]. This is a simple “ballpark” estimate, not expected to be good to better than a factor of two or three. In reality, E. coli is able to replicate at a speed that is exceedingly close to this maximum possible physical speed limit. This simple estimate also illustrates how a cell’s physical limitations can contribute to its evolutionary limitations.
Second, enzymes are highly effective. Catalyzed reactions are rarely rate-limiting for the cell and are much faster than diffusion and folding. A key kinetic bottleneck in E. coli is the folding of the cell’s slowest proteins, which happens on a time scale commensurate with protein synthesis.
Third, what limits the sizes to which cells can grow? One argument is that cell sizes are limited by surface-to-volume ratios. Cells that are too large in volume may be limited by the rate at which nutrients are taken up, which in turn is limited by the cell’s membrane surface area. Another possible factor limiting cell growth is shown in Fig. 8: the rates at which a protein can diffuse across it. Eqs. 11 and 13 show that every factor of 10 increase in linear size of a cell leads to a factor of 100 increase in the time required for proteins to diffuse across the cell’s length. Fig. 8 shows that for cells that are 100 μm in linear dimension, protein-diffusion transit times across a cell can become rate-limiting. So, although small cells are rate-limited by protein synthesis, large cells may also be limited by diffusional transport of proteins around the cell. Interestingly, prokaryotes are typically a few micrometers in size, eukaryotes are a few tens of micrometers, and there are very few cells much larger than 100 μm (2). Biology’s need to move molecules around inside larger cells may have contributed to the evolution of compartmentalization into organelles, active transport machinery, nonthermal transport (71) systems, and chaperones for speeding up protein folding.
Summary.
We use simple scaling and distribution relationships, derived from recent databases, to describe some physical properties of proteins in cellular proteomes. The data show that many properties of proteins, including their sizes, stabilities, folding rates, and diffusion coefficients, depend simply on the chain length N. We combine data with the chain-length distributions P(N) of proteins in cellular proteomes to make simple quantitative estimates of cell properties. We find that the death temperatures of cells, around 50 °C, coincide with a denaturation catastrophe of the proteome. We find that the high protein densities in cells (around 20% volume fraction) can be rationalized on the basis that it maximizes biochemical reaction rates. And, we find that the diffusion and folding of the slowest proteins may impose limits to cell growth speeds and sizes.
Acknowledgments.
We thank Adrian Elcock for providing us with the simulation data for diffusion constants in Fig. 6. We thank Adrian Elcock, Dan Farrell, Jie Liang, Arijit Maitra, Wallace Marshall, Sefika Banu Ozkan, Alberto Perez, Larry Schweitzer, Dave Thirumalai, and Chris Voigt for helpful comments. We appreciate the support of National Institutes of Health Grant GM 34993.
Footnotes
This contribution is part of the special series of Inaugural Articles by members of the National Academy of Sciences elected in 2008.
The authors declare no conflict of interest.
References
- 1.Alberts B, et al. Molecular Biology of the Cell. New York: Garland Science; 2002. [Google Scholar]
- 2.Phillips R, Kondev J, Theriot J. Physical Biology of the Cell. New York: Garland Science; 2008. [Google Scholar]
- 3.Nelson P. Biological Physics Energy, Information, Life. New York: Freeman and Company; 2008. [Google Scholar]
- 4.Thirumalai D, OBrien EP, Morrison G, Hyeon C. Theoretical perspectives on protein folding. Annu Rev Biophys. 2010;39:159–183. doi: 10.1146/annurev-biophys-051309-103835. [DOI] [PubMed] [Google Scholar]
- 5.Robertson AD, Murphy KP. Protein structure and the energetics of protein stability. Chem Rev. 1997;97:1251–1267. doi: 10.1021/cr960383c. [DOI] [PubMed] [Google Scholar]
- 6.Ghosh K, Dill KA. Computing protein stabilities from their chain lengths. Proc Natl Acad Sci USA. 2009;106:10649–10654. doi: 10.1073/pnas.0903995106. [DOI] [PMC free article] [PubMed] [Google Scholar]
- 7.Sawle L, Ghosh K. How do thermophilic proteins and proteomes withstand high temperature ? Biophys J. 2011;101:217–227. doi: 10.1016/j.bpj.2011.05.059. [DOI] [PMC free article] [PubMed] [Google Scholar]
- 8.Zhang JZ. Protein-length distributions for the three domains of life. Trends Genet. 2000;16:107–109. doi: 10.1016/s0168-9525(99)01922-8. [DOI] [PubMed] [Google Scholar]
- 9.Lepock JR. Measurement of protein stability and protein denaturation in cells using differential scanning calorimetry. Methods. 2005;35:117–125. doi: 10.1016/j.ymeth.2004.08.002. [DOI] [PubMed] [Google Scholar]
- 10.Westra A, Dewey WC. Variation in sensitivity to heat shock during cell-cycle of chinese hamster cells in-vitro. Int J Radiat Biol. 1971;19:467–477. doi: 10.1080/09553007114550601. [DOI] [PubMed] [Google Scholar]
- 11.Ghosh K, Dill KA. Cellular proteomes have broad distributions of protein stability. Biophys J. 2010;99:3996–4002. doi: 10.1016/j.bpj.2010.10.036. [DOI] [PMC free article] [PubMed] [Google Scholar]
- 12.Zeldovich K, Chen P, Shakhnovich EI. Protein stability imposes limits on organism complexity and speed of molecular evolution. Proc Natl Acad Sci USA. 2007;104:16152–16157. doi: 10.1073/pnas.0705366104. [DOI] [PMC free article] [PubMed] [Google Scholar]
- 13.Ghaemmaghami S, Oas TG. Quantitative protein stability measurement in vivo. Nat Struct Biol. 2001;8:879–882. doi: 10.1038/nsb1001-879. [DOI] [PubMed] [Google Scholar]
- 14.Ignatova Z, Gierasch LM. Monitoring protein stability and aggregation in vivo by real-time fluorescent labeling. Proc Natl Acad Sci USA. 2004;101:523–528. doi: 10.1073/pnas.0304533101. [DOI] [PMC free article] [PubMed] [Google Scholar]
- 15.McGuffee SR, Elcock AH. Diffusion, crowding protein stability in a dynamic molecular model of the bacterial cytoplasm. PLoS Comput Biol. 2010;6:e1000694. doi: 10.1371/journal.pcbi.1000694. [DOI] [PMC free article] [PubMed] [Google Scholar]
- 16.Kennett JP, Stott LD. Abrupt deep-sea warming, palaeoceanographic changes and benthic extinctions at the end of the Palaeocene. Nature. 1991;353:225–229. [Google Scholar]
- 17.Ivany LC, Patterson WP, Lohmann KC. Cooler winters as a possible cause of mass extinctions at the Eocene/Oligocene boundary. Nature. 2000;407:887–890. doi: 10.1038/35038044. [DOI] [PubMed] [Google Scholar]
- 18.Allen AP, Gilooly JF, Savage M, Brown JH. Kinetic effects of temperature on rates of genetic divergence and speciation. Proc Natl Acad Sci USA. 2006;103:9130–9135. doi: 10.1073/pnas.0603587103. [DOI] [PMC free article] [PubMed] [Google Scholar]
- 19.Ferguson MWJ, Joanen T. Temperature of egg incubation determines sex in Alligator mississippiensis. Nature. 1982;296:850–853. doi: 10.1038/296850a0. [DOI] [PubMed] [Google Scholar]
- 20.Webb GJW, Cooper-Preston H. Effects of incubation temperature on crocodiles and the evolution of reptilian oviparity. Am Zool. 1989;29:953–971. [Google Scholar]
- 21.Weinberg RA. The Biology of Cancer. New York: Garland Science; 2007. [Google Scholar]
- 22.Coffey DS, Getzenberg RH, DeWeese TL. Hyperthermic biology and cancer therapies: A hypothesis for the “Lance Armstrong Effect”. JAMA. 2006;296:445–448. doi: 10.1001/jama.296.4.445. [DOI] [PubMed] [Google Scholar]
- 23.Vertrees RA, Zwischenberger JB, Boor PJ, Pencil SD. Oncogenic ras results in increased cell kill due to defective thermoprotection in lung cancer cells. Ann Thorac Surg. 2000;69:1675–1680. doi: 10.1016/s0003-4975(00)01421-1. [DOI] [PubMed] [Google Scholar]
- 24.Balch WE, Morimoto RI, Dillin A, Kelly JW. Adapting proteostasis for disease intervention. Science. 2008;319:916–919. doi: 10.1126/science.1141448. [DOI] [PubMed] [Google Scholar]
- 25.Dobson CM. Protein folding and misfolding. Nature. 2003;426:884–890. doi: 10.1038/nature02261. [DOI] [PubMed] [Google Scholar]
- 26.Cho JH, Sato S, Raleigh DP. Thermodynamics and kinetics of non-native interactions in protein folding: A single point mutant significantly stabilizes the N-terminal domain of L9 by modulating non-native interactions in the denatured state. J Mol Biol. 2004;338:827–837. doi: 10.1016/j.jmb.2004.02.073. [DOI] [PubMed] [Google Scholar]
- 27.Ge M, Xia, X-Y, Pan X-M. Salt bridges in the hyperthermophilic protein Ssh10b are resilient to temperature increases. J Biol Chem. 2008;283:31690–31696. doi: 10.1074/jbc.M805750200. [DOI] [PubMed] [Google Scholar]
- 28.Rosato V, Pucello N, Giuliano G. Evidence for cysteine clustering in thermophilic proteomes. Trends Genet. 2002;18:278–281. doi: 10.1016/S0168-9525(02)02691-4. [DOI] [PubMed] [Google Scholar]
- 29.Clarke J, Hounslow AM, Bond CJ, Fersht AR, Daggett V. The effects of disulfide bonds on the denatured state of barnase. Protein Sci. 2000;9:2394–2404. doi: 10.1110/ps.9.12.2394. [DOI] [PMC free article] [PubMed] [Google Scholar]
- 30.Pace CN, Alston RW, Shaw KL. Charge-charge interactions influence the denatured state ensemble and contribute to protein stability. Protein Sci. 2000;9:1395–1398. doi: 10.1110/ps.9.7.1395. [DOI] [PMC free article] [PubMed] [Google Scholar]
- 31.Elcock AH. The stability of salt bridges at high temperatures: Implications for hyperthermophilic proteins. J Mol Biol. 1998;284:489–502. doi: 10.1006/jmbi.1998.2159. [DOI] [PubMed] [Google Scholar]
- 32.Kumar S, Tsai C, Nussinov R. Factors enhancing protein thermostability. Protein Eng. 2000;13:179–191. doi: 10.1093/protein/13.3.179. [DOI] [PubMed] [Google Scholar]
- 33.Kumar S, Ma B, Tsai C, Nussinov R. Electrostatic strengths of salt bridges in thermophilic and mesophilic glutamate dehydrogenase monomers. Proteins. 2000;38:368–383. doi: 10.1002/(sici)1097-0134(20000301)38:4<368::aid-prot3>3.0.co;2-r. [DOI] [PubMed] [Google Scholar]
- 34.Dominy B, Minoux H, Brooks CL. An electrostatic basis for the stability of thermophilic proteins. Proteins. 2004;57:128–141. doi: 10.1002/prot.20190. [DOI] [PubMed] [Google Scholar]
- 35.Zhou HX, Dong F. Electrostatic contributions to the stability of a thermophilic cold shock protein. Biophys J. 2003;84:2216–2222. doi: 10.1016/S0006-3495(03)75027-9. [DOI] [PMC free article] [PubMed] [Google Scholar]
- 36.Lee C, Allen M, Bycroft M, Wong K. Electrostatic interactions contribute to reduced heat capacity change of unfolding in a thermophilic ribosomal protein 130 e. J Mol Biol. 2005;348:419–431. doi: 10.1016/j.jmb.2005.02.052. [DOI] [PubMed] [Google Scholar]
- 37.Matthews BW, Nicholson H, Becktel WJ. Enhanced protein thermostability from site-directed mutations that decrease the entropy of unfolding. Proc Natl Acad Sci USA. 1987;84:6663–6667. doi: 10.1073/pnas.84.19.6663. [DOI] [PMC free article] [PubMed] [Google Scholar]
- 38.Scott KA, Alonso DOV, Sato S, Fersht AR, Daggett V. Conformational entropy of alanine versus glycine in protein denatured states. Proc Natl Acad Sci USA. 2007;104:2661–2666. doi: 10.1073/pnas.0611182104. [DOI] [PMC free article] [PubMed] [Google Scholar]
- 39.Berezovsky IN, Chen WW, Choi PJ, Shakhnovich EI. Entropic stabilization of proteins and its proteomic consequences. PLoS Comput Biol. 2005;1:e47. doi: 10.1371/journal.pcbi.0010047. [DOI] [PMC free article] [PubMed] [Google Scholar]
- 40.Watanabe K, Suzuki Y. Protein thermostabilization by proline substitutions. J Mol Catal B Enzym. 1998;4:167–180. [Google Scholar]
- 41.Trevino SR, Schaefer S, Scholtz JM, Pace CN. Increasing protein conformational stability by optimizing beta-turn sequence. J Mol Biol. 2007;373:211–218. doi: 10.1016/j.jmb.2007.07.061. [DOI] [PMC free article] [PubMed] [Google Scholar]
- 42.Thompson MJ, Eisenberg D. Transproteomic evidence of a loop-deletion mechanism for enhancing protein thermostability. J Mol Biol. 1999;290:595–604. doi: 10.1006/jmbi.1999.2889. [DOI] [PubMed] [Google Scholar]
- 43.Chen P, Shakhnovich EI. Thermal adaptation of viruses and bacteria. Biophys J. 2010;98:1109–1118. doi: 10.1016/j.bpj.2009.11.048. [DOI] [PMC free article] [PubMed] [Google Scholar]
- 44.Sharp PM, Li WH. The rate of synonymous substitution in enterobacterial genes is inversely related to codon usage bias. Mol Biol Evol. 1987;4:222–230. doi: 10.1093/oxfordjournals.molbev.a040443. [DOI] [PubMed] [Google Scholar]
- 45.Pal C, Papp B, Hurst LD. Highly expressed genes in yeast evolve slowly. Genetics. 2001;158:927–931. doi: 10.1093/genetics/158.2.927. [DOI] [PMC free article] [PubMed] [Google Scholar]
- 46.Drummond DA, Bloom JD, Adami C, Wilke CO, Arnold FH. Why highly expressed proteins evolve slowly. Proc Natl Acad Sci USA. 2005;102:14338–14343. doi: 10.1073/pnas.0504070102. [DOI] [PMC free article] [PubMed] [Google Scholar]
- 47.Drummond DA, Wilke CO. Mistranslation-induced protein misfolding as a dominant constraint on coding-sequence evolution. Cell. 2008;134:341–352. doi: 10.1016/j.cell.2008.05.042. [DOI] [PMC free article] [PubMed] [Google Scholar]
- 48.Flory PJ. Principles of Polymer Chemistry. Ithaca, NY: Cornell Univ Press; 1953. [Google Scholar]
- 49.Dill KA, Broomberg S. Molecular Driving Forces. New York: Garland Science; [Google Scholar]
- 50.Dima RI, Thirumalai D. Asymmetry in the shapes of folded and denatured states of proteins. J Phys Chem B. 2004;108:6564–6570. [Google Scholar]
- 51.Hong L, Lei J. Scaling law for the radius of gyration of proteins and its dependence on hydrophobicity. J Poly Sci B. 2009;47:207–214. [Google Scholar]
- 52.Tyn MT, Gusek TW. Prediction of diffusion coefficients of proteins. Biotechnol Bioeng. 1990;35:327–338. doi: 10.1002/bit.260350402. [DOI] [PubMed] [Google Scholar]
- 53.Tokuyama M, Oppenheim I. On the theory of concentrated hard-sphere suspensions. Physica A. 1995;216:85–119. [Google Scholar]
- 54.Weeks ER, Crocker JC, Levitt AC, Schofield A, Weitz DA. Three-dimensional direct imaging of structural relaxation near the colloidal glass transition. Science. 2000;287:627–631. doi: 10.1126/science.287.5453.627. [DOI] [PubMed] [Google Scholar]
- 55.Fulton AB. How crowded is the cytoplasm? Cell. 1982;30:345–347. doi: 10.1016/0092-8674(82)90231-8. [DOI] [PubMed] [Google Scholar]
- 56.Zimmerman SB, Trach SO. Estimation of macromolecular concentration and excluded volume effects for the cytoplasm of Escherichia coli. J Mol Biol. 1991;222:599–620. doi: 10.1016/0022-2836(91)90499-v. [DOI] [PubMed] [Google Scholar]
- 57.Ellis RJ. Macromolecular crowding: Obvious but underappreciated. Trends Biochem Sci. 2001;26:597–604. doi: 10.1016/s0968-0004(01)01938-7. [DOI] [PubMed] [Google Scholar]
- 58.Ando T, Skolnick J. Crowding and hydrodynamic interactions likely dominate in vivo macromolecular motion. Proc Natl Acad Sci USA. 2010;107:18457–18462. doi: 10.1073/pnas.1011354107. [DOI] [PMC free article] [PubMed] [Google Scholar]
- 59.Schmit JD, Kamber E, Kondev J. Lattice model of diffusion-limited bimolecular chemical reactions in confined environments. Phys Rev Lett. 2009;102:218302. doi: 10.1103/PhysRevLett.102.218302. [DOI] [PubMed] [Google Scholar]
- 60.Plaxco KW, Simons KT, Baker D. Contact order, transition state placement and the refolding rates of single domain proteins. J Mol Biol. 1998;277:985–994. doi: 10.1006/jmbi.1998.1645. [DOI] [PubMed] [Google Scholar]
- 61.Thirumalai D. From minimal models to real proteins: Time scales for protein folding kinetics. J Phys I France. 1995;5:1457–1467. [Google Scholar]
- 62.Ouyang Z, Liang J. Predicting protein folding rates from geometric contact and amino acid sequence. Protein Sci. 2008;17:1256–1263. doi: 10.1110/ps.034660.108. [DOI] [PMC free article] [PubMed] [Google Scholar]
- 63.Maxwell KL, et al. Protein folding: Defining a “standard set” of experimental conditions and a preliminary kinetic data set of two-state proteins. Protein Sci. 2005;14:602–616. doi: 10.1110/ps.041205405. [DOI] [PMC free article] [PubMed] [Google Scholar]
- 64.Finkelstein AV, Badretdinov AYA. Rate of protein folding near the point of thermodynamics equilibrium between the coil and the most stable chain fold. Fold Des. 1997;2:115–121. doi: 10.1016/s1359-0278(97)00016-3. [DOI] [PubMed] [Google Scholar]
- 65.Koga N, Takada S. Role of native topology and chain-length scaling in protein folding: A simulation study with a Go-like model. J Mol Biol. 2001;313:171–180. doi: 10.1006/jmbi.2001.5037. [DOI] [PubMed] [Google Scholar]
- 66.Galzitskaya OV, Garbuzynskiy SO, Ivankov DN, Finkelstein AV. Chain length is the main determinant of the folding rate of proteins with three-state folding kinetics. Proteins. 2003;51:162–166. doi: 10.1002/prot.10343. [DOI] [PubMed] [Google Scholar]
- 67.Ivankov DN, et al. Contact order revisited: Influence of protein size on the folding rate. Protein Sci. 2003;12:2057–2062. doi: 10.1110/ps.0302503. [DOI] [PMC free article] [PubMed] [Google Scholar]
- 68.Naganathan AN, Munoz V. Scaling of folding times with protein size. J Am Chem Soc. 2005;127:480–481. doi: 10.1021/ja044449u. [DOI] [PubMed] [Google Scholar]
- 69.Lipman DJ, Souvorov A, Koonin EV, Panchenko AR, Tatusova TA. The relationship of protein conservation and sequence length. BMC Evol Biol. 2002;2:20. doi: 10.1186/1471-2148-2-20. [DOI] [PMC free article] [PubMed] [Google Scholar]
- 70.Young R, Bremer H. Polypeptide-chain-elongation rate in Escherichia coliB/r as a function of growth rate. Biochem J. 1976;160:185–194. doi: 10.1042/bj1600185. [DOI] [PMC free article] [PubMed] [Google Scholar]
- 71.Brangwynne CP, Koenderink GH, MacKintosh FC, Weitz DA. Cytoplasmic diffusion: molecular motors mix it up. J Cell Biol. 2008;183:583–587. doi: 10.1083/jcb.200806149. [DOI] [PMC free article] [PubMed] [Google Scholar]
- 72.Radzicka A, Wolfenden R. A proficient enzyme. Science. 1995;267:90–93. doi: 10.1126/science.7809611. [DOI] [PubMed] [Google Scholar]


