Fluoresceinated dextrans up to 70 kDa in size were delivered to the rabbit posterior retina and choroid using sub-Tenon injections. Intraocular fluorescence was monitored in vivo with noninvasive ocular fluorophotometry.
Abstract
Purpose.
To evaluate the transscleral delivery of fluoresceinated dextrans (FITC-D) with molecular mass up to 70 kDa to the rabbit posterior segment using sub-Tenon injections.
Methods.
Eighteen NZW rabbits received a unilateral 200-μL injection of 2 mg/mL sodium fluorescein (NaF), 25 mg/mL 40-kDa FITC-D, or 25 mg/mL 70-kDa FITC-D, with (n = 9) or without (n = 9) immediate euthanatization. In live animals, fluorescence was measured in the retina/choroid and mid-vitreous by fluorophotometry, immediately after injection and after 4, 24, 48, and 72 hours. Euthanatized animals were examined hourly through 5 or 6 hours.
Results.
In live animals, the average peak NaF concentration in the retina/choroid was 310.2 ng/mL, measured 3 hours after injection. Average 40- and 70-kDa FITC-D concentrations in the retina/choroid peaked at 5409.6 and 2375.6 ng/mL, respectively, 24 hours after injection. Fluorescence returned to baseline levels 6 hours after NaF injection, and 48 and 72 hours after 40- and 70-kDa FITC-D injections, respectively. Rabbits that received NaF followed by euthanatization exhibited a continuous increase in retina/choroid and mid-vitreous fluorescence, beginning 1 hour after injection, whereas FITC-D-injected eyes did not show elevated retina/choroid or mid-vitreous fluorescence through 6 hours.
Conclusions.
FITC-D weighing up to 70-kDa, as well as NaF, reached the posterior retina/choroid after sub-Tenon injections in live rabbits. NaF and 40-kDa FITC-D reached higher peak concentrations and were cleared from the eye more rapidly than was 70-kDa FITC-D. There was minimal penetration of NaF and FITC-D into the mid-vitreous in the in vivo experiments.
The rapidly changing field of ocular pharmacology requires an equally dynamic approach to ocular drug delivery. In recent years, new developments in ocular therapeutics have favored protein-based agents in the treatment of posterior segment disease, suggesting a shift toward future drugs engineered to treat specific conditions.1 If the therapeutic effect of these high-molecular-weight agents is to be maximized, successful delivery to their target tissues is essential. Intravitreal injection is currently the most common route of delivery of proteins into the posterior segment. Ranibizumab (Lucentis; Genentech, South San Francisco, CA) is a commonly prescribed pharmacologic treatment for age-related macular degeneration, and although clinical trials have demonstrated clinical efficacy with visual improvement, recommended dose frequency is one 0.5-mg (50 μL) intravitreal injection per month for at least 9 months.2,3 Each intravitreal injection carries a small risk of adverse effects (including endophthalmitis, retinal detachment, and hemorrhage); although the incidence of complications is low, their vision-threatening nature has spurred the search for a safer alternative.4,5
One proposed alternative to repeated intravitreal injections has been to decrease the injection frequency via an implantable drug delivery device. These devices, however, are currently available only for delivery of small-molecule medications, and the procedures necessary to place them inside the globe are themselves not without risk.6–8 Furthermore, once a drug has entered the vitreous cavity, its exact distribution within the vitreous humor is not completely understood. Changes related to natural vitreous aging (known as syneresis), vitreoretinal surgery, and multiple injection procedures may affect a drug's distribution characteristics and kinetics. Recent in vivo findings suggest that the half-life of VEGF is significantly shortened in vitrectomized rabbit eyes9; a similar change in drug pharmacokinetics is likely in human eyes after vitrectomy. A delivery technique that does not rely on the vitreous for distribution could therefore achieve more predictable drug levels at the retina, RPE, and choroid.
Transscleral drug delivery has been proposed as a less invasive alternative to vitreous-based delivery, seeking to minimize the trauma and risk associated with penetration of the sclera and vitreous. In vitro studies have established that the sclera is permeable to compounds such as fluorescein, dextran (up to 70-kDa), steroids, and, most recently, immunoglobulins.10,11 These and other studies have described the sclera's ability to absorb and retain compounds, suggesting a potential for sustained delivery without the need for highly specialized formulations or implants. When examining the sclera in vivo, however, it becomes clear that its ability to absorb, retain, and release drugs is heavily influenced by normal physiologic factors not reproducible in vitro. These factors can be classified as static (barrier functions of the choroid, Bruch's membrane, and RPE) or dynamic (loss of drug from the eye via bulk flow or blood, lymph or aqueous humor flow), and their combined effects prevent the ocular penetration of drugs that would easily move across isolated sclera.12,13 An overview of these barriers, as well as plausible strategies for overcoming them, can be found in a recent review by Edelhauser et al.5 In addition, injection-related factors such as the volume of drug solution injected into the sub-Tenon space can have a profound effect on tissue drug levels.14
Ocular fluorophotometry was developed during the 1980s to identify preclinical changes in the blood–retinal barrier of diabetic patients. In contrast to bench-top spectrofluorometry, both excitation and detection mechanisms share a single, mobile optical element, which allows for continuous fluorescence measurements along a straight line extending from the center of the cornea to the center of the posterior pole. Although fluorescein angiography became the preferred modality for assessing the retinal vasculature, fluorophotometry proved useful in the characterization of tear turnover, aqueous turnover, and early cataract formation.15,16 More recently, fluorophotometry has been used to evaluate the transscleral delivery of small molecules in a rabbit model.14,17
Traditional in vivo pharmacokinetic experiments have involved killing several animals at predetermined time points and determining drug levels in the tissue. This technique requires the use of a large number of animals to characterize the change in drug levels over time. It is also susceptible to the changes in drug location and concentration that most likely occur during tissue harvesting and subsequent manipulation. Fluorophotometry offers a noninvasive alternative for monitoring intraocular drug concentrations in vivo, providing a longitudinal view of drug behavior within a single animal. In rabbit studies, fluorophotometry scans can be obtained without the need for anesthesia or active restraint. The eye is not manipulated during the measurement, thus allowing normal physiologic conditions (blood and aqueous flow) to remain unaltered.
Fluorescein and fluorescein-conjugated compounds are a logical choice for in vivo fluorophotometry studies because of their intense fluorescence, favorable safety profile, and stable molecular bonding.18,19 We selected fluoresceinated dextrans in particular for this study because of their high solubility and stability in aqueous solution, as well as customizable molecular weight. With the use of fluoresceinated dextrans of various molecular weights, the effect of molecular size and weight on transscleral diffusion can be characterized while keeping other molecular parameters constant.
The purpose of this study was to deliver fluoresceinated dextrans, with molecular mass up to 70 kDa, to the posterior retina and choroid using sub-Tenon injections, and to characterize the intraocular movement of the dextrans using in vivo ocular fluorophotometry.
Materials and Methods
Injected Material
FITC is a fluorescein derivative commonly used to add fluorescence to proteins, but it can also be added to nonprotein compounds. Dextran is a linear, branching polysaccharide made of glucose monomers that can be manufactured to various specific molecular masses. FITC-labeled Dextran with average molecular masses of 40- and 70-kDa were obtained from Sigma-Aldrich (St. Louis, MO); previous ex vivo experiments by Olsen et al.10 have shown that both molecules can cross the human sclera. A well-studied, low-molecular-weight molecule (NaF, MW 376.3) was also included for comparison.
FITC-D injections were prepared by dissolving 25 mg of the dehydrated powder in 1 mL sterile balance salt solution (BSS, Alcon Laboratories, Fort Worth, TX). Per manufacturer specifications, the percent substitution of FITC in both FITC-D compounds was estimated at 0.08 moles FITC per mole glucose. A 2-mg/mL solution of sodium fluorescein in balanced salt solution was made to approximately match the molar concentration of fluorescein in the dextran solutions.
Injection Technique
All animals were treated in accordance with the ARVO Statement for the Use of Animals in Ophthalmic and Vision Research. Anesthesia was achieved with an intramuscular injection of xylazine (6 mg/kg) and ketamine (35 mg/kg). Groups of three rabbits each received an injection of 200 μL NaF, 40-kDa FITC-D, or 70-kDa FITC-D solution in the sub-Tenon space of the right eye. Injections were performed with a 1-mL syringe and 30-gauge needle, entering the sub-Tenon space at the superior temporal quadrant approximately 8 mm from the limbus. The injection was performed once the tip of the needle reached beyond the equator of the eye, and a localized ballooning of Tenon's capsule was confirmed in all cases before proceeding with fluorophotometry.
Fluorophotometry
A fluorophotometer (Fluorotron Master; OcuMetrics, Mountain View, CA) was used for all experiments. Fluorophotometry uses a single-lens system to illuminate a narrow slit of blue light into the eye, although a small aperture and emission filter are used to detect any fluorescence emanating from the sample. The narrow excitation and emission “beams” intersect in a diamond-shaped area less than 1 mm in depth; the resulting fluorescence value represents the fluorescence within this small region. During the course of a fluorophotometry reading, the diamond-shaped detection region travels from a few millimeters behind the sclera to a few millimeters in front of the cornea and tear film. Values are recorded and as sodium fluorescein concentration levels (nanograms per milliliter) for each of 154 locations, 0.25 mm apart, along the eye's central visual axis.
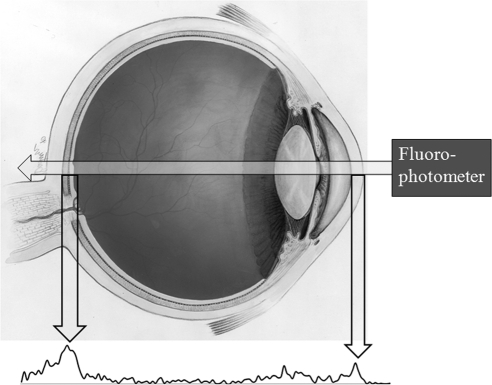
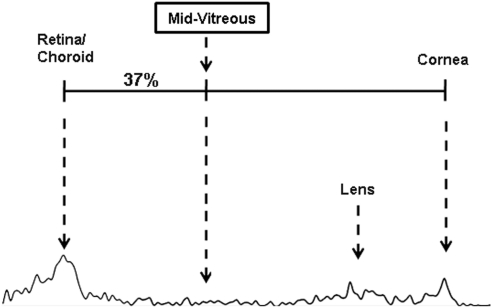
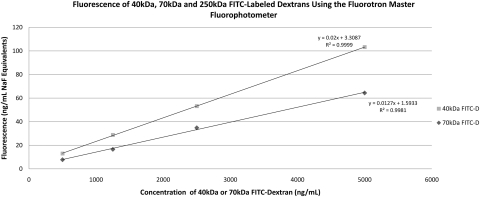
Representative fluorophotometry scans are shown in Figures 1 and 2. The retina/choroid value was identified as the most prominent posterior peak, and the cornea value was identified in each scan as the prominent anterior peak. Based on previous studies by McCarey et al. (IOVS 1998;39:ARVO Abstract 1259), the mid-vitreous value was determined to be the reading located 37% of the distance (posterior to anterior) between the choroid/retina and cornea peaks (Fig. 2). To detect possible differences in fluorescence between the dextrans, we examined serial dilutions of each FITC-D solution, resulting in the calibration curves in Figure 3.
Figure 1.
Diagram of human eye with representative fluorophotometry reading. The two prominent peaks correspond to the retina/choroid (posterior peak, left) and cornea (anterior peak, right).
Figure 2.
The determination of mid-vitreous fluorescence, on the basis of the distance between the retina/choroid and cornea peaks. Use of these peaks as references helps control for variation in axial length among individual animals or species.
Figure 3.
Calibration curves for 40- and 70-kDa fluoresceinated dextran dissolved in balanced salt solution. All measurements were taken with a fluorophotometer (Fluorotron Master; Oculometrics, Mountain View, CA), with a cuvette adapter.
Euthanatized Experiments
To eliminate the effects of intra- and periocular blood and lymph flow, we euthanatized nine rabbits immediately after the sub-Tenon injection. Robinson et al.12 have shown that triamcinolone acetonide (TA; molecular weight, 434) cannot be detected within the rabbit vitreous in rabbits that were killed 3 hours after a 10-mg sub-Tenon injection. However, when the sub-Tenon injection was immediately followed by euthanatization or the dose of TA was doubled to 20 mg, detectable levels of TA were found in the vitreous 3 hours after injection. We hypothesized that, after sub-Tenon injection and immediate euthanatization, levels of all three fluorescent molecules in the mid-vitreous would be higher than in the corresponding live experiments.
Rabbits were euthanatized with an intravenous pentobarbital overdose (780 mg, via a marginal ear vein) immediately after the sub-Tenon injection. The corneas were kept moist with balanced salt solution, and the eyelids were taped closed between hourly readings. In all rabbits, fluorophotometry was performed before sub-Tenon injection, at 10 minutes, and hourly through 6 hours after injection. All fluorophotometry readings were performed in triplicate by the same investigators (DB and SP) and then averaged.
Live Experiments
To characterize the in vivo transscleral delivery of FITC-D to the rabbit posterior segment, we administered sub-Tenon injections to a group of animals without subsequent euthanatization. In the presence of normal blood and lymph flow, we hypothesized that levels of all three molecules would be lower than in the euthanatized animals.
Nine rabbits were anesthetized by using the ketamine-xylazine protocol described above and subsequently received unilateral sub-Tenon injections of NaF and 40- or 70-kDa FITC-D. The opposite, noninjected eye was measured to assess systemic absorption and recirculation of fluorescent material. Measurements were taken in both eyes before sub-Tenon injection, after 10 minutes, and at 4, 24, 48, and 72 hours.
Results
All sub-Tenon injections were well tolerated and without complications related to injection, anesthesia or fluorophotometry. The fluorophotometer reports fluorescence by first converting it to an equivalent sodium fluorescein (NaF Eq) concentration; the results below are presented in nanograms per milliliter for NaF experiments and nanograms per milliliter NaF equivalent for the FITC-D experiments.
Euthanatized Animals
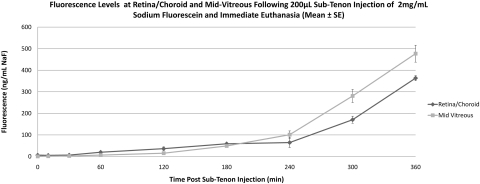
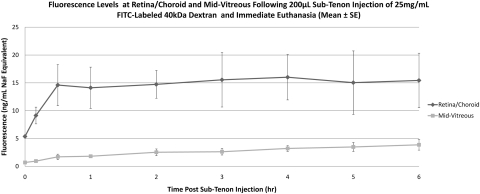
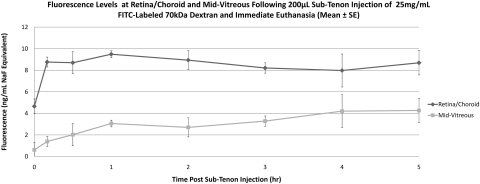
Eyes that received sub-Tenon NaF (Table 1, Fig. 4) showed an increase in retina/choroid fluorescence within 1 hour of injection (baseline, 6.4 ± 1.9 ng/mL, 1 hour 19.8 ± 2.0 ng/mL), and levels continued to increase through 6 hours (363.5 ± 11.6 ng/mL). A similar pattern was observed in the mid-vitreous, with increasing fluorescence starting within 1 hour of injection and a continuous increase through 6 hours (477 ± 39.2 ng/mL). Starting at 4 hours after injection, mid-vitreous levels surpassed those in the retina/choroid. In eyes injected with 40-kDa FITC-D (Table 1, Fig. 5), a very small increase in retina/choroid fluorescence was observed within 10 minutes of injection and euthanatization (baseline, 5.4 ± 0.5 ng/mL NaF Eq, 10 minutes, 9.1 ± 2.6 ng/mL NaF Eq), with a slow upward drift through 6 hours. Although mid-vitreous fluorescence remained near the lower limit of detection in these eyes, there was also a slow upward drift through 6 hours (6 hours, 15.4 ± 8.5 ng/mL NaF Eq). Eyes injected with 70-kDa FITC-D (Table 1, Fig. 6) showed a similar, although slightly smaller, increase in retina/choroid fluorescence immediately after injection (baseline, 4.7 ± 1.2 ng/mL NaF Eq, 10 minutes, 8.8 ± 0.8 ng/mL NaF Eq), with a subsequent plateau through 5 hours. Mid-vitreous values mirrored those of the smaller dextran, with values near the lower detection limit and a slight upward trend. Because of a loss in corneal transparency past the 5-hour time point in two rabbits, 6-hour data are not shown for this group of animals.
Table 1.
Fluorescence Levels in Retina/Choroid and Mid-vitreous after Sub-Tenon Injection with Immediate Euthanatization
| Baseline | 10 Minutes | 1 Hour | 2 Hours | 3 Hours | 4 Hours | 5 Hours | 6 Hours | |
|---|---|---|---|---|---|---|---|---|
| NaF (n = 3) | ||||||||
| Retina/choroid/sclera | 6.40 ± 1.93 | 5.35 ± 0.67 | 19.78 ± 1.97 | 36.28 ± 8.46 | 58.85 ± 3.60 | 64.62 ± 22.32 | 170.59 ± 16.47 | 363.47 ± 11.57 |
| Mid-vitreous | 0.39 ± 0.26 | 1.14 ± 0.77 | 6.55 ± 0.92 | 15.22 ± 4.37 | 48.77 ± 1.68 | 101.08 ± 17.58 | 280.80 ± 30.44 | 477.02 ± 39.21 |
| 40 kDa FITC-D (n = 3) | ||||||||
| Retina/choroid/sclera | 5.37 ± 0.47 | 9.13 ± 2.61 | 14.12 ± 6.44 | 14.73 ± 4.33 | 15.55 ± 8.46 | 16.01 ± 7.06 | 15.04 ± 9.88 | 15.44 ± 8.48 |
| Mid-vitreous | 0.69 ± 0.14 | 0.95 ± 0.35 | 1.82 ± 0.53 | 2.53 ± 1.03 | 2.63 ± 1.01 | 3.22 ± 0.90 | 3.48 ± 1.39 | 3.87 ± 1.65 |
| 70 kDa FITC-D (n = 3) | ||||||||
| Retina/choroid/sclera | 4.65 ± 1.19 | 8.77 ± 0.8 | 9.49 ± 0.54 | 8.94 ± 1.54 | 8.21 ± 0.82 | 7.98 ± 2.65 | 8.69 ± 1.95 | N/A |
| Mid-vitreous | 0.61 ± 0.41 | 1.39 ± 0.6 | 3.06 ± 0.9 | 2.70 ± 1.31 | 3.28 ± 0.79 | 4.21 ± 1.85 | 4.27 ± 0.99 | N/A |
Mean ± standard deviation (in ng/mL NaF equivalents).
Figure 4.
Mean fluorescence at retina/choroid and mid-vitreous after sub-Tenon injection of NaF and immediate euthanatization. Values are expressed as the mean NaF ± SE.
Figure 5.
Mean fluorescence at retina/choroid and mid-vitreous after sub-Tenon injection of 40-kDa FITC-D and immediate euthanatization. Data are expressed as the mean NaF Eq ± SE.
Figure 6.
Mean fluorescence at retina/choroid and mid-vitreous after sub-Tenon injection of 70-kDa FITC-D and immediate euthanatization. Data are expressed as the mean NaF equivalent ± SE.
Live Animals
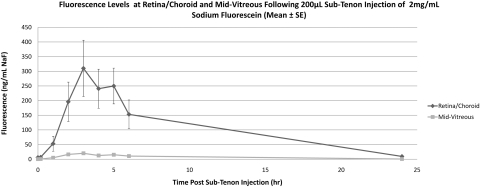
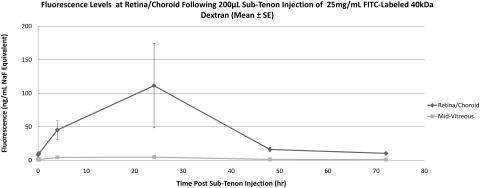
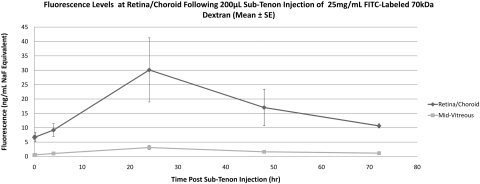
Noninjected (control) eyes remained at baseline fluorescence in all rabbits. NaF-injected eyes (Table 2, Fig. 7) exhibited an increase in retina/choroid fluorescence beginning 1 hour after injection (baseline, 6.1 ± 1.6 ng/mL, 1 hour, 52.9 ± 76.7 ng/mL), reached peak fluorescence at 3 hours (310.2 ± 287.4 ng/mL), and returned to baseline levels by 24 hours (9.6 ± 6.6 ng/mL). Mid-vitreous fluorescence remained far below that of the retina/choroid at all time points, showing a similar pattern with a peak at 3 hours (20.3 ± 13.0 ng/mL). Eyes injected with 40-kDa FITC-D (Table 2, Fig. 8) showed an increase in retina/choroid fluorescence 4 hours after injection (baseline, 8.4 ± 6.4 ng/mL NaF Eq, 4 hours 45.2 ± 23.9 ng/mL NaF Eq), with a peak at 24 hours (111.5 ± 109.1 ng/mL NaF Eq) and a return to baseline by 48 hours. The 70-kDa FITC-D-injected eyes (Table 2, Fig. 9) showed an increase in fluorescence 24 hours after injection (baseline, 6.7 ± 1.4 ng/mL NaF Eq; 24 hours 30.1 ± 19.3 ng/mL NaF Eq), returning to near-baseline fluorescence by 72 hours (10.7 ± 1.3 ng/mL NaF Eq). Adjusted using the calibration data in Figure 3, the peak 40- and 70-kDa FITC-D concentrations were 5409.6 and 2375.6 ng/mL, respectively. Both peak readings occurred 24 hours after injection. Mid-vitreous fluorescence remained near the lower limit of detection in both FITC-D groups, although a very small increase was detected 24 to 48 hours after injection.
Table 2.
Fluorescence Levels in Retina/Choroid and Mid-vitreous after Sub-Tenon Injection in Live Animals
| Baseline | 10 Minutes | 1 Hour | 2 Hours | 3 Hours | 4 Hours | 5 Hours | 6 Hours | 24 Hours | |
|---|---|---|---|---|---|---|---|---|---|
| NaF (n = 3) | |||||||||
| Retina/choroid/sclera | 6.11 ± 1.60 | 6.88 ± 1.57 | 52.90 ± 76.75 | 196.13 ± 201.21 | 310.19 ± 287.43 | 240.72 ± 199.70 | 249.91 ± 183.34 | 153.04 ± 147.76 | 9.57 ± 6.62 |
| Mid-vitreous | 0.42 ± 0.17 | 0.71 ± 0.33 | 5.06 ± 5.85 | 16.37 ± 9.50 | 20.28 ± 12.97 | 12.66 ± 4.87 | 15.32 ± 11.38 | 10.71 ± 7.16 | 0.72 ± 0.20 |
| Baseline | 10 Minutes | 4 Hours | 24 Hours | 48 Hours | 72 Hours | ||||
|---|---|---|---|---|---|---|---|---|---|
| 40-kDa FITC-D (n = 3) | |||||||||
| Retina/choroid/sclera | 8.39 ± 6.41 | 10.04 ± 4.61 | 45.20 ± 23.86 | 111.47 ± 109.14 | 16.12 ± 5.63 | 10.35 ± 2.67 | |||
| Mid-vitreous | 0.76 ± 0.45 | 1.08 ± 0.70 | 4.38 ± 2.12 | 4.74 ± 2.84 | 1.2658 ± 0.56 | 1.03 ± 0.54 | |||
| 70-kDa FITC-D (n = 3) | |||||||||
| Retina/choroid/sclera | 6.67 ± 1.35 | 6.76 ± 2.78 | 9.18 ± 3.91 | 30.10 ± 19.29 | 17.04 ± 10.88 | 10.66 ± 1.26 | |||
| Mid-vitreous | 0.50 ± 0.20 | 0.57 ± 0.22 | 1.05 ± 0.59 | 3.11 ± 1.16 | 1.63 ± 0.61 | 1.17 ± 0.42 |
Mean ng/mL ± SD (NaF equivalents).
Figure 7.
Mean fluorescence at retina/choroid and mid-vitreous after sub-Tenon injection of NaF in live animals. Data are expressed as the mean NaF ± SE.
Figure 8.
Mean fluorescence at retina/choroid and mid-vitreous after sub-Tenon injection of 40-kDa FITC-D in live animals. Data are expressed as the mean NaF Eq ± SE.
Figure 9.
Mean fluorescence at retina/choroid and mid-vitreous after sub-Tenon injection of 70-kDa FITC-D in live animals. Data are expressed as the mean NaF Eq ± SE.
Discussion
Fluorophotometry has the unique ability to quantify fluorescence levels along the entire central visual axis of an undisturbed, living eye. It can be used to characterize the intraocular levels of a fluorescent compound administered through topical drops, peri- and intraocular injection, or systemic methods. Although limited to 1-dimensional scans through the center of the eye, its high sensitivity and rapid (20-second) scan time make fluorophotometry a powerful technique for in vivo studies. Computer-assisted imaging techniques such as MRI can provide 3-dimensional images of in vivo eyes, but they have limited sensitivity and resolution, as well as long imaging times and a need for extended or repeated anesthesia.20,21
Fluorophotometry's high sensitivity provides valuable data on in vivo tissue penetration of fluorescent drugs, but discerning specific fluorescence levels within the thin, adjacent tissues of the posterior segment remains a challenge. In rabbit as well as human subjects, the diamond-shaped detection region of the fluorophotometer is likely to sense fluorescence from retina and choroid simultaneously. For this reason, we chose to use the combined term retina/choroid when referring to the posterior fluorescence peak (Figs. 1, 2). The sclera is not expected to contribute to this peak because of its opacity, although some contribution from its innermost surface is possible. There are additional challenges when determining the vitreous level of a given fluorescent drug. The relatively low levels of drug in the mid-vitreous, in the setting of high levels in the retina/choroid immediately behind it, result in a “tailing” effect,22 described as the tendency of highly fluorescent structures to influence the fluorescence of the areas immediately adjacent to them. It is most likely related to the diamond shape of the fluorophotometer's reading region, as well as the reflective nature of the retina. Despite these limitations, however, we were able to successfully characterize and compare the transscleral delivery of three fluorescent compounds in living rabbit eyes.
This study shows that it is possible to deliver sodium fluorescein and fluoresceinated dextrans, weighing up to 70 kDa, to the rabbit retina/choroid using sub-Tenon injections. In a previous fluorophotometry study using sub-Tenon NaF, Ghate et al.14 noted a peak in retina/choroid fluorescence 2 hours after injection, along with a small increase in fluorescence in the noninjected eyes. The present study showed a slightly later increase in retina/choroid fluorescence (3 hours after injection), without a measurable rise in contralateral eye fluorescence. These differences are most likely related to the lower dose of fluorescein used in our experiments (0.4 mg vs. 2.5 mg). In another fluorophotometry study by Lee et al.,17 Oregon green–labeled triamcinolone acetonide (OGTA, 828.79) was successfully delivered via sub-Tenon injection, reaching a maximum retina/choroid concentration 3 hours after injection.17 In that study, injected eyes returned to baseline fluorescence within 24 hours of the 1-mg dose of sub-Tenon OGTA; no increase in fluorescence was detected in the contralateral noninjected eyes. In our experiments, NaF behaved in a manner similar to the small labeled steroid. Because fluorescence in noninjected eyes remained at baseline in our experiments, direct transscleral diffusion (not systemic absorption and recirculation) is the likely route by which NaF reached the retina/choroid.
The relative ease with which the small, hydrophilic NaF molecule can diffuse across the sclera was apparent in both living and euthanatized rabbits and is consistent with results from previous transscleral studies involving small molecules. A rapid increase in retina/choroid fluorescence was observed in both living and euthanatized animals, with a rapid return to baseline values in the live group. In the case of 40- and 70-kDa FITC-D, peak fluorescence was much lower despite the large doses injected. A low concentration of a high-molecular-mass compound, however, does not preclude an important biological effect. For instance, the minimum concentration of ranibizumab (48 kDa) required to inhibit VEGF activity in vitro has been found to be approximately 120 ng/mL.23 In this study, a 5 mg dose of 70-kDa FITC-D placed outside the sclera resulted in an approximate retina/choroid concentration of 2600 ng/mL 24 hours after injection. The calculation is based on fluorescence measured at the posterior pole of the eye; retina/choroid levels are likely to be higher near the injection site. These findings suggest that sub-Tenon injections of even high-molecular-weight compounds may yield therapeutic levels within the retina/choroid.
The barrier function of intra- and periocular vessels in the setting of transscleral drug diffusion has been studied. Rabbit experiments by Robinson et al.12 have shown that episcleral vessels present a major barrier to transscleral diffusion, with choroidal circulation contributing to a lesser extent. That study involved a relatively short (3-hour) follow-up period before euthanatization and enucleation. In our live experiments using FITC-D, increases in retina/choroid fluorescence were observed 4 (40-kDa) and 24 (70-kDa) hours after injection. These findings suggest that, despite the major barriers presented by ocular blood and lymph flow, a high-molecular-mass compound can reach the posterior retina/choroid via transscleral diffusion.
When the behavior of NaF and FITC-D in live and euthanatized animals are compared, there appears to be a route or mechanism, not present in the euthanatized animal that allows molecules to move from the site of injection (near the equator of the eye) toward the central posterior retina/choroid. This phenomenon can be appreciated by comparing the retina/choroid fluorescence of live and euthanatized animals 2 hours (NaF) and 4 hours (40-kDa FITC-D) after injection. Despite the clearance functions of blood and lymph flow in living eyes, retina/choroid fluorescence in live rabbit eyes was higher than in the eyes of euthanatized rabbits. One plausible contributor to this process is the uveoscleral outflow pathway, a previously described pathway that allows aqueous humor to exit the anterior chamber, through the ciliary body, and into the suprachoroidal space.24 NaF and FITC-D molecules may follow this fluid movement posteriorly and, in this way, reach the posterior retina/choroid. Further experimentation with 2-dimensional imaging techniques would help in characterizing the mechanism behind these observations.
As expected based on previous in vitro experiments, the two dextran varieties did not reach the posterior retina/choroid equally. When adjusted for the difference in inherent fluorescence (Fig. 3), the smaller 40-kDa dextran reached a peak concentration 2.3 times higher than its 70-kDa counterpart. In addition, the smaller dextran exhibited slightly faster clearance from the tissues, evidenced by a faster return to baseline fluorescence. Previous in vitro studies have established molecular radius as a major determinant of transscleral diffusion.25,26 The molecular radii of 40- and 70-kDa FITC-D have been estimated at 4.5 and 6.4 nm, respectively.11 Our in vivo findings suggest that high-molecular-weight compounds reach their target tissues at lower concentrations, but appear to stay within the tissue for a longer period. Given the sclera's ultrastructure, which features overlapping bundles of collagen fibers with interspaces that vary in diameter, the slower movement of high-molecular-weight molecules is not surprising.27 Our findings are also in agreement with previously published ex vivo transscleral diffusion coefficients for 40- and 70-kDa FITC-D, with the smaller dextran crossing the sclera approximately twice as easily (diffusion coefficients 2.79 ± 1.58 × 10⁻⁶ and 1.39 ± 0.88 × 10⁻⁶ cm/s, respectively).11
Sub-Tenon injections were used in this study because of their safety and simplicity; however, preliminary studies have shown that biocompatible, unidirectional implants can increase transscleral delivery and minimize systemic absorption.28 Combined with sustained-release formulations, transscleral delivery devices could provide significantly higher tissue concentrations and longer half-lives than those observed in the present study. Transscleral TA (MW 434) has been used with success in uveitis and macular edema29,30 and is a logical candidate for delivery with a sustained-release transscleral device. Given our findings with 40- and 70-kDa dextrans, however, higher molecular weight therapeutics should also be given consideration. Clinically relevant drugs such as ranibizumab (48-kDa) can be found within the 40- to 70-kDa size range, and recent work using bevacizumab (140-kDa) has shown that it is also able to cross the human sclera in an in vitro model. (Kim ES, et al. IOVS 2009;50:ARVO E-Abstract 5988). As research continues in the area of protein and nucleotide-based therapeutics, the resulting agents are likely to be effective but high in molecular mass.
In summary, the present study demonstrates that fluorescein-labeled dextrans weighing 40 and 70 kDa can be delivered to the rabbit posterior retina/choroid with sub-Tenon injections. It also highlights the strengths of ocular fluorophotometry in live animal studies of drug delivery, offering high-sensitivity scans quickly and without the need for anesthesia or euthanatization.
Footnotes
Supported in part by National Eye Institute Grants R24 EY017404, T32 EY07092, and P30 EY006360 and an unrestricted grant from Research to Prevent Blindness.
Disclosure: D.E. Berezovsky, None, S.R. Patel, None; B.E. McCarey, None; H.F. Edelhauser, None
References
- 1. Michels S, Schmidt-Erfurth U, Rosenfeld PJ. Promising new treatments for neovascular age-related macular degeneration. Expert Opin Investig Drugs. 2006;15(7):779–793, 2006 [DOI] [PubMed] [Google Scholar]
- 2. Rosenfeld PJ, Brown DM, Heier JS, et al. Ranibizumab for neovascular age-related macular degeneration. N Engl J Med. 2006;355(14):1419–1431 [DOI] [PubMed] [Google Scholar]
- 3. Brown DM, Kaiser PK, Michels M, et al. Ranibizumab versus verteporfin for neovascular age-related macular degeneration. N Engl J Med. 2006;355(14):1432–1444 [DOI] [PubMed] [Google Scholar]
- 4. Klein KS, Walsh MK, Hassan TS, et al. Endophthalmitis after anti-VEGF injections. Ophthalmology. 2009;116(6):1225, e1221 [DOI] [PubMed] [Google Scholar]
- 5. Edelhauser HF, Rowe-Rendleman CL, Robinson MR, et al. Ophthalmic drug delivery systems for the treatment of retinal diseases: basic research to clinical applications. Invest Ophthalmol Vis Sci. 2010;51(11):5403–5420 [DOI] [PMC free article] [PubMed] [Google Scholar]
- 6. Montero JA, Ruiz-Moreno JM. Intravitreal inserts of steroids to treat diabetic macular edema. Curr Diabetes Rev. 2009;5(1):26–32 [DOI] [PubMed] [Google Scholar]
- 7. Kane FE, Burdan J, Cutino A, Green KE. Iluvien: a new sustained delivery technology for posterior eye disease. Expert Opin Drug Deliv. 2008;5(9):1039–1046 [DOI] [PubMed] [Google Scholar]
- 8. Bourges JL, Bloquel C, Thomas A, et al. Intraocular implants for extended drug delivery: therapeutic applications. Adv Drug Deliv Rev. 2006;58(11):1182–1202 [DOI] [PubMed] [Google Scholar]
- 9. Lee SS, Ghosn C, Yu Z, et al. Vitreous VEGF clearance is increased aater vitrectomy. Invest Ophthalmol Vis Sci. 2010;51:2135–2138 [DOI] [PubMed] [Google Scholar]
- 10. Olsen TW, Edelhauser HF, Lim JI, Geroski DH. Human scleral permeability: effects of age, cryotherapy, transscleral diode laser, and surgical thinning. Invest Ophthalmol Vis Sci. 1995;36(9):1893–1903 [PubMed] [Google Scholar]
- 11. Ambati J, Canakis CS, Miller JW, et al. Diffusion of high molecular weight compounds through sclera. Invest Ophthalmol Vis Sci. 2000;41(5):1181–1185 [PubMed] [Google Scholar]
- 12. Robinson MR, Lee SS, Kim H, et al. A rabbit model for assessing the ocular barriers to the transscleral delivery of triamcinolone acetonide. Exp Eye Res. 2009;82(3):479–487 [DOI] [PubMed] [Google Scholar]
- 13. Pitkanen L, Ranta VP, Moilanen H, Urtti A. Permeability of retinal pigment epithelium: effects of permeant molecular weight and lipophilicity. Invest Ophthalmol Vis Sci. 2005;46(2):641–646 [DOI] [PubMed] [Google Scholar]
- 14. Ghate D, Brooks W, McCarey BE, Edelhauser HF. Pharmacokinetics of intraocular drug delivery by periocular injections using ocular fluorophotometry. Invest Ophthalmol Vis Sci. 2007;48(5):2230–2237 [DOI] [PubMed] [Google Scholar]
- 15. Blair NP, Zeimer RC, Rusin MM, Cunha-Vaz JG. Outward transport of fluorescein from the vitreous in normal human subjects. Arch Ophthalmol. 1983;101(7):1117–1121 [DOI] [PubMed] [Google Scholar]
- 16. Raines MF. Vitreous fluorophotometry: a review. J R Soc Med. 1988;81(7):403–406 [DOI] [PMC free article] [PubMed] [Google Scholar]
- 17. Lee SJ, Kim ES, Geroski DH, McCarey BE, Edelhauser HF. Pharmacokinetics of intraocular drug delivery of Oregon green 488–labeled triamcinolone by subtenon injection using ocular fluorophotometry in rabbit eyes. Invest Ophthalmol Vis Sci. 2008;49(10):4506–4514 [DOI] [PubMed] [Google Scholar]
- 18. Wallace MB, Meining A, Canto MI, et al. The safety of intravenous fluorescein for confocal laser endomicroscopy in the gastrointestinal tract. Aliment Pharmacol Ther. 2010;31(5):548–552 [DOI] [PubMed] [Google Scholar]
- 19. Das T, Vedantham V. Intravitreal sodium fluorescein enhances visualization of clear vitreous during vitreous surgery for macular hole: a safety and efficacy study. Clin Exp Ophthalmol. 2004;32(1):55–57 [DOI] [PubMed] [Google Scholar]
- 20. Li SK, Lizak MJ, Jeong EK. MRI in ocular drug delivery. NMR Biomed. 2008;21(9):941–956 [DOI] [PMC free article] [PubMed] [Google Scholar]
- 21. Kim H, Robinson MR, Lizak MJ, et al. Controlled drug release from an ocular implant: an evaluation using dynamic three-dimensional magnetic resonance imaging. Invest Ophthalmol Vis Sci. 2004;45(8):2722–2731 [DOI] [PubMed] [Google Scholar]
- 22. Zeimer RC, Cunha-Vaz JG, Johnson ME. Studies on the technique of vitreous fluorophotometry. Invest Ophthalmol Vis Sci. 1982;22(5):668–674 [PubMed] [Google Scholar]
- 23. Klettner A, Roider J. Comparison of bevacizumab, ranibizumab, and pegaptanib in vitro: efficiency and possible additional pathways. Invest Ophthalmol Vis Sci. 2008;49(10):4523–4527 [DOI] [PubMed] [Google Scholar]
- 24. Alm A, Nilsson SF. Uveoscleral outflow: a review. Exp Eye Res. 2009;88(4):760–768 [DOI] [PubMed] [Google Scholar]
- 25. Prausnitz MR, Noonan JS. Permeability of cornea, sclera, and conjunctiva: a literature analysis for drug delivery to the eye. J Pharm Sci. 1998;87(12):1479–1488 [DOI] [PubMed] [Google Scholar]
- 26. Ranta VP, Urtti A. Transscleral drug delivery to the posterior eye: prospects of pharmacokinetic modeling. Adv Drug Deliv Rev. 2006;58(11):1164–1181 [DOI] [PubMed] [Google Scholar]
- 27. Thale A, Tillmann B. The collagen architecture of the sclera: SEM and immunohistochemical studies. Ann Anat. 1993;175(3):215–220 [DOI] [PubMed] [Google Scholar]
- 28. Pontes de Carvalho RA, Krausse ML, et al. Delivery from episcleral exoplants. Invest Ophthalmol Vis Sci. 2006;47(10):4532–4539 [DOI] [PubMed] [Google Scholar]
- 29. Shen L, You Y, Sun S, Chen Y, Qu J, Cheng L. Intraocular and systemic pharmacokinetics of triamcinolone acetonide after a single 40-mg posterior subtenon application. Ophthalmology. 2010;117(12):2365–2371 [DOI] [PubMed] [Google Scholar]
- 30. Cardillo JA, Melo LA, Jr, Costa RA, et al. Comparison of intravitreal versus posterior sub-Tenon's capsule injection of triamcinolone acetonide for diffuse diabetic macular edema. Ophthalmology. 2005;112(9):1557–1563 [DOI] [PubMed] [Google Scholar]


