Hypodense regions (holes) are seen in the retinal nerve fiber layer of patients with glaucomatous optic neuropathy. These holes can occur in the eyes of glaucoma suspects with normal visual fields and are probably due to local axon loss.
Abstract
Purpose.
To better understand hypodense regions (holes) that appear in the retinal nerve fiber layer (RNFL) of frequency-domain optical coherence tomography (fdOCT) scans of patients with glaucoma and glaucoma suspects.
Methods.
Peripapillary circle (1.7-mm radius) and cube optic disc fdOCT scans were obtained on 208 eyes from 110 patients (57.4 ± 13.2 years) with glaucomatous optic neuropathy (GON) and 45 eyes of 45 controls (48.0 ± 12.6 years) with normal results of fundus examination. Holes in the RNFL were identified independently by two observers on the circle scans.
Results.
Holes were found in 33 (16%) eyes of 28 (25%) patients; they were not found in any of the control eyes. Twenty-four eyes had more than one hole. Although some holes were relatively large, others were small. In general, the holes were located adjacent to blood vessels; only three eyes had isolated holes that were not adjacent to a vessel. The holes tended to be in the regions that are thickest in healthy controls and were associated with arcuate defects in patients. Holes were not seen in the center of the temporal disc region. They were more common in the superior (25 eyes) than in the inferior (15 eyes) disc. Of the 30 eyes with holes with reliable visual fields, seven were glaucoma suspect eyes with normal visual fields.
Conclusions.
The holes in the RNFL seen in patients with GON were probably due to a local loss of RNFL fibers and can occur in the eyes of glaucoma suspects with normal visual fields.
Glaucoma damages retinal ganglion cells (RGC) and their axons. This loss of RGC axons leads to thinning of the peripapillary retinal nerve fiber layer (RNFL) and to characteristic optic disc changes. Optical coherence tomography (OCT) permits in vivo imaging of the peripapillary RNFL; the recently improved resolution of frequency domain (fd) OCT allows imaging of the macular RGC layer as well.
Numerous fdOCT studies of glaucoma patients have documented thinning of the RNFL (see Refs. 1, 2 for review) and, more recently, of the RGC layer.3–6 Many of these studies have suggested ways to calculate the thickness of one or more layers of the fdOCT scan so as to improve the sensitivity and specificity of tests for glaucomatous damage. Because fdOCT is still a relatively new technique, additional information may be revealed in these scans that might improve our understanding of glaucomatous damage.
We have observed hypodense regions (holes) in the RNFL of some patients with glaucomatous optic neuropathy (GON). Our purpose was to better understand the prevalence and location of these regions.
Methods
We examined 208 eyes of 110 patients (mean age, 57.4 ± 13.2 years) with GON and 45 eyes of 45 controls (48.0 ± 12.6 years) with normal disc examinations. Consecutive patients with GON referred for multifocal VEP testing were included if they had well-centered scans with quality scores better than 65 and little motion artifact. Written informed consent was obtained from all subjects. Procedures followed the tenets of the Declaration of Helsinki, and the protocol was approved by the Committee of the Institutional Board of Research of Columbia University.
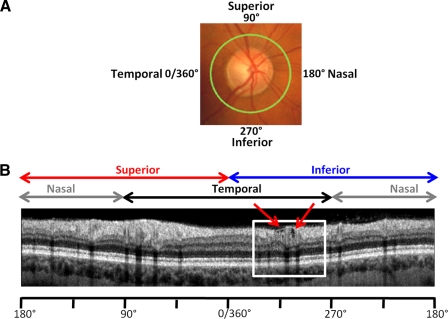
Peripapillary circle (1.7-mm radius) and 6 mm × 6 mm cube scans of the optic disc (3D-OCT 1000 and 3D-OCT 2000; Topcon Inc, Paramus, NJ) were obtained. For the peripapillary circle scans, each of the 16 overlapping (averaged) B-scans had 1024 A-scans, whereas the cube scan had 512 A-scans for each of the 128 B-scans. Figure 1A shows the location of the circle scan for one of the patients. To identify hypodense regions (holes) in the RNFL, two of the authors examined the circle scans. When they disagreed, a third author adjudicated. The resolution of the cube scans was, of course, poorer than the resolution of the circle scans, and cube scans were only used to confirm that the holes extended beyond the circle scan image (see Fig. 3).
Figure 1.
(A) The locus of the fdOCT circle scan (green circle) is shown with a 360° scale to indicate disc location. 0° is the most temporal part of disc and occurs at 9 o'clock for a right eye and 3 o'clock for a left eye. (B) Circle scan of eye 33. White box: region with holes, enlarged in Figure 2A.
Figure 3.
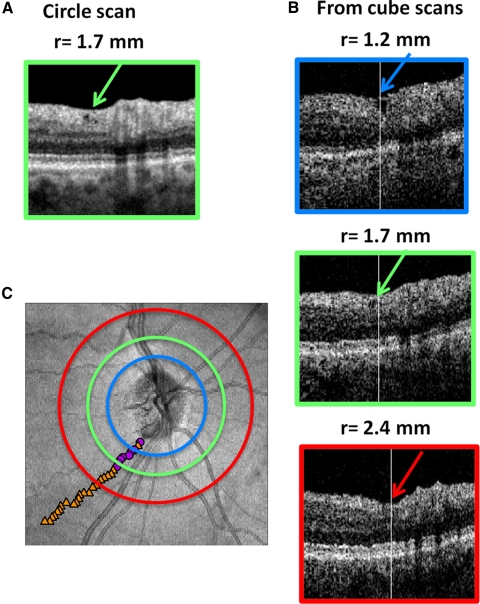
(A) Similar to Figure 2G. The region from eye 9 showing holes in RNFL on the scan. (B) Comparable region shown for circle scans derived from cube scans using radii smaller than (1.2 mm), the same size as (1.7 mm), and larger than (2.4 mm) than that used for the high-quality circle scan in A. (C) Fundus view of disc showing the location of the three circles. The center of the holes (magenta circles) or depressions (orange triangles) are indicated by the small symbols.
Results
A typical peripapillary scan is shown in Figure 1B for a right eye. A magnified view of the region within the white box is presented in Figure 2A, where blood vessels can be identified by the shadows they cast. The red ellipses show a cluster of three small holes to the left of a large blood vessel, with a larger hole falling to the right of the same vessel. Twenty-eight (25%) of the 110 patients had holes in at least one eye. Of the 208 eyes with GON, 33 (16%) had at least one hole. Holes were not found in any of the healthy control eyes.
Figure 2.
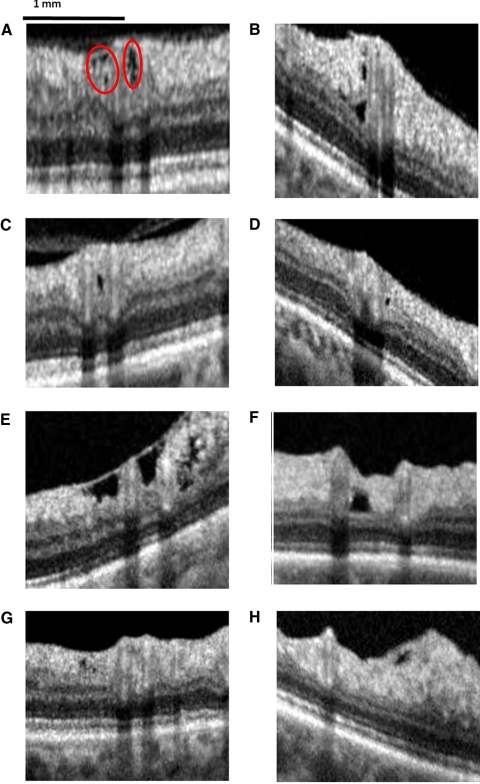
Examples of holes and clusters of holes in eight eyes: eyes 33 (A), 7 (B), 2 (C), 32 (D), 12 (E), 22 (F), 9 (G), and 18 (H).
Figure 2 shows examples of the pattern of holes seen in the RNFL. Some holes were small (Figs. 2A, 2D, 2G), and some were relatively large (Figs. 2E, 2F). In some eyes only a single hole was present in a region (Figs. 2C, 2D, 2F, 2H), whereas in others they appeared near other holes (Figs. 2A, 2B, 2E) and sometimes in clusters (Fig. 2A). Of the 33 eyes with holes, 24 had more than one hole. These holes could be near each other (Figs. 2A, 2B, 2E) or they could be in another area of the RNFL, often the other half of the RNFL.
The holes tended to occur immediately adjacent to a vessel, as shown in Figures 2A to 2F. In fact, 31 of the 33 eyes had at least one hole near a vessel. Further, only three eyes had a hole that was not immediately adjacent to a vessel; two of these are shown in Figures 2G and 2H.
Using the cube scans, it was often possible to follow the course of a hole across scan lines, confirming that the holes were not local artifacts. Figure 3 provides an example. Figure 3A (the same image as Figure 2G) is from the standard circle scan with a radius of 1.7 mm. The holes are present, although more difficult to see in the equivalent circle scan (Fig. 3B, green border) derived from the cube scan. The colored circles on the fdOCT image in Figure 3C show the locations of derived circle scans closer to (blue) and further from (red) the optic disc than the 1.7 mm scan. The equivalent portions of these derived scans are shown in Figure 3B, where a hole is present at radii of 1.2 and 1.7 mm but a depression is present at a radius of 2.4 mm. The symbols in Figure 3C mark the centers of the holes (magenta circles) and depressions (orange triangles). Note in Figure 3C that there are holes closer to the disc and a depression/thinning of the RNFL further from the disc and that together they trace a path consistent with that of an RNFL bundle.
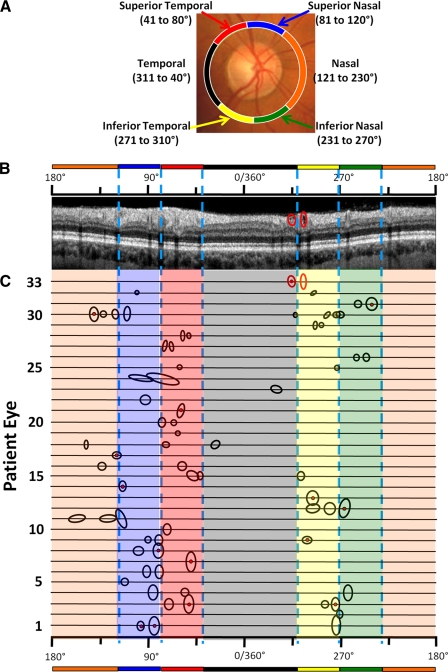
The locations of the holes in all 33 eyes are shown in Figure 4. The location, in degrees, is referenced to a 360° scale, where 0° is the most temporal point of the disc (9 o'clock for the right eye and 3 o'clock for the left). For reference, the Garway-Health et al.7 disc sectors are indicated by the color bars on the 360° scale and on the fundus picture in Figure 4A. To understand how to interpret this figure, consider the scan in Figure 4B. This is the scan from eye 33 shown in Figures 1B and 2A. As in Figure 2A, one red ellipse encloses a cluster of three holes, and the other encloses an elongated hole. The locations of these holes for eye 33 are represented in Figure 4C, by the same two red ellipses. The smaller circle has a red dot in the center, indicating that more than one hole could be discerned. A similar analysis was performed for the other 32 eyes, and the results were presented in the same fashion. This figure allows one to see at a glance where the holes tended to fall.
Figure 4.
Location of holes by patient. (A) Garway-Heath et al.7 disc sectors. (B) The same circle scan from eye 33 shown in Figures 1 and 2A, with the cluster of holes (left ellipse) and a single hole (right ellipse) enclosed in red ellipses. The location of these holes can be specified in terms of 360° scale and Garway-Heath et al.7 sectors, as indicated by the scales above the scan. (C) The location of holes or clusters of holes for all 33 eyes. The size of the circle/ellipse denotes the size of the hole or the region of clusters of holes. A cluster is indicated by the red dot in the center of the ellipse.
The holes tended to occur in the regions typically associated with arcuate defects in patients. Holes were not seen in the center of the temporal sector or in the inferior nasal sector of the disc. Interestingly, holes were more common in the superior (25 eyes) than the inferior (16 eyes) portions of the disc.
The holes were fairly evenly distributed across the RNFL. Twenty-two holes appeared near the vitreal border (e.g., Figs. 2A, 2E, 2H); 20 appeared deeper in the retina and close to the RNFL/RGC border (Figs. 2B, 2F); 15 were in the middle of the RNFL (Fig. 2B); and 13 extended more or less through the RNFL thickness.
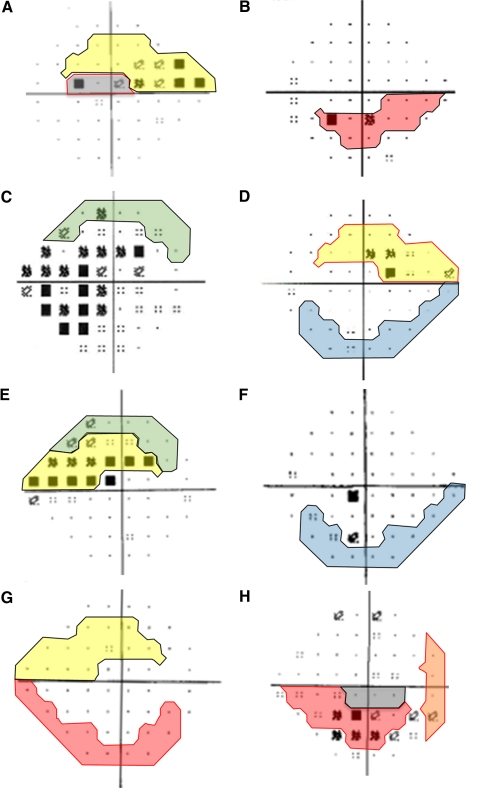
Although a comparison of OCT results with visual fields was not a primary purpose here, 30 of the 33 eyes had reliable 24–2 visual fields (Zeiss Meditec, Jena, Germany), as defined by fewer than 15% false-positive or false-negative scores, obtained within 7 months of the OCT scan. Figure 5 shows the visual fields associated with the eyes with the holes in Figure 2. The tinted portions are the visual field regions associated with the disc sectors where the holes appeared according to the Garway-Health et al.7 map. The regions bordered in black and red differentiate those regions (black) associated with the holes seen in Figure 2 from those (red) associated with holes in another part of the scan. In general, holes were associated with regions of the visual field showing abnormal points (e.g., Figs. 5A–D [upper field], 5E, 5H). On the other hand, holes also were seen in eyes (Fig. 5G) and hemifields (Fig. 5D, lower field) within normal limits. For example, the eye associated with Figure 5G had small holes (Fig. 2G) in both the superior and the inferior disc. The visual field for the eye had a mean deviation (MD) of −0.25 dB and glaucoma hemifield test (GHT) results within normal limits; there was only one abnormal (5%) point. Seven eyes had MD and GHT scores within normal limits, and another two eyes had borderline GHT and normal MD values.
Figure 5.
The 24–2 visual fields for the eyes in Figure 2 shown in corresponding panels. The shaded portion of the field is the Garway-Heath et al.7 field region associated with the disc location of the hole(s). The shaded regions with black borders correspond to the holes shown in Figure 2, and the shaded regions with red borders are associated with other holes seen on the scan from that particular eye.
In general, the eyes with holes had mild to moderate field defects. The 30 eyes with holes and visual fields within 7 months of the fdOCT scan had a median MD of −3.78 dB. Twenty-six of these eyes had MD values better than −5 dB and only one had an MD worse than −8.04 dB. More holes were seen in nine eyes with MD values within normal limits.
Discussion
On peripapillary fdOCT scans, hypodense regions, which looked like holes, were seen in the RNFL of the patients with glaucomatous optic discs. These holes were typically located adjacent to major blood vessels. We hypothesize that these holes were probably caused by local loss of RNFL fibers and that they might have been early signs of glaucomatous damage because they also occurred in eyes of glaucoma suspects with normal visual fields.
A number of findings support the first hypothesis. First, holes were not seen in the control eyes. Second, the holes were typically seen in the arcuate regions of the RNFL associated with glaucomatous damage and not in the regions (e.g., center of the temporal sector) less likely to be associated with damage. Third, when the holes were relatively large, a visual field defect was seen in the corresponding region. Finally, it is often possible to track a hole throughout the cube scan, where it follows a course consistent with an arcuate defect. These findings confirm that we were not dealing with a local phenomenon or artifact.
We do not have a satisfactory explanation for why the holes tended to appear near blood vessels. One might expect more holes near major vessels because these are also the regions where the RNFL is thickest8 and most susceptible to arcuate damage. However, this does not explain why nearly all the holes are adjacent to blood vessels because there are other thick regions of the RNFL that are not immediately adjacent to blood vessels. One possibility is that a loss of local axons may create a local mechanical force that pulls axons away from the nearest vessel. Alternatively, and probably less likely because vessels are known to constrict in patients with glaucoma,9,10 it may be the vessel itself is being pulled away from the axons. In any case, there are reasons to believe that the presence of small holes might be an early sign of glaucomatous damage to the RNFL. Again, we did not see holes in healthy controls, but we did see holes in seven eyes with normal visual fields (both MD and GHT within normal range). Further, holes were seen in eight hemifields without a cluster of abnormal points on the visual field. It remains to be seen whether the presence of holes will be clinically useful in identifying early glaucomatous damage.
Footnotes
Supported by National Eye Institute Grant R01-EY-02115; Glaucoma Research and Education Fund of Lenox Hill Hospital (CGDM); and the Gloria Rubin Research Fund of the New York Glaucoma Research Institute.
Disclosure: D. Xin, None; C.L. Talamini, None; A.S. Raza, None; C.G.V. de Moraes, None; V.C. Greenstein, None; J.M. Liebmann, Topcon, Inc (F, C); R. Ritch, None; D.C. Hood, Topcon Inc (F, C)
References
- 1. Bowd C, Zangwill LM, Medeiros FA, et al. Structure-function relationships using confocal scanning laser ophthalmoscopy, optical coherence tomography, and scanning laser polarimetry. Invest Ophthalmol Vis Sci. 2006;47:2889–2895 [DOI] [PubMed] [Google Scholar]
- 2. Hood DC, Kardon RH. A framework for comparing structural and functional measures of glaucomatous damage. Prog Retin Eye Res. 2007;26:688–710 [DOI] [PMC free article] [PubMed] [Google Scholar]
- 3. Wang M, Hood DC, Cho J, et al. Measurement of local retinal ganglion cell thickness in patients with glaucoma using frequency-domain optical coherence tomography. Arch Ophthalmol. 2009;127:875–881 [DOI] [PMC free article] [PubMed] [Google Scholar]
- 4. Tan O, Chopra V, Lu AT, Schuman JS, et al. Detection of macular ganglion cell loss in glaucoma by Fourier-domain optical coherence tomography. Ophthalmology. 2009;116:2305–2314 [DOI] [PMC free article] [PubMed] [Google Scholar]
- 5. Raza AS, Cho J, De Moraes CGV, et al. Macular retinal ganglion cell layer thickness and local visual field sensitivity in glaucoma. Arch Ophthalmol. In press [DOI] [PMC free article] [PubMed] [Google Scholar]
- 6. Cho JW, Sung KR, Lee S, et al. Relationship between visual field sensitivity and macular ganglion cell complex thickness as measured by spectral domain optical coherence tomography. Invest Ophthalmol Vis Sci. 2010;51:6401–6407 [DOI] [PubMed] [Google Scholar]
- 7. Garway-Heath DF, Poinoosawmy D, Fitzke FW, Hitchings RA. Mapping the visual field to the optic disc in normal tension glaucoma eyes. Ophthalmology. 2000;107:1809–1815 [DOI] [PubMed] [Google Scholar]
- 8. Hood DC, Fortune B, Arthur SN, et al. Blood vessel contributions to retinal nerve fiber layer thickness profiles measured with optical coherence tomography. J Glaucoma. 2008;17:519–528 [DOI] [PMC free article] [PubMed] [Google Scholar]
- 9. Jonas JB, Fernandez MC, Naumann GO. Parapapillary atrophy and retinal vessel diameter in nonglaucomatous optic nerve damage. Invest Ophthalmol Vis Sci. 1991;32:2942–2947 [PubMed] [Google Scholar]
- 10. Rader J, Feuer WJ, Anderson DR. Peripapillary vasoconstriction in the glaucomas and the anterior ischemic optic neuropathies. Am J Ophthalmol. 1994;117:72–80 [DOI] [PubMed] [Google Scholar]


