Perfusion-cultured bovine anterior segments showed a differential elevation of intraocular pressure and an induction of myocilin upon glucocorticoid treatment. This is an ideal model for studying glucocorticoid-induced ocular hypertension/glaucoma.
Abstract
Purpose.
To determine whether perfusion-cultured bovine anterior segments would be a suitable model for glaucoma research.
Methods.
Fresh bovine eyes were dissected and sealed on a custom-made acrylic dish with an O-ring. Perfusion medium was infused by a syringe pump at a constant infusion rate of 5 μL/min. After intraocular pressure (IOP) was stable, bovine eyes were perfused with medium containing either a vehicle control (0.1% ethanol [ETH]) or dexamethasone (DEX) for up to 7 days. IOP was recorded by a pressure transducer and a computerized system. Perfusion medium was collected for Western immunoblot analysis of myocilin (MYOC).
Results.
The morphology of the bovine trabecular meshwork after perfusion culture was similar to that of freshly dissected, nonperfused bovine eyes. Treatment with DEX elevated IOP in some bovine eyes, whereas others showed little change. The authors analyzed the data from 18 ETH-treated control eyes and defined 2.82 mm Hg as the threshold of ocular hypertension (OHT), which equals mean pressure change + 2× SD. Approximately 40% (12/29) of the bovine eyes were DEX responders, which is very close to the DEX-responsive rates observed in human and monkey eyes. Western blot data showed that DEX treatment induced the expression of the DEX-inducible gene MYOC only in the perfusion-cultured anterior segments with DEX-induced OHT.
Conclusions.
OHT can be induced by DEX in perfusion-cultured bovine anterior segments. This is a fast, convenient, affordable, and reliable model for studying DEX-induced OHT and the mechanisms of trabecular outflow.
Glucocorticoid-induced glaucoma is a subtype of secondary open angle glaucoma. Either topical or systemic administration of glucocorticoids may induce (OHT) in susceptible persons, some of whom develop optic neuropathy/glaucoma even after glucocorticoid withdrawal.
Although glucocorticoid-induced glaucoma is considered a secondary glaucoma, it is closely associated with primary open angle glaucoma (POAG). First, early studies showed that glucocorticoids induce OHT in <36% of the general population compared with >90% of POAG patients.1–4 Furthermore, glucocorticoid responsiveness is an important risk factor for POAG.5,6 Second, POAG and glucocorticoid-induced glaucoma share similar clinical presentations, including open anterior chamber angle, IOP elevation, characteristic optic neuropathy, and loss of peripheral vision.7,8 Third, the elevated IOP in both cases is primarily due to damage to the trabecular meshwork (TM).9
The TM plays an important role in IOP regulation. It is the key component of the conventional aqueous humor outflow pathway and contributes to the majority of outflow resistance. Compromised TM function dramatically increases outflow resistance, which leads to IOP elevation. Pathologic changes in the TM, including loss of TM cells, thickening of TM beams, deposition of plaque-like materials, excessive extracellular matrix (ECM) accumulation, and increased cross-linked actin networks (CLANs), are found in glucocorticoid-induced glaucoma as well as in POAG.7,8 Therefore, studying glucocorticoid-induced glaucoma will not only help us to understand this disease but will also provide insightful information about POAG.
A number of models have been developed for studying glucocorticoid-induced glaucoma. These can be divided into in vitro, in vivo, and ex vivo models. In vitro models use cultured TM cells. These models are simple and easy to maintain, but they may not reflect in vivo conditions. Instead, in vivo models are most relevant to human glucocorticoid-induced glaucoma. Monkeys,10,11 rabbits,12 mice,13 rats,14 cats,15,16 cows, and sheep17–20 develop glucocorticoid-induced OHT. However, these models cost more and usually need at least 2 to 4 weeks to develop OHT. Ex vivo models combine both the pros and the cons of the two previous models. They provide better simulation of the physiological conditions than in vitro cell cultures and require less time and cost than in vivo models.
Perfusion-cultured human anterior segments have been frequently used as an ex vivo model in glucocorticoid-induced glaucoma research.10,21,22 However, human donor eyes are limited by their availability and high cost. More important, because “healthy” human donor eyes are prioritized for corneal transplantation, those available for research are not of the best quality. Therefore, we were looking for eyes from other species as alternatives.
In contrast to human donor eyes, bovine eyes are inexpensive and readily available. Because of their large size, surgical manipulation and sample collection are easy. Studies using perfusion-cultured bovine anterior segments showed that the bovine TM (BTM) is directly involved in regulating the outflow pathway.23–25 BTM cells share many properties with human TM cells,26 including dexamethasone (DEX) induction of ECM proteins.27 Recently, Wade et al.28 reported DEX-induced CLAN formation in confluent BTM cultures, which is a unique feature of the TM. Their findings further prove the validity of this model. In addition, an in vivo study showed that glucocorticoids can induce OHT in bovine eyes.18 Based on the advantages described here, we decided to test whether perfusion-cultured bovine anterior segments are suitable for studying glucocorticoid-induced OHT and trabecular outflow research.
Methods
Bovine Eyes
Paired and unpaired calf eyes were obtained from local abattoirs and transported to the laboratory on ice. Eyes were processed within 6 hours of death. The bovine eyes used in this study were from mixed cow breeds. Most of them were of either the Angus or the Holstein breed.
Anterior Segment Perfusion Culture
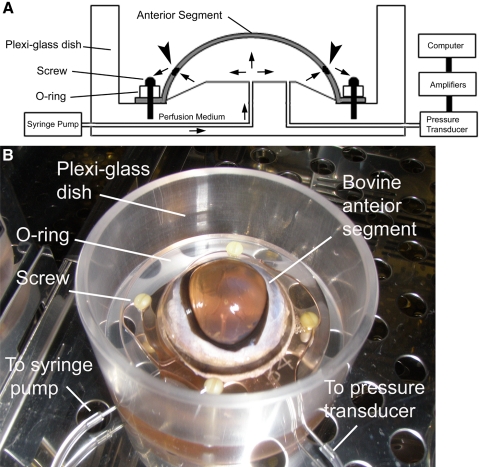
We adopted the procedures reported by Johnson et al.29 with modifications. The experimental setup is demonstrated in Figure 1. Briefly, the extraocular tissue was removed and the integrity of the eye was evaluated. After sterilization with povidone-iodine topical antiseptic (Betadine; Purdue Products, Stamford, CT) for 1 to 2 minutes and two rinses with PBS, the bovine eye was cut at the equator to separate the anterior and posterior segments. The vitreous, uveal tract, retina, retinal pigment epithelium, and lens were carefully removed so that the TM was preserved. The remaining anterior segment, which contained the cornea, sclera, and TM, was mounted on a custom-made acrylic (Plexiglas) dish. A water-tight artificial anterior chamber was formed by clamping the anterior segment at the equator with an O-ring and four custom-made plastic screws. There were two cannulas communicating with the artificial anterior chamber. One was for medium infusion, and the other was connected to a pressure transducer for data recording. Perfusion culture medium containing Dulbecco's modified Eagle's medium-high glucose supplemented with 2 mM glutamine, 1% penicillin and streptomycin, and 1% amphotericin B (Thermo Scientific, Worcester, MA) was infused with a syringe pump (PHD2000; Harvard Apparatus, Holliston, MA) at a constant infusion rate of 5 μL/min.
Figure 1.
The bovine anterior segment perfusion culture model. (A) Diagram of the bovine anterior segment perfusion culture model. Arrows: directions of medium flow; arrowheads: TM. (B) Experimental setup.
Glucocorticoid-Induced OHT
Bovine anterior segments were perfusion cultured for 1 to 3 days until IOPs were stable. The eyes were then treated with either 0.1% ethanol (ETH) as a vehicle control or 100 nM DEX (Sigma-Aldrich, St. Louis, MO) in perfusion culture medium for up to 7 days.
Data Acquisition and Analysis
IOP was converted to electric signals by a disposable blood pressure transducer (ADInstruments, Colorado Springs, CO), amplified by a data acquisition system (PowerLab; ADInstruments) and a bridge amplifier (Octal Bridge Amp; ADInstruments) and then recorded (LabChart software; ADInstruments). IOP was sampled every minute. Data were averaged every 24 hours for analysis. We defined ΔIOP as the actual IOP averaged over 24 hours minus the basal IOP of individual eyes on certain day, and we defined mΔIOP as the maximum ΔIOP of individual eyes during perfusion culture. The outflow facility (μL/min/mm Hg) was calculated by dividing the perfusion rate (5 μL/min) by the IOP (mm Hg). We defined mΔC as the maximum decrease of outflow facility of individual eyes during perfusion culture.
Sample Collection after Perfusion Organ Culture
After perfusion organ culture, conditioned medium was collected, spun at 500g for 5 minutes to remove tissue debris, and stored at −80°C until analysis. The anterior segment was cut into sectors and fixed with 4% paraformaldehyde in PBS at 4°C for 4 hours or overnight.
Histology
Fixed TM tissue was washed three times with PBS, dehydrated with ETH, and embedded in paraffin. Samples were sectioned at 5 μm and stained with hematoxylin and eosin (H&E) or Gomori trichrome according to conventional protocols.
Western Immunoblot Analysis
Approximately 500 μL conditioned medium was concentrated with resin (StrataClean; Agilent Technologies, Santa Clara, CA) at 1:100 (vol/vol). The resin was precipitated by centrifugation, and conditioned medium was carefully removed without disturbing the resin. After boiling the resin with the same volume of 2× Laemmli buffer, protein samples were resolved on SDS-PAGE gel and transferred to polyvinylidene difluoride membrane. After blocking with 5% nonfat dry milk, the blot was probed with the primary antibody goat anti-MYOC (1:500; Santa Cruz, CA) or rabbit anti-fibronectin (FN; 1:500; Millipore, Billerica, MA) and secondary antibody donkey anti-goat horseradish peroxidase (HRP; 1:10,000; Santa Cruz Biotechnology) or goat anti-rabbit HRP (1:10,000; Cell Signaling, Danvers, MA). The chemiluminescent signal was developed (SuperSignal West Femto Maximum Sensitivity Substrate; Thermo Fisher Scientific, Rockford, IL) and was detected with an imaging system (FluorChem; Cell Biosciences, Santa Clara, CA).
For Coomassie blue staining, 15 μL conditioned medium was mixed with Laemmli buffer, boiled, and resolved on SDS-PAGE gel. The gel was stained with reagent (GelCode Blue Stain Reagent; Thermo Scientific) according to manufacturer's instructions.
Statistical Analysis
Student's t-test or one-way analysis of variance (ANOVA) was used for statistical analysis. For comparisons of categorical data, Fisher's exact test was used. P < 0.05 was considered significant.
Results
Morphology of the BTM after Perfusion Organ Culture
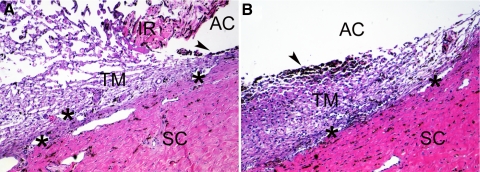
We first studied whether bovine anterior segments could be healthily maintained in our perfusion organ culture system. Bovine anterior segments, after perfusion culture for 9 days without any treatment, were compared to freshly dissected bovine eyes by histologic examination (Fig. 2). The morphology of the TM in both eyes was similar, which suggested that our system was suitable for perfusion culture of the bovine anterior segment.
Figure 2.
Morphology of the TM from perfusion-cultured bovine anterior segment. The TM from a bovine eye without perfusion culture (A) or an anterior segment subjected to perfusion culture for 9 days (B) was imbedded in paraffin, sectioned, and stained with H&E. The uveal tract, including the iris (IR), was removed from the perfused eye (B). The TM is a loose, reticular tissue adjacent to the sclera (SC). Because of its phagocytotic capability, the TM tissue close to the uveal tract is rich in pigment (arrowheads). The aqueous humor passes the TM and exits the eye through the angular aqueous plexus (asterisks), which is equivalent to the Schlemm's canal in primate eyes. AC, the anterior chamber. Magnification, 100×. Experiments were performed in biological replicates, and representative data are shown.
Differential Response of Bovine Eyes to DEX
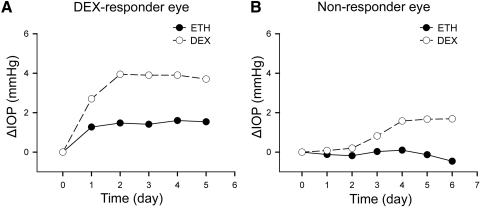
Bovine eyes were perfusion cultured with 100 nM DEX for up to 7 days. Similar to human and monkey eye studies, only some of the bovine eyes showed significant IOP elevation after DEX administration (Fig. 3A). Twelve of 29 bovine eyes were DEX responders. Our observation indicated that, as in other species, there were DEX responders and nonresponders in bovine eyes (Fig. 3B). The raw data from each eye are listed in Supplementary Tables S1 and S2 (http://www.iovs.org/lookup/suppl/doi:10.1167/iovs.11-8133/-/DCSupplemental).
Figure 3.
DEX-responder and nonresponder bovine eyes. Bovine anterior segments from paired eyes were subjected to perfusion culture. When IOP was stable, one eye was treated with 0.1% ETH as control (black dots), and the fellow eye was treated with 100 nM DEX (white circles). The basal IOP on day 0, which was the IOP before treatment, was set at 0 mm Hg. ETH or DEX treatment was started from day 0, and the ΔIOP was plotted over time. Representative data from a pair of DEX-responder eyes (A) and a pair of nonresponder eyes (B) are shown.
OHT in Perfusion-Cultured Bovine Anterior Segments
To define “significant IOP elevation”/OHT, we analyzed data from 18 control eyes treated with ETH. IOP was averaged every 24 hours for analysis. We determined the maximum change in IOP from the baseline IOP (mΔIOP; see Methods for the definitions of ΔIOP and mΔIOP), which was 1.14 ± 0.84 mm Hg. We therefore defined the threshold of a significant change as the mean change in mΔIOP + 2× SD (1.14 + 2 × 0.84 = 2.82 mm Hg). Thus, an IOP elevation higher than 2.82 mm Hg should have been due to DEX treatment.
To confirm whether our threshold of OHT was appropriate, Student's t-tests were performed between ETH-treated, DEX-responder, and nonresponder eyes. The mΔIOP of DEX-responder eyes was significantly higher than that of either ETH-treated or nonresponder eyes (both P < 0.01), whereas ETH-treated eyes had similar mΔIOPs as nonresponder eyes (P = 0.50) (Table 1).
Table 1.
Statistical Analysis of the mΔIOP of Perfusion-Cultured Bovine Anterior Segments
| Student's t-Test | P |
|---|---|
| ETH vs. DEX Responders | <0.01 |
| ETH vs. Nonresponders | 0.50 |
| DEX Responders vs. Nonresponders | <0.01 |
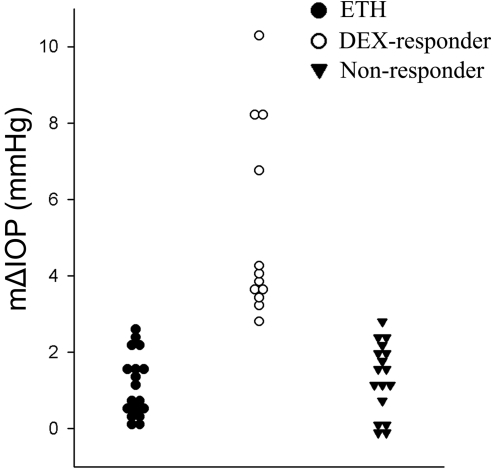
Based on this value, we classified bovine eyes into DEX responders (mΔIOP > 2.82 mm Hg) and nonresponders (mΔIOP < 2.82 mm Hg) (Table 2, Fig. 4). Our data suggested that approximately 41% (12/29) of the bovine eyes used in this study were DEX responders.
Table 2.
Comparisons of mΔIOP between ETH-Treated, DEX Responder, and Nonresponder Eyes
| Treatment | Mean mΔIOP (mm Hg) | SD | n |
|---|---|---|---|
| ETH | 1.14 | 0.84 | 18 |
| DEX Responders | 5.20 | 2.50 | 12 |
| Nonresponders | 1.34 | 0.90 | 17 |
Figure 4.
Frequency plot of the IOP data. The mΔIOP of ETH treated (vehicle control), DEX-responder, and nonresponder eyes were plotted in three groups.
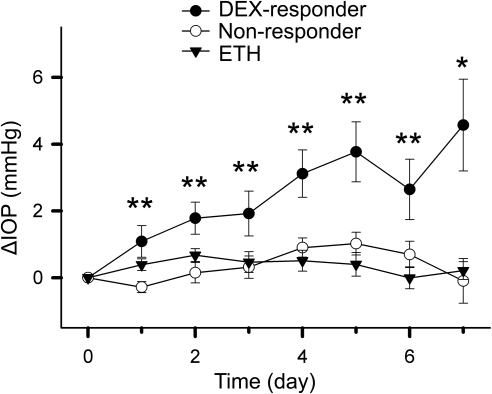
To better describe the IOP change of the three groups of eyes (ETH treated, DEX responders, and nonresponders), we plotted them based on mean ± SEM over time (Fig. 5). ANOVA showed that IOP elevation in DEX-responder eyes was significantly higher than in nonresponder eyes or ETH-treated eyes (P < 0.05) from one day after treatment, and persisted throughout the 7 days of perfusion culture (Fig. 5).
Figure 5.
IOP change in bovine anterior segments during perfusion organ culture. The mean ± SEM of ΔIOP of DEX-responder, nonresponder, and ETH-treated (vehicle control) eyes were plotted over time. The IOP on day 0 was the basal IOP, i.e., the IOP before treatment, which was set at 0 mm Hg. Data were analyzed by one-way ANOVA on each treatment day. *P < 0.05; **P < 0.01.
DEX-Induced MYOC Expression in Perfusion-Cultured Bovine Eyes
The glaucoma gene MYOC30 is a secreted glycoprotein of unknown function expressed in TM cells and other ocular tissues.30,31 MYOC expression is inducible by DEX in TM cells, which is often considered a standard for TM cell identification.10,31 Similarly, the ECM protein FN is DEX-inducible in the TM.7,8 FN deposition in the TM is a contributor to increased outflow resistance and IOP elevation in glaucoma.
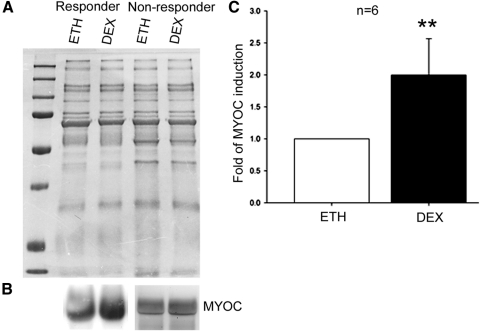
We collected conditioned medium at the end of perfusion culture and compared MYOC and FN expression between ETH- and DEX-treated eyes. Because of the lack of a protein marker as a loading control for conditioned medium, the SDS-PAGE gel was stained with Coomassie blue after electrophoresis and showed equal amounts of total proteins between the corresponding samples (Fig. 6A). Western blot analysis showed that MYOC was upregulated by DEX in 6 of 8 pairs of DEX-responder eyes (75%) (Fig. 6B). In contrast, none of the six pairs of nonresponder eyes examined showed DEX-induced MYOC elevation (Fig. 6B), and the difference was statistically significant (Table 3; P < 0.001). Quantitative analysis of MYOC expression by densitometry showed an average 2.00 ± 0.57 (mean ± SD) fold elevation in the six pairs of DEX responders that demonstrated MYOC induction, which was statistically significant as shown by paired t-test (Fig. 6C; P < 0.01). However, similar differential induction of FN was not observed (Table 3; P > 0.500).
Figure 6.
DEX-induced MYOC expression in perfusion-cultured bovine eyes. Conditioned medium was collected from paired perfusion-cultured bovine anterior segments and subjected to Coomassie blue staining (A) or Western blot analysis (B). (A) Coomassie blue staining of the SDS-PAGE gel loaded with equal amount of conditioned medium after electrophoresis. (B) In DEX-responder eyes, DEX induced MYOC expression in 6 of 8 eyes (left), but MYOC expression was not induced in 4 of 4 nonresponder eyes (right). Experiments were repeated in biological replicates, and representative data are shown. (C) DEX induction of MYOC in the six pairs of DEX-responder eyes was quantitated by densitometry. Expression of MYOC in the DEX-treated eye was normalized to the fellow ETH-treated eye, and the mean ± SD (error bar) is presented. Data sets were analyzed by paired t-test. **P < 0.01.
Table 3.
Comparisons of MYOC and FN Induction between DEX Responder and Nonresponder Eyes
| DEX Responders | Nonresponders | Fisher's Exact Test | |
|---|---|---|---|
| MYOC | 6/8 | 0/6 | P < 0.001 |
| FN | 3/8 | 1/6 | P > 0.500 |
Morphology of the BTM after DEX Treatment
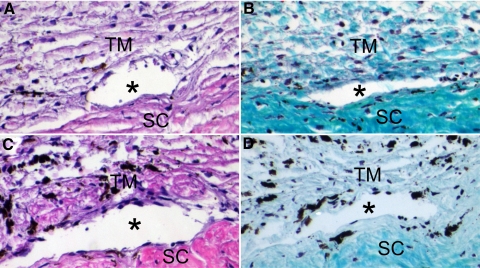
Besides biochemical changes, we investigated morphologic changes of the BTM after DEX treatment by H&E staining and Gomori trichrome staining; the latter is a commonly used technique to differentiate nuclei (black), cytoplasm/keratin/muscle fibers (red), and collagen (green or blue). The morphology of the BTM of DEX responders was similar to that of nonresponders, except that there was intense staining of collagen fibers in DEX responders (Fig. 7), which indicated DEX-induced excessive ECM deposition in the TM of DEX-responder eyes.
Figure 7.
Morphology of the BTM after DEX treatment. The TM of a DEX-responder eye (A, B) or a nonresponder eye (C, D) was subjected to H&E staining (A, C) or Gomori trichrome staining (B, D) after perfusion culture with DEX. Asterisks: angular aqueous plexus. SC, sclera. Magnification, 200×. Experiments were performed in biological replicates, and representative data are shown.
Discussion
Human, monkey, porcine, and bovine eyes are the frequently used glaucoma models. The similarities and differences in the TM of the four species are summarized in Table 4. One of the characteristics that significantly affect IOP measurement is the washout effect. The washout effect is the increase of outflow facility during perfusion culture of the eye. This effect has been observed in all species studied except humans and mice.32 Recent findings suggest that washout is due to the separation of the juxtacanalicular tissue from the inner wall of Schlemm's canal.33 The time-rate-of-change of facility (washout rate) is approximately 20% per hour in the bovine eye during the initial 2 hours.34 However, our model is not suitable for studying this effect. Whether the washout effect is time dependent or volume dependent is still controversial,33 although most of the studies reported this effect within the initial several hours of perfusion culture of the whole eye. In the anterior segment perfusion culture model, the bovine anterior segment was initially underinflated to avoid rupture of the TM. The eye usually requires overnight culture to become inflated and stabilized, during which the washout effect is masked. Therefore, the bovine anterior segment perfusion culture model is not suitable for the study of this washout effect.
Table 4.
Comparisons of the Human, Monkey, Porcine, and Bovine Models
| Eye Model | Anatomic Landmarks of the TM | Morphology of the TM | Drainage | Washout Effect | Differential Glucocorticoid Responsiveness | Cost and Availability | Biohazard Risk Level |
|---|---|---|---|---|---|---|---|
| Human | Schwalbe's line and scleral spur | Meshwork-like | Schlemm's canal | No | Yes | High and limited | High |
| Monkey | Schwalbe's line and scleral spur | Meshwork-like | Schlemm's canal | Yes | Yes | High and limited | High |
| Porcine | Unclear | Reticular | Angular aqueous plexus | Yes | Not reported | Affordable and readily available | Low |
| Bovine | Unclear | Reticular | Angular aqueous plexus | Yes | Yes | Affordable and readily available | Low |
Another important parameter worth further investigation is the perfusion rate. Ideally, the perfusion rate should be identical with the bovine aqueous humor formation rate, which can be measured by fluorophotometry.35 However, to our knowledge, the bovine aqueous humor formation rate has not been reported. The 5 μL/min perfusion rate was therefore selected based on our experience and preliminary studies. The aqueous humor formation rate can also be estimated by the Goldmann equation IOP = F/C + EVP or F = C (IOP − EVP), where F is the aqueous humor formation rate, C is the outflow facility, and EVP is the episcleral venous pressure. The mean IOP of in vivo bovine eyes is approximately 16 mm Hg.18 Perfusion culture studies with the whole bovine eye reported a basal outflow facility ranging from 1.06 to 1.54 μL/min/mm Hg.36,37 In the human eye, the EVP is approximately 8 to 9 mm Hg.38 Although no bovine EVP data are available, because of the high blood pressure of the cow (160/110 mm Hg),39 we speculate that the EVP of the bovine eye may be higher than that of the human eye. Combining these factors, the actual bovine aqueous humor formation rate may be close to 5 μL/min. More important, the fact that the morphology of the bovine TM was well maintained and the successful induction of glucocorticoid response suggest that this perfusion rate is appropriate. Nevertheless, it would be optimal if a perfusion rate matching the physiological aqueous humor formation rate could be adopted in this model.
With the perfusion rate of 5 μL/min, we found that the basal outflow facility of the 47 bovine eyes was 1.01 ± 0.08 μL/min/mm Hg (mean ± SEM) (Supplementary Table S2 legend, http://www.iovs.org/lookup/suppl/doi:10.1167/iovs.11-8133/-/DCSupplemental), a value very close to that reported by Scott et al.36 in eight perfusion-cultured bovine whole eyes (1.06 ± 0.06 μL/min/mm Hg). Although several bovine eyes demonstrated an outflow facility <0.5 or higher than 2 μL/min/mm Hg in this study, considering our large sample size (n = 47), these “off-center” outflow facility values were possibly physiological variations rather than an indication of TM dysfunction. Furthermore, Lu et al.37 reported a basal outflow facility in 12 bovine eyes of 1.54 ± 0.34 μL/min/mm Hg (mean ± SEM),37 which is equivalent to 1.54 ± 1.18 μL/min/mm Hg (mean ± SD; SD = SEM × √n). In other words, 68% of the outflow facility values reported in that study were between 0.36 and 2.72 μL/min/mm Hg, and our data fit into this range. Finally, we analyzed the basal IOP and basal outflow facility of the three groups (Supplementary Tables S1, S2, http://www.iovs.org/lookup/suppl/doi:10.1167/iovs.11-8133/-/DCSupplemental). The mean ± SD of the basal IOP of the ETH, DEX-responder, and nonresponder groups are 6.60 ± 2.96 mmHg, 5.84 ± 2.64 mmHg, and 5.88 ± 2.42 mmHg, respectively. The mean ± SD of the basal outflow facility of the ETH, DEX-responder, and nonresponder groups are 0.93 ± 0.46 μL/min/mm Hg, 1.09 ± 0.60 μL/min/mm Hg, and 1.05 ± 0.62 μL/min/mm Hg, respectively. One-way ANOVA did not show statistical significance among the three groups (P > 0.5 for both IOP and outflow facility), which suggests that the differential DEX responsiveness was not due to endogenous differences in the outflow facility of the bovine eyes.
In this study, we investigated perfusion-cultured bovine anterior segments as a model for studying glucocorticoid-induced glaucoma. The bovine TM tissue could survive in the perfusion culture system for at least 9 days. Our previous studies showed that perfusion-cultured human anterior segments can be maintained under similar conditions for up to 4 weeks.21 We speculate that bovine anterior segments would be able to last at least as long as human anterior segments because human donor eyes are not as healthy and fresh as bovine eyes. However, further studies are needed to determine the maximum limits of perfusion time for this model.
During DEX treatment, we found approximately 40% of the bovine eyes developed OHT. The DEX responder rate in our study was similar to that reported in numerous clinical studies in perfusion-cultured human donor eyes21 and in vivo monkey eyes.11 The existence of DEX responders and nonresponders makes this model more relevant to human glucocorticoid-induced glaucoma.
Differential glucocorticoid responsiveness has been reported not only in primates but also in a number of other species, including mice and rabbits.13,40,41 In contrast to our observations, Gerometta et al.18 reported a 100% DEX-responder rate in an in vivo study of 12 Bradford cows treated with prednisolone for 4 weeks. This apparent discrepancy with responder rates in our present study may result from differences in animal strains, experimental methods, glucocorticoids used, and sample sizes. We speculate that an animal strain difference is the most likely reason. Furthermore, unlike cows raised on the same ranch, which are often of the same strain, bovine eyes from abattoirs are usually from mixed cow strains. A recent study by Whitlock et al. 13 showed heterogeneity in DEX responsiveness in mice of a mixed genetic background, which further suggests the importance of animal strains in glucocorticoid-induced OHT. The second possible cause is experimental methods. The two experiments were carried out in different systems (ex vivo vs. in vivo) with different glucocorticoids (perfused DEX vs. topical prednisolone) and treatment times (5–7 days vs. 4 weeks). Finally, our ex vivo model enabled us to have a larger sample size.
In addition to differential IOP changes, MYOC expression seemed to be associated with DEX responsiveness. DEX-induced MYOC expression was found only in DEX-responder eyes but not in nonresponder eyes. We would like to emphasize that the “DEX-inducible” and “glaucoma” gene MYOC was used as a marker to determine overall DEX responsiveness. MYOC induction should not be interpreted as the cause of IOP elevation because previous studies already showed that wild-type MYOC does not contribute to IOP elevation.42–46 Nevertheless, it is still a good indicator of DEX responsiveness.
Another DEX-inducible gene, FN, did not demonstrate differential induction or correlation with DEX responsiveness. We believe that this could have been due to two reasons. First, FN is one of the most abundant ECM genes expressed in the TM, and this abundance may mask any slight change in FN expression. Second, there are more than 12 FN isoforms,47 and the antibody used in the study may be able to detect only some of them. Therefore, further studies of FN are required to elucidate its role in DEX-induced OHT.
In contrast to biochemical changes, light microscopy morphologic analysis of the BTM after DEX treatment revealed little difference between DEX-responder and nonresponder eyes except intense staining of the DEX-responder TM with Gomori trichrome. Although this may suggest excessive ECM deposition in the TM, other research techniques, including electron microscopy, will be used in future studies to compare the BTM of DEX responders and nonresponders.
The mechanism involved in glucocorticoid responsiveness is unclear. However, glucocorticoid receptor α (GRα) and its alternatively spliced form GRβ may play a key role.7 In the human GR pathway, glucocorticoids bind to GRα, translocate into the nucleus, and change gene expression after binding to the glucocorticoid response element. In contrast, GRβ does not bind to glucocorticoids but remains in the nucleus as a dominant negative inhibitor.48,49 Many studies have suggested that the GRα/GRβ ratio determines glucocorticoid responsiveness in TM cells.50–53 In addition to humans, GRβ has been found in zebrafish54 and mice.55 Although the existence of bovine GRβ has not been confirmed, the alternative splicing site and the GRβ coding sequence have been predicted by computational analysis.54 If GRβ can be cloned, our model will become an invaluable tool for GR pathway research as well. In summary, perfusion-cultured bovine anterior segments are a quick, convenient, affordable, and reliable model for studying glucocorticoid-induced OHT and glaucoma.
Supplementary Material
Acknowledgments
The authors thank Anne-Marie Brun and Sandra Neubauer for their assistance in histology and Alcon Research, Ltd., for invaluable technical assistance.
Footnotes
Supported in part by National Institutes of Health Grant RO1 EY016242 (TY, AFC) and a grant from Alcon Research, Ltd. (AFC).
Disclosure: W. Mao, None; T. Tovar-Vidales, None; T. Yorio, None; R.J. Wordinger, None; A.F. Clark, Alcon Research, Ltd. (F)
References
- 1. Becker B. Intraocular pressure response to topical corticosteroids. Invest Ophthalmol. 1965;4:198–205 [PubMed] [Google Scholar]
- 2. Armaly MF. Effect of corticosteroids on intraocular pressure and fluid dynamics, 2:. the effect of dexamethasone in the glaucomatous eye. Arch Ophthalmol. 1963;70:492–499 [DOI] [PubMed] [Google Scholar]
- 3. Armaly MF. Effect of corticosteroids on intraocular pressure and fluid dynamics, 1: the effect of dexamethasone in the normal eye. Arch Ophthalmol. 1963;70:482–491 [DOI] [PubMed] [Google Scholar]
- 4. Becker B, Hahn KA. Topical corticosteroids and heredity in primary open-angle glaucoma. Am J Ophthalmol. 1964;57:543–551 [DOI] [PubMed] [Google Scholar]
- 5. Kitazawa Y, Horie T. The prognosis of corticosteroid-responsive individuals. Arch Ophthalmol. 1981;99:819–823 [DOI] [PubMed] [Google Scholar]
- 6. Lewis JM, Priddy T, Judd J, et al. Intraocular pressure response to topical dexamethasone as a predictor for the development of primary open-angle glaucoma. Am J Ophthalmol. 1988;106:607–612 [DOI] [PubMed] [Google Scholar]
- 7. Clark AF, Wordinger RJ. The role of steroids in outflow resistance. Exp Eye Res. 2009;88:752–759 [DOI] [PubMed] [Google Scholar]
- 8. Wordinger RJ, Clark AF. Effects of glucocorticoids on the trabecular meshwork: towards a better understanding of glaucoma. Prog Retin Eye Res. 1999;18:629–667 [DOI] [PubMed] [Google Scholar]
- 9. Tektas OY, Lutjen-Drecoll E. Structural changes of the trabecular meshwork in different kinds of glaucoma. Exp Eye Res. 2009;88:769–775 [DOI] [PubMed] [Google Scholar]
- 10. Clark AF, Steely HT, Dickerson JE, Jr., et al. Glucocorticoid induction of the glaucoma gene MYOC in human and monkey trabecular meshwork cells and tissues. Invest Ophthalmol Vis Sci. 2001;42:1769–1780 [PubMed] [Google Scholar]
- 11. Fingert JH, Clark AF, Craig JE, et al. Evaluation of the myocilin (MYOC) glaucoma gene in monkey and human steroid-induced ocular hypertension. Invest Ophthalmol Vis Sci. 2001;42:145–152 [PubMed] [Google Scholar]
- 12. Ticho U, Lahav M, Berkowitz S, Yoffe P. Ocular changes in rabbits with corticosteroid-induced ocular hypertension. Br J Ophthalmol. 1979;63:646–650 [DOI] [PMC free article] [PubMed] [Google Scholar]
- 13. Whitlock NA, McKnight B, Corcoran KN, Rodriguez LA, Rice DS. Increased intraocular pressure in mice treated with dexamethasone. Invest Ophthalmol Vis Sci. 2010;51:6496–6503 [DOI] [PubMed] [Google Scholar]
- 14. Miyara N, Shinzato M, Yamashiro Y, Iwamatsu A, Kariya K, Sawaguchi S. Proteomic analysis of rat retina in a steroid-induced ocular hypertension model: potential vulnerability to oxidative stress. Jpn J Ophthalmol. 2008;52:84–90 [DOI] [PubMed] [Google Scholar]
- 15. Zhan GL, Miranda OC, Bito LZ. Steroid glaucoma: corticosteroid-induced ocular hypertension in cats. Exp Eye Res. 1992;54:211–218 [DOI] [PubMed] [Google Scholar]
- 16. Bhattacherjee P, Paterson CA, Spellman JM, Graff G, Yanni JM. Pharmacological validation of a feline model of steroid-induced ocular hypertension. Arch Ophthalmol. 1999;117:361–364 [DOI] [PubMed] [Google Scholar]
- 17. Candia OA, Gerometta R, Millar JC, Podos SM. Suppression of corticosteroid-induced ocular hypertension in sheep by anecortave. Arch Ophthalmol. 128:338–343 [DOI] [PubMed] [Google Scholar]
- 18. Gerometta R, Podos SM, Candia OA, et al. Steroid-induced ocular hypertension in normal cattle. Arch Ophthalmol. 2004;122:1492–1497 [DOI] [PubMed] [Google Scholar]
- 19. Gerometta R, Podos SM, Danias J, Candia OA. Steroid-induced ocular hypertension in normal sheep. Invest Ophthalmol Vis Sci. 2009;50:669–673 [DOI] [PubMed] [Google Scholar]
- 20. Gerometta R, Spiga MG, Borras T, Candia OA. Treatment of sheep steroid-induced ocular hypertension with a glucocorticoid-inducible MMP1 gene therapy virus. Invest Ophthalmol Vis Sci. 51:3042–3048 [DOI] [PMC free article] [PubMed] [Google Scholar]
- 21. Clark AF, Wilson K, de Kater AW, Allingham RR, McCartney MD. Dexamethasone-induced ocular hypertension in perfusion-cultured human eyes. Invest Ophthalmol Vis Sci. 1995;36:478–489 [PubMed] [Google Scholar]
- 22. Johnson DH, Bradley JM, Acott TS. The effect of dexamethasone on glycosaminoglycans of human trabecular meshwork in perfusion organ culture. Invest Ophthalmol Vis Sci. 1990;31:2568–2571 [PubMed] [Google Scholar]
- 23. Erickson-Lamy K, Rohen JW, Grant WM. Outflow facility studies in the perfused bovine aqueous outflow pathways. Curr Eye Res. 1988;7:799–807 [DOI] [PubMed] [Google Scholar]
- 24. Sawaguchi S, Lam TT, Yue BY, Tso MO. Effects of glycosaminoglycan-degrading enzymes on bovine trabecular meshwork in organ culture. J Glaucoma. 1993;2:80–86 [PubMed] [Google Scholar]
- 25. Wiederholt M, Bielka S, Schweig F, Lutjen-Drecoll E, Lepple-Wienhues A. Regulation of outflow rate and resistance in the perfused anterior segment of the bovine eye. Exp Eye Res. 1995;61:223–234 [DOI] [PubMed] [Google Scholar]
- 26. Grierson I, Day J, Unger WG, Ahmed A. Phagocytosis of latex microspheres by bovine meshwork cells in culture. Graefes Arch Clin Exp Ophthalmol. 1986;224:536–544 [DOI] [PubMed] [Google Scholar]
- 27. Zhou L, Li Y, Yue BY. Glucocorticoid effects on extracellular matrix proteins and integrins in bovine trabecular meshwork cells in relation to glaucoma. Int J Mol Med. 1998;1:339–346 [PubMed] [Google Scholar]
- 28. Wade NC, Grierson I, O'Reilly S, et al. Cross-linked actin networks (CLANs) in bovine trabecular meshwork cells. Exp Eye Res. 2009;89:648–659 [DOI] [PubMed] [Google Scholar]
- 29. Johnson DH, Tschumper RC. Human trabecular meshwork organ culture: a new method. Invest Ophthalmol Vis Sci. 1987;28:945–953 [PubMed] [Google Scholar]
- 30. Stone EM, Fingert JH, Alward WL, et al. Identification of a gene that causes primary open angle glaucoma. Science. 1997;275:668–670 [DOI] [PubMed] [Google Scholar]
- 31. Nguyen TD, Chen P, Huang WD, Chen H, Johnson D, Polansky JR. Gene structure and properties of TIGR, an olfactomedin-related glycoprotein cloned from glucocorticoid-induced trabecular meshwork cells. J Biol Chem. 1998;273:6341–6350 [DOI] [PubMed] [Google Scholar]
- 32. Lei Y, Overby DR, Boussommier-Calleja A, Stamer WD, Ethier CR. Outflow physiology of the mouse eye: pressure dependence and washout. Invest Ophthalmol Vis Sci. 2010;52:1865–1871 [DOI] [PMC free article] [PubMed] [Google Scholar]
- 33. Gong H, Freddo TF. The washout phenomenon in aqueous outflow—why does it matter? Exp Eye Res. 2009;88:729–737 [DOI] [PMC free article] [PubMed] [Google Scholar]
- 34. Johnson M, Chen A, Epstein DL, Kamm RD. The pressure and volume dependence of the rate of wash-out in the bovine eye. Curr Eye Res. 1991;10:373–375 [DOI] [PubMed] [Google Scholar]
- 35. Brubaker RF. Goldmann's equation and clinical measures of aqueous dynamics. Exp Eye Res. 2004;78:633–637 [DOI] [PubMed] [Google Scholar]
- 36. Scott PA, Overby DR, Freddo TF, Gong H. Comparative studies between species that do and do not exhibit the washout effect. Exp Eye Res. 2007;84:435–443 [DOI] [PMC free article] [PubMed] [Google Scholar]
- 37. Lu Z, Overby DR, Scott PA, Freddo TF, Gong H. The mechanism of increasing outflow facility by rho-kinase inhibition with Y-27632 in bovine eyes. Exp Eye Res. 2008;86:271–281 [DOI] [PMC free article] [PubMed] [Google Scholar]
- 38. Sultan M, Blondeau P. Episcleral venous pressure in younger and older subjects in the sitting and supine positions. J Glaucoma. 2003;12:370–373 [DOI] [PubMed] [Google Scholar]
- 39. Doyle JT, Patterson JL, Jr, Warren JV, Detweiler DK. Observations on the circulation of domestic cattle. Circ Res. 1960;8:4–15 [DOI] [PubMed] [Google Scholar]
- 40. Pang IH, Moll H, McLaughlin MA, et al. Ocular hypotensive and aqueous outflow-enhancing effects of AL-3037A (sodium ferri ethylenediaminetetraacetate). Exp Eye Res. 2001;73:815–825 [DOI] [PubMed] [Google Scholar]
- 41. Knepper PA, Collins JA, Frederick R. Effects of dexamethasone, progesterone, and testosterone on IOP and GAGs in the rabbit eye. Invest Ophthalmol Vis Sci. 1985;26:1093–1100 [PubMed] [Google Scholar]
- 42. Shepard AR, Jacobson N, Millar JC, et al. Glaucoma-causing myocilin mutants require the peroxisomal targeting signal-1 receptor (PTS1R) to elevate intraocular pressure. Hum Mol Genet. 2007;16:609–617 [DOI] [PubMed] [Google Scholar]
- 43. Kim BS, Savinova OV, Reedy MV, et al. Targeted disruption of the myocilin gene (Myoc) suggests that human glaucoma-causing mutations are gain of function. Mol Cell Biol. 2001;21:7707–7713 [DOI] [PMC free article] [PubMed] [Google Scholar]
- 44. Gould DB, Miceli-Libby L, Savinova OV, et al. Genetically increasing Myoc expression supports a necessary pathologic role of abnormal proteins in glaucoma. Mol Cell Biol. 2004;24:9019–9025 [DOI] [PMC free article] [PubMed] [Google Scholar]
- 45. Gould DB, Reedy M, Wilson LA, Smith RS, Johnson RL, John SW. Mutant myocilin nonsecretion in vivo is not sufficient to cause glaucoma. Mol Cell Biol. 2006;26:8427–8436 [DOI] [PMC free article] [PubMed] [Google Scholar]
- 46. Tamm ER. Myocilin and glaucoma: facts and ideas. Prog Retin Eye Res. 2002;21:395–428 [DOI] [PubMed] [Google Scholar]
- 47. Singh P, Carraher C, Schwarzbauer JE. Assembly of fibronectin extracellular matrix. Annu Rev Cell Dev Biol. 2010;26:397–419 [DOI] [PMC free article] [PubMed] [Google Scholar]
- 48. Bamberger CM, Bamberger AM, de Castro M, Chrousos GP. Glucocorticoid receptor beta, a potential endogenous inhibitor of glucocorticoid action in humans. J Clin Invest. 1995;95:2435–2441 [DOI] [PMC free article] [PubMed] [Google Scholar]
- 49. Oakley RH, Sar M, Cidlowski JA. The human glucocorticoid receptor beta isoform: expression, biochemical properties, and putative function. J Biol Chem. 1996;271:9550–9559 [DOI] [PubMed] [Google Scholar]
- 50. Zhang X, Clark AF, Yorio T. Heat shock protein 90 is an essential molecular chaperone for nuclear transport of glucocorticoid receptor beta. Invest Ophthalmol Vis Sci. 2006;47:700–708 [DOI] [PubMed] [Google Scholar]
- 51. Zhang X, Clark AF, Yorio T. FK506-binding protein 51 regulates nuclear transport of the glucocorticoid receptor beta and glucocorticoid responsiveness. Invest Ophthalmol Vis Sci. 2008;49:1037–1047 [DOI] [PMC free article] [PubMed] [Google Scholar]
- 52. Zhang X, Ognibene CM, Clark AF, Yorio T. Dexamethasone inhibition of trabecular meshwork cell phagocytosis and its modulation by glucocorticoid receptor beta. Exp Eye Res. 2007;84:275–284 [DOI] [PMC free article] [PubMed] [Google Scholar]
- 53. Zhang X, Clark AF, Yorio T. Regulation of glucocorticoid responsiveness in glaucomatous trabecular meshwork cells by glucocorticoid receptor-beta. Invest Ophthalmol Vis Sci. 2005;46:4607–4616 [DOI] [PubMed] [Google Scholar]
- 54. Schaaf MJ, Champagne D, van Laanen IH, et al. Discovery of a functional glucocorticoid receptor beta-isoform in zebrafish. Endocrinology. 2008;149:1591–1599 [DOI] [PubMed] [Google Scholar]
- 55. Hinds TD, Jr, Ramakrishnan S, Cash HA, et al. Discovery of glucocorticoid receptor-beta in mice with a role in metabolism. Mol Endocrinol. 2010;24:1715–1727 [DOI] [PMC free article] [PubMed] [Google Scholar]
Associated Data
This section collects any data citations, data availability statements, or supplementary materials included in this article.


