Abstract
In order to clarify the mechanism by polyphenols of protective effects against oxidative damage or by quinolinic acid of its neurotoxic and inflammatory actions, effects of polyphenols or quinolinic acid on the radical formation were examined. The ESR measurements showed that some polyphenols such as caffeic acid, catechol, gallic acid, D-(+)-catechin, L-dopa, chlorogenic acid and L-noradrenaline inhibited the formation of radicals in the reaction mixture of rat liver microsomes with ADP, Fe3+ and NADPH. The ESR measurements showed that α-picolinic acid, 2,6-pyridinedicarboxylic acid and quinolinic acid (2,3-pyridinedicarboxylic acid) enhanced the formation of radicals in the reaction mixture of rat liver microsomes with Fe3+ and NADPH. Caffeic acid and α-picolinic acid had no effects on the formation of radicals in the presence of EDTA, suggesting that the chelation of iron ion seems to be related to the inhibitory and enhanced effects. The polyphenols may exert protective effects against oxidative damage of erythrocyte membrane, ethanol-induced fatty livers, cardiovascular diseases, inflammatory and cancer through the mechanism. On the other hand, quinolinic acid may exert its neurotoxic and inflammatory effects because of the enhanced effect on the radical formation.
Keywords: caffeic acid, α-picolinic acid, microsomes, radical, iron ion
Introduction
Extensive electron spin resonance (ESR) spin-trapping studies have shown that free radicals form in the reactions of microsomes with a variety of organic compounds and pharmaceutics, such as ethanol,(1–3) carbon tetrachloride,(4) glycerol,(5) diethylnitrosamine(6) and ciprofloxacin.(7) An ESR spectrum was also obtained when liver microsomes from a malignant hyperthermia susceptible pig were incubated.(8) After chronic ethanol treatment, superoxide and hydroxyl radicals were also detected in microsomes in the presence of either NADPH or NADH.(1) Measurements of malondialdehyde showed that lipid peroxidation occurs in the microsomes incubated with iron ion,(9,10) suggesting that iron ion enhances lipid peroxidation in microsomes. Direct evidence for the free radical formation in isolated hepatocytes treated with FeSO4 (or ADP-FeCl3) was also obtained using ESR.(11)
Polyphenols are compounds which have two or more phenolic hydroxy groups in the molecule (Fig. 1). The polyphenols have been reported that they have protective effects against oxidative stresses. Naturally occurring plant phenols, caffeic acid (CA) and chlorogenic acid (CHL A) have been known to be inhibitors of the mutagenicity of bay-region diol epoxides of polycyclic aromatic hydrocarbons,(12) of retinoic acid 5,6-epoxidation,(13) of hydroxyl radical formation(14) and of lipid peroxidation.(15,16) Chlorogenic acid and CA also act as scavengers of superoxide radical, hydroxyl radical(17) and peroxy radical.(18) On the other hand, catechins show protective effects against oxidative damage of erythrocyte membrane,(19) ethanol-induced fatty livers,(20) cardiovascular diseases,(21,22) inflammatory(23) and cancer.(24) Catechins from Camellia sinenesis (green tea) decreases α-(4-pyridyl-1-oxide)-N-tert-butylnitrone (4-POBN)/radical adducts in bile of rats after transplantation of ethanol-induced fatty livers.(25) Liu and Mori reported that monoamine metabolites, i.e., L-noradrenaline (L-NA) and dopamine provide an antioxidant defense in the brain against oxidant and free radical-induced damage.(26) Dopamine and L-dopa inhibit the peroxidation of ox-brain phospholipids, with IC50 values of 8.5 µM for dopamine and 450 µM for L-dopa.(27) Galloyl derivatives work as highly efficient antioxidants against the chemically induced LDL oxidation.(28) Their antioxidative activities are achieved through the preventing the formation of the free radical by catechol moiety.(29)
Fig. 1.
Chemical structure of the CA and CA related compounds.
Quinolinic acid (2,3-pyridinedicarboxylic acid) (QUIN) is a tryptophan metabolite of the kynurenine pathway (Fig. 2). It is a potent excitant of neurones in the rat brain and acts preferentially on N-methyl-D-aspartate receptor.(30) Intracerebral injection of QUIN reproduces the pathological features of Huntington’s disease such as γ-aminobutyric acid depletion and striatal spiny cell loss.(31,32) While, QUIN seems to play an important role in neurodegenerative inflammatory and infectious disease. Markedly increased concentrations of QUIN were found in both lumbar cerebrospinal fluid and post-mortem brain tissue of patients with inflammatory disease (bacterial, viral, fungal and parasitic infections, meningitis, autoimmune disease, and septicaemia).(33) Heyes et al.(34) reported the significant correlations between the magnitude of the increases in cerebrospinal fluid QUIN and the degree of neuropsychological deficits in HIV-infected patients. The delayed increases in the levels of the N-methyl-D-aspartate receptor agonist, QUIN, also occur in brain following transient ischemia in the gerbil.(35) The mechanism by which QUIN exerts its neurotoxic effects has been ascribed to its ability to induce excessive activation of N-methyl-D-aspartate receptors, calcium channels opening and consequent massive calcium entry into the cell.(36) In addition to these mechanism, Rios and Santamaria have reported the involvement of lipid peroxidation and oxidative stress in the QUIN-induced lesions.(37,38) Furthermore, Shoham et al.(39) have shown that after single unilateral injections of QUIN into rat ventral-striatal region, irons accumulate in high concentrations in basal ganglia area such as globus pallidus and substantia nigra pars reticulate. Thus, the relationship among the ions, QUIN, and the lipid peroxidation should be clarified. On the other hand, α-picolinic acid (2-pyridinecarboxylic acid) (2-PCA) was isolated from the culture liquids of blast mould (Piricularia oryxae CAVARA) as a toxic substance, possessing a marked growth-inhibitory action on rice seeding.(40) α-Picolinic acid was proved to be contained in the rice plant attacked with blast disease.(41) 2,6-Pyridinedicarboxylic acid (2,6-PDCA) is an antiseptic which is produced by Baciiius subtitis.
Fig. 2.
Chemical structure of the 2-PCA and 2-PCA related compounds.
In this study, the effects of CA and its related compounds such as vanilic acid (VA), quinic acid (QA), catechol (CAT), gallic acid (GA), salicylic acid (SA), D-(+)-catechin (D-CAT), ferulic acid (FA), L-dopa, CHL A and L-NA on the formation of 4-POBN/hydroxypentyl radical adduct and 4-POBN/ethyl radical adduct in the reaction mixture of rat liver microsomes with ADP, Fe3+ and NADPH were examined (Fig. 1). The effects of 2-PCA and its related compounds such as QUIN, 2,6-PDCA, nicotinic acid (3-PCA) and kynurenic acid (KYNA) on the formation of 4-POBN/hydroxypentyl radical adduct and 4-POBN/ethyl radical in the reaction mixture of rat liver microsomes with Fe3+ and NADPH were also examined (Fig. 2).
Materials and Methods
Chemicals
Caffeic acid, VA, QA, CAT, GA, D-CAT, FA, L-dopa, CHL A, L-NA, QUIN and 4-POBN, a spin-trapping reagent were purchased from Tokyo Kasei Kogyo, Ltd. (Tokyo, Japan). α-Picolinic acid, 2,6-PDCA, 3-PCA, ADP and NADPH were from Wako Pure Chem. Ind., Ltd. (Osaka, Japan). Salicylic acid was purchased from Katayama Chemical, Ltd. Kynurenic acid was purchased from Nacalai Tesque (Kyoto Japan). All other chemicals used were of analytical grade.
Preparation of rat liver microsomes
Male Sprague-Dawley rats, body weight 344–350 g, were used in the experiments. The rat livers were removed immediately after decapitation. The livers were homogenized in 9 volumes of 0.25 M sucrose. The liver homogenate was centrifuged at 16,000 g for 30 min at 4°C. The supernatant fraction was then centrifuged at 120,000 g for 30 min at 4°C. The pallet was suspended in 0.15 M KCl and then centrifuged twice again at 120,000 g. The pallet was suspended in 0.15 M KCl. Protein concentration of the suspension was 3.01 mg/ml. It was kept at –80°C before use.
The control reaction mixture (I)
The control reaction mixture (I) contained 0.1 M 4-POBN, 0.75 mg/ml protein rat microsomal suspension, 20 mM ADP, 0.1 mM FeCl3 and 1 mM NADPH in 25 mM phosphate buffer (pH 7.4). The reaction was started by adding NADPH and performed for 60 min at 37°C for the ESR and HPLC-ESR experiments.
The control reaction mixture (II)
The control reaction mixture (II) contained 0.1 M 4-POBN, 0.75 mg/ml protein rat microsomal suspension, 0.1 mM FeCl3 and 1 mM NADPH in 25 mM phosphate buffer (pH 7.4). The reaction was started by adding NADPH and performed for 60 min at 37°C for the ESR and HPLC-ESR experiments.
ESR measurements
The ESR spectra were obtained using a model JES-FR30 Free Radical Monitor (JEOL Ltd., Tokyo, Japan). Aqueous samples were aspirated into a Tefron tube centered in a microwave cavity. Operating conditions of the ESR spectrometer were: power, 4 mW; modulation width, 0.1 mT; sweep time, 4 min; sweep width, 10 mT; time constant, 0.3 sec. Magnetic fields were calculated by the splitting of MnO (ΔH3-4 = 8.69 mT).
Ultraviolet-visible absorption spectra
Ultraviolet-visible absorption spectra were measured using a model UV-160A ultraviolet-visible spectrophotometer (Shimadzu Co., Kyoto, Japan). The spectrophotometer was operated from 300 nm to 800 nm. The measurements were performed at 25°C. In the reference cell, water was contained. The sample solution (I) consisted of 25 mM phosphate buffer (pH 7.4), 37.5 mM KCl, 1.5 mM CA and 0.15 mM Fe3+ with or without 10 mM EDTA. The sample solution (II) consisted of 7 mM 2-PCA, 1.4 mM Fe2+ and 1.4 mM phosphate buffer with or without 1.75 mM EDTA.
HPLC-ESR chromatography
An HPLC used in the HPLC-ESR consisted of a model 7125 injector (Reodyne, Cotari, CA, USA) and a model 655A-11 pump with a model L-5000 LC controller (Hitachi Ltd., Ibaragi, Japan). A semi-preparative column (300 mm long × 10 mm i.d.) packed with TSKgel ODS-120T (TOSOH Co., Tokyo, Japan) was used. Flow rate was 2.0 ml/min throughout the experiments. For the HPLC-ESR, two solvents were used: solvent A, 50 mM acetic acid; solvent B, 50 mM acetic acid/acetonitrile (20:80, v/v). A following combination of isocratic and linear gradient was used: 0–40 min, 100–20% A (linear gradient); 40–60 min, 80% B (isocratic). The eluent was introduced into a model JES-FR30 Free Radical Monitor. The ESR spectrometer was connected to the HPLC with a Teflon tube, which passed through the center of the ESR cavity. The operating conditions of the ESR spectrometer were: power, 4 mW; modulation width, 0.2 mT; time constant, 1 s. The magnetic field was fixed at the third peak in the doublet-triplet ESR spectrum (αN = 1.58 mT and αHβ = 0.26 mT) of the 4-POBN radical adduct.
Results
ESR measurements of the control reaction mixture (I) with CA
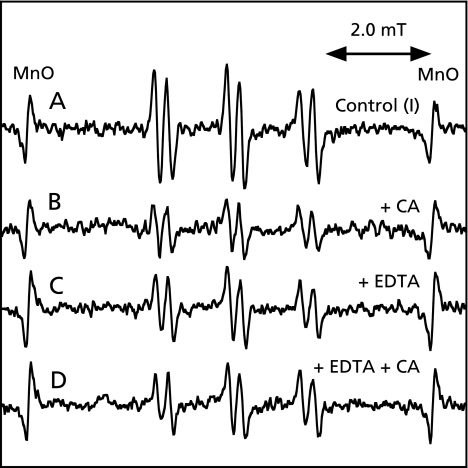
An ESR spectrum of the control reaction mixture (I) was measured. A prominent ESR spectrum (αN = 1.58 mT and αHβ = 0.26 mT) was observed in the control reaction mixture (I) (Fig. 3A). The peak height of the ESR signal decreased to 50.0 ± 8.7% of the control reaction mixture (I) on addition of 1 mM CA (Fig. 3B). A prominent ESR spectrum (αN = 1.58 mT and αHβ = 0.26 mT) was also observed in the control reaction mixture (I) with 1 mM EDTA (Fig. 3C). The peak height of the ESR signal was hardly changed in the control reaction mixture (I) with 1 mM EDTA on addition of 1 mM CA (Fig. 4D).
Fig. 3.
ESR spectra of the reaction mixtures of rat liver microsomes with ADP, Fe3+ and NADPH. The reaction and ESR conditions were as described in Materials and Methods. Total volume of the reaction mixtures was 200 µl. A, a control reaction mixture (I) of rat liver microsomes with ADP, Fe3+ and NADPH; B, same as in A except that 1 mM CA was added; C, same as in A except that 1 mM EDTA was added; D, same as in A except that 1 mM EDTA and 1 mM CA.
Fig. 4.
Concentration dependence of CA or CA with EDTA on the ESR peak height. The reaction and ESR conditions were as described in the Materials and Methods. A, various concentrations of CA were added to the control reaction mixture (I). Values in longitudinal axis were % of control reaction mixture (I). B, various concentrations of CA were added to the control reaction mixture (I) with 1 mM EDTA. Values in longitudinal axis were % of control reaction mixture (I) with 1 mM EDTA.
Concentration dependence of CA on the formation of radicals in the control reaction mixture (I) or in the control reaction mixture (I) with EDTA
Caffeic acid inhibited the formation of radicals in a concentration dependent manner in the control reaction mixture (I) (Fig. 4A). While, no effect was obtained on the formation of radicals in the control reaction mixture (I) with 1 mM EDTA (Fig. 4B).
Effects of some polyphenols on the formation of radicals in the control reaction mixture (I)
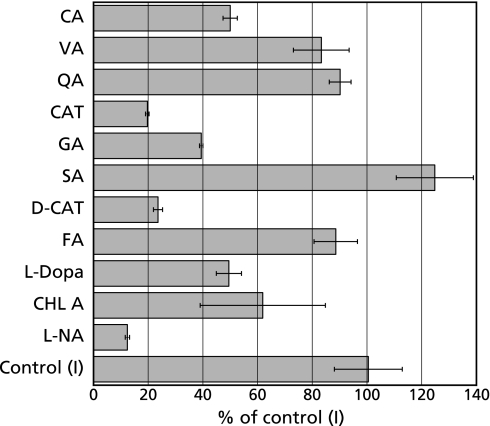
In order to examine the effects of some polyphenols on the formation of radicals in the control reaction mixture (I), ESR spectrum of the control reaction mixture (I) with 1 mM CA or 1 mM VA or 1 mM QA or 1 mM CAT or 1 mM GA or 1 mM SA or 1 mM D-CAT or 1 mM FA or 1 mM L-dopa or 1 mM CHL A or 1 mM L-NA was measured (Fig. 5). In the presence of polyphenols, the peak height of the ESR signal decreased to 50.0 ± 8.7% (1 mM CA), 19.7 ± 0.6% (1 mM CAT), 39.4 ± 0.65% (1 mM GA), 23.6 ± 1.6% (1 mM D-CAT), 49.5 ± 9.2% (1 mM L-dopa), 61.9 ± 22.9% (1 mM CHL A) and 12.4 ± 0.8% (1 mM L-NA) of the control reaction mixture (I), respectively.
Fig. 5.
Effects of CA and CA related compounds on the formation of radicals in the control reaction mixtures (I). The ESR spectra were observed for the control reaction mixture (I) with 1 mM CA (or VA, or QA, or CAT, or GA, or SA, or D-CAT, or FA, or L-dopa, or CHL A, or L-NA). The reaction was started by adding 1 mM NADPH. The reaction was performed for 60 min at 37°C. Signal intensities were evaluated from the peak height of the third ESR signal. The control value 100% represents the level of 4-POBN radical adducts formed in the absence of the compounds. The respective values are means ± SD of three determinations. Reaction and ESR conditions were as described in the Materials and Methods.
Ultraviolet-visible absorption spectra of ferric ion with CA
To clarify the mechanism of the inhibition on the formation of radicals in the reaction mixture, ultraviolet-visible absorption spectra were measured for the mixture of Fe3+ with CA and EDTA. The solution of only 1.5 mM CA (or 0.15 mM Fe3+) and the mixture of 1.5 mM CA with 0.15 mM Fe3+ and 1 mM EDTA showed no prominent absorption in the visible region (Fig. 6 B–D). On the other hand, the mixture of 1.5 mM CA with 0.15 mM Fe3+ showed a prominent visible band with a λmax at 594 nm (Fig. 6A).
Fig. 6.
Ultraviolet-visible absorption spectra of the mixtures. The conditions of the ultraviolet-visible absorption measurements were as described in Materials and Methods. A, 0.15 mM Fe3+ + 1.5 mM CA; B, 0.15 mM Fe3+ + 10 mM EDTA + 1.5 mM CA; C, 1.5 mM CA; D, 0.15 mM Fe3+.
HPLC-ESR analyses of the control reaction mixture (I) and control reaction mixture (I) with CA
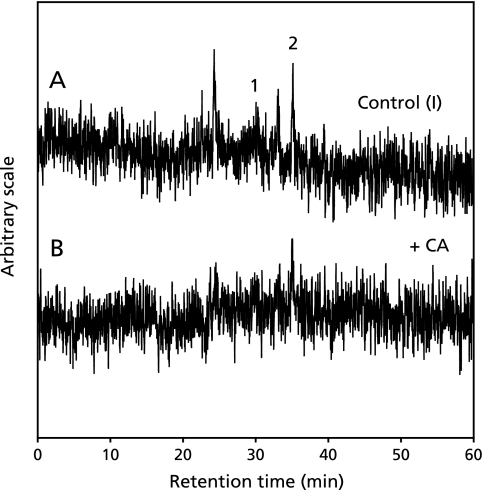
In order to know the effect of CA on the formation of radicals in the control reaction mixture (I), the HPLC-ESR analyses were performed for the control reaction mixture (I) and control reaction mixture (I) with 1 mM CA. On the HPLC-ESR elution profile of the control reaction mixture (I), two prominent peaks which were assigned as hydroxypentyl radical and ethyl radical in the previous study(43) were separated at the retention times of 30.3 and 35.1 min respectively (Fig. 7A). When 1 mM CA was added to the control reaction mixture (I), the respective peak height decreased (Fig. 7B).
Fig. 7.
The HPLC-ESR analysis of control reaction mixture (I) and control reaction mixture (I) with 1 mM CA. The reaction and HPLC-ESR conditions were as described in the Materials and Methods. A, 3 ml of control reaction mixture (I); B, 3 ml of control reaction mixture (I) with 1 mM CA. The peak 1 is hydroxypentyl radical and the peak 2 is ethyl radical.
ESR measurement of the control reaction mixture (II)
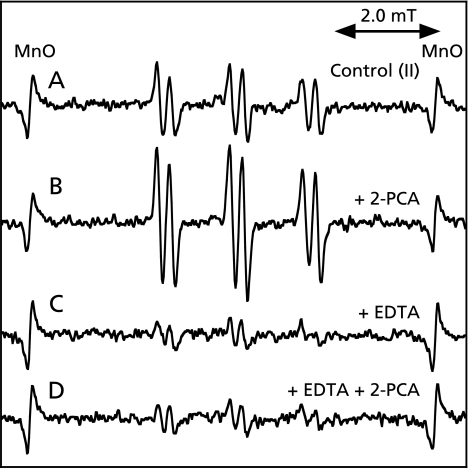
An ESR spectrum of the control reaction mixture (II) was measured. A prominent ESR spectrum (αN = 1.58 mT and αHβ = 0.26 mT) was observed in the control reaction mixture (II) (Fig. 8A). The peak height of the ESR signal increased to 180.4 ± 16.7% of the complete reaction mixture (II) in the presence of 0.2 mM 2-PCA (Fig. 8B). A prominent ESR spectrum (αN = 1.58 mT and αHβ = 0.26 mT) was also observed in the control reaction mixture (II) with 1 mM EDTA (Fig. 8C). The peak height of the ESR signal was hardly changed in the control reaction mixture (II) with 1 mM EDTA on addition of 0.2 mM 2-PCA (Fig. 8D).
Fig. 8.
ESR spectra of the control reaction mixture (II). The reaction and ESR conditions were as described in Materials and Methods. Total volume of the reaction mixtures was 200 µl. A, a control reaction mixture (II); B, same as in A except that 0.2 mM 2-PCA was added; C, same as in A except that 1 mM EDTA was added; D, same as in A except that 1 mM EDTA and 0.2 mM 2-PCA were added.
Concentration dependence of 2-PCA on the formation of radicals in the control reaction mixture (II) or in the control reaction mixture (II) with EDTA
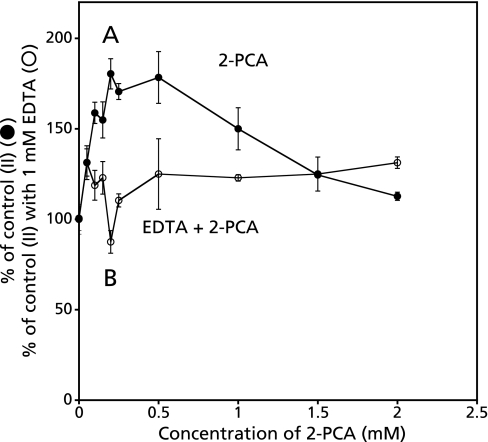
α-Picolinic acid enhanced the formation of radicals in the control reaction mixture (II) in a concentration dependent manner. The peak height of ESR signal increased with increasing concentration of 2-PCA. The peak height of ESR signal reached to the maximum at the concentration of 0.2 mM and gradually decreased (Fig. 9A). While, no effect was obtained on the formation of radicals in the control reaction mixture (II) with 1 mM EDTA (Fig. 9B).
Fig. 9.
Concentration dependence of 2-PCA or 2-PCA with EDTA on the ESR peak height. The reaction and ESR conditions were as described in the Materials and Methods. A, various concentration of 2-PCA was added to the control reaction mixture (II). Values in longitudinal axis were % of control reaction mixture (II), B, various concentration of 2-PCA was added to the control reaction mixture (II) in the presence of 1 mM EDTA. Values in longitudinal axis were % of control reaction mixture (II) with 1 mM EDTA.
Concentration dependence of QUIN, 2,6-PDCA, 3-PCA and KYNA on the formation of radicals in the control reaction mixture (II)
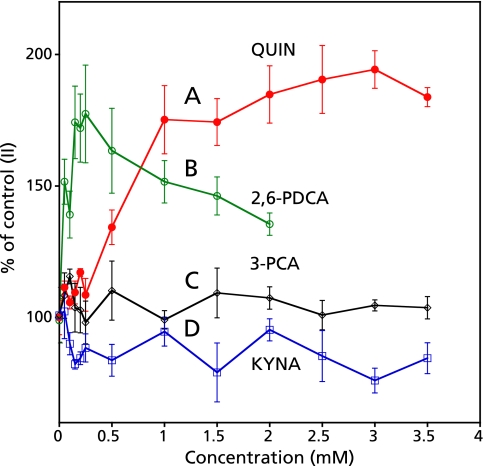
The peak height of ESR signal increased with the increase of the concentration of QUIN in the control reaction mixture (II) (Fig. 10A). The peak height of ESR signal in the control reaction mixture (II) increased with the increase of the concentration of 2,6-PDCA and reached to the maximum at the concentration of 0.25 mM and gradually decreased (Fig. 10B). On the other hand, no effect was obtained on the formation of radicals in the control reaction mixture (II) with the increase of the concentration of 3-PCA and KYNA (Fig. 10 C and D).
Fig. 10.
Concentration dependence of QUIN, 2,6-PDCA, 3-PCA and KYNA on the ESR peak height. The reaction and ESR conditions were as described in the Materials and Methods. Various concentration of QUIN (A), 2,6-PDCA (B), 3-PCA (C) and KYNA (D) was added to the control reaction mixture (II). Values in longitudinal axis were% of control reaction mixture (II).
Ultraviolet-visible absorption spectra of ferrous ion with 2-PCA and EDTA
To clarify the mechanism of the enhancement on the formation of radicals in the reaction mixture, ultraviolet-visible absorption spectra were measured for the mixture of ferrous ions with 2-PCA and EDTA. The mixture of 7 mM 2-PCA with 1.4 mM Fe3+ and 1.4 mM NADPH showed a prominent visible band with a λmax at 514 nm (Fig. 11B). The mixture of 1.4 mM Fe2+ and 7 mM 2-PCA showed a similar characteristic visible spectrum with a λmax at 450 nm was observed (Fig. 11A). The difference of the λmax may be related to the residual Fe3+ in the mixture of 7 mM 2-PCA with 1.4 mM Fe3+ and 1.4 mM NADPH. On the other hand, the mixture of 7 mM 2-PCA with 1.4 mM Fe3+, 1.4 mM NADPH and 1.75 mM EDTA showed no prominent absorption in the visible region (Fig. 11C).
Fig. 11.
Ultraviolet-visible absorption spectra of the mixture containing ferrous ion, 2-PCA and EDTA. The condition of the ultraviolet-visible absorption measurements were as described in Materials and Methods.
A, 1.4 mM Fe2+ + 7 mM 2-PCA; B, 1.4 mM Fe3+ + 1.4 mM NADPH + 7 mM 2-PCA; C, 1.4 mM Fe3+ + 1.4 mM NADPH + 1.7 mM EDTA + 7 mM 2-PCA.
HPLC-ESR analyses of the control reaction mixture (II) and control reaction mixture (II) with 2-PCA
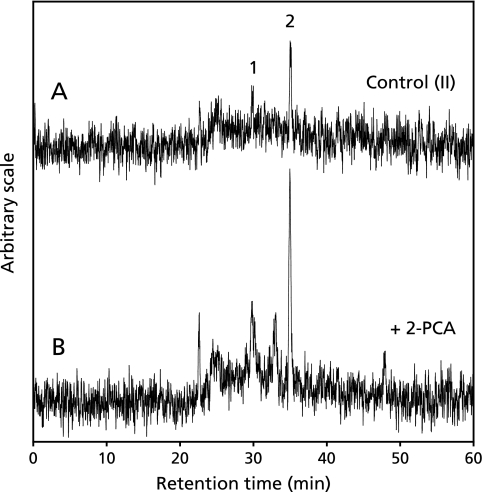
In order to know the effect of 2-PCA on the formation of radicals in the control reaction mixture (II), the HPLC-ESR analyses were performed for the control reaction mixture(II) and control reaction mixture (II) with 0.2 mM 2-PCA. On the HPLC-ESR elution profile of the control reaction mixture (II), two prominent peaks which were assigned as hydroxypentyl radical and ethyl radical in the previous study(42) were separated at the retention times of 30.3 and 35.1 min respectively (Fig. 12A). When 0.2 mM 2-PCA was added to the control reaction mixture (II), the respective peak heights increased (Fig. 12B).
Fig. 12.
The HPLC-ESR analyses of control reaction mixture (II) and control reaction mixture (II) with 0.2 mM 2-PCA. The reaction and HPLC-ESR condition were as described in the Materials and Methods. A, 3 ml of control reaction mixture (II); B, 3 ml of control reaction mixture (II) with 0.2 mM 2-PCA. The peak 1 is hydroxypentyl radical and the peak 2 is ethyl radical.
Discussion
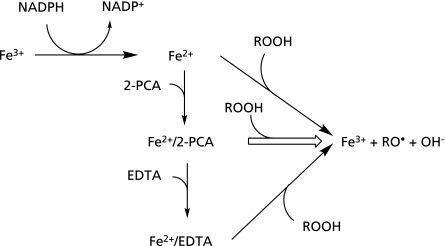
Our previous study showed the formation of hydroxypentyl radical and ethyl radical in the reaction mixture of rat liver microsomes with ADP, Fe3+ and NADPH(42) (Fig. 13) (Eqs. 1–3).
Fig. 13.
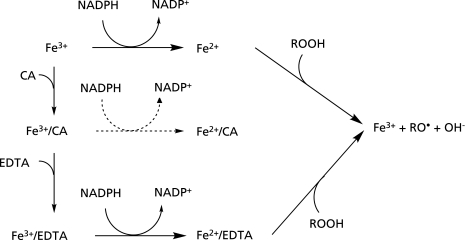
A possible mechanism for the inhibitory effect on the formation of radicals in the control mixture (I).
| (1) |
| Fe3+ + NADPH → Fe2+ + NADP+ | (2) |
| Fe2+ + ROOH → Fe3+ + RO• + OH− | (3) |
In this study, the effects of CA and its related compounds on the formation of 4-POBN/hydroxypentyl radical adduct and 4-POBN/ethyl radical adduct were examined for the same reaction mixture as the previous study.(42) The formation of 4-POBN/hydroxypentyl radical adduct and 4-POBN/ethyl radical adduct were inhibited by some polyphenols such as CA, CAT, GA, D-CAT, L-dopa, CHL A and L-NA (Fig. 5). VA, QA, SA and FA showed no inhibitory effect. Visible absorption analyses showed a characteristic visible spectrum with λmax at 594 nm for the mixture of Fe3+ with CA in the absence of EDTA, while the mixture of Fe3+ ions with CA did not show the visible spectrum in the presence of EDTA (Fig. 6). Some papers have reported the formation of the Fe3+/CA complex(14,43) which showed a characteristic visible spectrum (Fig. 13) (Eq. 4).
| Fe3+ + CA → Fe3+/CA | (4) |
The Fe3+/CA complex does not form in the presence of EDTA because EDTA, a potent iron ion chelator, removes iron ion in the Fe3+/CA complex (Fig. 13) (Eq. 5).
| Fe3+/CA + EDTA → Fe3+/EDTA + CA | (5) |
Thus, the characteristic visible spectrum with λmax at 594 nm is due to the Fe3+/CA complex. Caffeic acid and caffeic acid derivatives seem to stabilize the Fe3+ state through the formation of Fe3+/CA complex. A reduction of Fe3+/CA to Fe2+/CA is hard to proceed (Fig. 13). Thus, some polyphenols such as CA, CAT, GA, D-CAT, L-dopa, CHL A and L-NA inhibited the formation of 4-POBN/hydroxypentyl radical adduct and 4-POBN/ethyl radical adduct because their catechol moiety chelates the Fe3+. Since catechol moieties do not occur in VA, QA, SA and FA, the inhibitory effect could not be observed (Fig. 1). These inhibitory effects on the formation of radicals by polyphenols may be related to the protective effects against oxidative damage of oxidative damage of erythrocyte membrane,(19) ethanol-induced fatty livers,(20) cardiovascular diseases,(21,22) inflammatory(23) and cancer.(24)
In this study, the effect of 2-PCA and its related compounds on the formation of 4-POBN/hydroxypentyl radical adduct and 4-POBN/ethyl radical adduct were also examined for the control reaction mixture (II). The formation of 4-POBN/hydroxypentyl radical adduct and 4-POBN/ethyl radical adduct were enhanced by 2-PCA, QUIN and 2,6-PDCA (Fig. 9 and 10). Nicotinic acid and KYNA showed no enhanced effect. Visible absorption analyses showed a characteristic visible spectrum with λmax at 514 nm for the mixture containing Fe3+, NADPH and 2-PCA in the absence of EDTA, while the mixture of Fe3+, NADPH and 2-PCA did not show the visible spectrum in the presence of EDTA. The similar characteristic visible spectrum was observed for the mixture of Fe2+ and 2-PCA (Fig. 11). Thus, the characteristic visible spectrum with λmax at 514 nm is due to the Fe2+/2-PCA complex (Fig. 14) (Eq. 6).
Fig. 14.
A possible mechanism for the enhanced effect on the formation of radicals in the control mixture (II).
| Fe2+ + 2-PCA → Fe2+/2-PCA | (6) |
The reaction of Fe2+/2-PCA with ROOH could be fast(44) (Fig. 14) (Eq. 7).
| Fe2+/2-PCA + ROOH → Fe3+ + RO• + OH− + 2-PCA | (7) |
The enhanced effect of 2-PCA, QUIN and 2,6-PDCA is possibly induced through the Fe2+/2-PCA complex formation. The three compounds such as 2-PCA, QUIN and 2,6-PDCA, have a common chemical structure, a 2-pyridinecarboxylic acid moiety in the molecules. The two adjacent atoms in the 2-pyridinecarboxylic acid moiety, i.e. the nitrogen atom in pyridine ring and the oxygen atom in the carboxy group, seem to be participate in the chelation of Fe2+ ion. Nicotinic acid and KYNA did not enhance the reaction. Since 2-pyridinecarboxylic acid moieties do not occur in 3-PCA, 3-PCA may not form the complex with Fe2+. The KYNA also cannot form the complex with Fe2+ ions, because its keto-form, a predominant tautomer, is protonated at the nitrogen atom (Fig. 2).
α-Picolinic acid and 2-PCA derivative seem to induce the reduction of Fe3+ through the formation of Fe2+/2-PCA complex. α-Picolinic acid and 2-PCA derivative consequently enhance the formation of radicals. On the other hand, since Fe2+/2-PCA complex is stabilized to a great extent at the high concentration of 2-PCA, the reaction (Eq. 7) seem to be hard to proceed. Therefore, the ESR peak height reached to the control level at the high concentration of 2-PCA and 2,6-PDCA (Fig. 9 and 10). These enhanced effects on the formation of radicals by quinolinic acid may be related to its neurotoxic and inflammatory actions(30–39) or by α-picolinic acid may be related to its marked growth-inhibitory action on rice seeding.(40)
Abbreviations
- ADP
adenosine 5'-diphosphate
- CA
caffeic acid
- D-CAT
D-(+)-catechin
- CAT
catechol
- CHL A
chlorogenic acid
- ESR
electron spin resonance
- FA
ferulic acid
- GA
gallic acid
- HPLC-ESR
high performance liquid chromatography-electron spin resonance
- KYNA
kynurenic acid
- 3-PCA
nicotinic acid
- NADPH
nicotinamide adenine dinucleotide phosphate
- L-NA
L-noradrenaline
- 2-PCA
α-picolinic acid
- 2,6-PDCA
2,6-pyridinedicarboxylic acid
- 4-POBN
α-(4-pyridyl-1-oxide)-N-tert-butylnitrone
- QA
quinic acid
- QUIN
quinolinic acid
- SA
salicylic acid
- VA
vanillic acid
References
- 1.Rashba-Step J, Turro NJ, Cederbaum AI. Increased NADPH- and NADH-dependent production of superoxide and hydroxyl radical by microsomes after chronic ethanol treatment. Arch Biochem Biophys. 1993;300:401–408. doi: 10.1006/abbi.1993.1054. [DOI] [PubMed] [Google Scholar]
- 2.Stoyanovsky DA, Cederbaum AI. ESR and HPLC-EC analysis of ethanol oxidation to 1-hydroxyethyl radical: rapid reduction and quantification of POBN and PBN nitroxides. Free Radic Biol Med. 1998;25:536–545. doi: 10.1016/s0891-5849(98)00081-1. [DOI] [PubMed] [Google Scholar]
- 3.Albano E, Tomasi A, Persson JO, et al. Role of ethanol-inducible cytochrome P450 (P450IIE1) in catalysing the free radical activation of aliphatic alcohols. Biochem Pharmacol. 1991;41:1895–1902. doi: 10.1016/0006-2952(91)90129-s. [DOI] [PubMed] [Google Scholar]
- 4.Connor HD, Thurman RG, Chen G, Poyer JL, Janzen EG, Mason RP. Clarification of the relationship between free radical spin trapping and carbon tetrachloride metabolism in microsomal systems. Free Radic Biol Med. 1998;24:1364–1368. doi: 10.1016/s0891-5849(97)00460-7. [DOI] [PubMed] [Google Scholar]
- 5.Rashba-Step J, Step E, Turro NJ, Cederbaum AI. Oxidation of glycerol to formaldehyde by microsomes: are glycerol radicals produced in the reaction pathway? Biochemistry. 1994;33:9504–9510. doi: 10.1021/bi00198a016. [DOI] [PubMed] [Google Scholar]
- 6.Yamada K, Yamamiya I, Utsumi H. In vivo detection of free radicals induced by diethylnitrosamine in rat liver tissue. Free Radic Biol Med. 2006;40:2040–2046. doi: 10.1016/j.freeradbiomed.2006.01.031. [DOI] [PubMed] [Google Scholar]
- 7.Gürbay A, Gonthier B, Daveloose D, Favier A, Hincal F. Microsomal metabolism of ciprofloxacin generates free radicals. Free Radic Biol Med. 2001;30:1118–1121. doi: 10.1016/s0891-5849(01)00508-1. [DOI] [PubMed] [Google Scholar]
- 8.Duthie GG, McPhail DB, Arthur JR, Goodman BA, Morrice PC. Spin trapping of free radicals and lipid peroxidation in microsomal preparations from malignant hyperthermia susceptible pigs. Free Radic Res Commun. 1990;8:93–99. doi: 10.3109/10715769009087979. [DOI] [PubMed] [Google Scholar]
- 9.Fontecave M, Jaouen M, Mansuy D, Costa D, Zalma R, Pezerat H. Microsomal lipid peroxidation and oxy-radicals formation are induced by insoluble iron-containing minerals. Biochem Biophys Res Commun. 1990;173:912–918. doi: 10.1016/s0006-291x(05)80872-1. [DOI] [PubMed] [Google Scholar]
- 10.Wills ED. Lipid peroxide formation in microsomes. The role of non-haem iron. Biochem J. 1969;113:325–332. doi: 10.1042/bj1130325. [DOI] [PMC free article] [PubMed] [Google Scholar]
- 11.Poli G, Chiarpotto E, Albano E, Biasi F, Cecchini G, Dianzani MU. Iron overload: Experimental approach using rat hepatocytes in single cell suspension. Front Gastrointest Res. 1986;9:38–49. [Google Scholar]
- 12.Wood AW, Huang MT, Chang RL, et al. Inhibition of the mutagenicity of bay-region diol epoxides of polycyclic aromatic hydrocarbons by naturally occurring plant phenols: exceptional activity of ellagic acid. Proc Natl Acad Sci USA. 1982;79:5513–5517. doi: 10.1073/pnas.79.18.5513. [DOI] [PMC free article] [PubMed] [Google Scholar]
- 13.Iwahashi H, Negoro Y, Ikeda A, Morishita H, Kido R. Inhibition by chlorogenic acid of haematin-catalysed retinoic acid 5,6-epoxidation. Biochem J. 1986;239:641–646. doi: 10.1042/bj2390641. [DOI] [PMC free article] [PubMed] [Google Scholar]
- 14.Iwahashi H, Ishii T, Sugata R, Kido R. The effects of caffeic acid and its related catechols on hydroxyl radical formation by 3-hydroxyanthranilic acid, ferric chloride, and hydrogen peroxide. Arch Biochem Biophys. 1990;276:242–247. doi: 10.1016/0003-9861(90)90033-u. [DOI] [PubMed] [Google Scholar]
- 15.Chen JH, Ho C. Antioxidant activities of caffeic acid and its related hydroxycinnamic acid compounds. J Agric Food Chem. 1997;45:2374–2378. [Google Scholar]
- 16.Yoshino M, Murakami K. Interaction of iron with polyphenolic compounds: application to antioxidant characterization. Anal Biochem. 1998;257:40–44. doi: 10.1006/abio.1997.2522. [DOI] [PubMed] [Google Scholar]
- 17.Kono Y, Kobayashi K, Tagawa S, et al. Antioxidant activity of polyphenolics in diets. Rate constants of reactions of chlorogenic acid and caffeic acid with reactive species of oxygen and nitrogen. Biochim Biophys Acta. 1997;1335:335–342. doi: 10.1016/s0304-4165(96)00151-1. [DOI] [PubMed] [Google Scholar]
- 18.Terao J, Karasawa H, Arai H, Nagao A, Suzuki T, Takama K. Peroxyl radical scavenging activity of caffeic acid and its related phenolic compounds in solution. Biosci Biotech Bioche. 1993;57:1204–1205. doi: 10.1271/bbb.57.1204. [DOI] [PubMed] [Google Scholar]
- 19.Ferrali M, Signorini C, Caciotti B, et al. Protection against oxidative damage of erythrocyte membrane by the flavonoid quercetin and its relation to iron chelating activity. FEBS Lett. 1997;416:123–129. doi: 10.1016/s0014-5793(97)01182-4. [DOI] [PubMed] [Google Scholar]
- 20.Kashima M. Effects of catechins on superoxide and hydroxyl radical. Chem Pharm Bull. 1999;47:279–283. doi: 10.1248/cpb.47.279. [DOI] [PubMed] [Google Scholar]
- 21.Renaud S, De Lorgeril M. Wine, alcohol, platelets, and the French paradox for coronary heart disease. Lancet. 1992;339:1523–1526. doi: 10.1016/0140-6736(92)91277-f. [DOI] [PubMed] [Google Scholar]
- 22.Hertog MG, Feskens EJ, Hollman PC, Katan MB, Kromhout D. Dietary antioxidant flavonoids and risk of coronary heart disease: the Zutphen Elderly Study. Lancet. 1993;342:1007–1011. doi: 10.1016/0140-6736(93)92876-u. [DOI] [PubMed] [Google Scholar]
- 23.Middleton E, Jr., Kandaswami C. Effects of flavonoids on immune and inflammatory cell functions. Biochem Pharmacol. 1992;43:1167–1179. doi: 10.1016/0006-2952(92)90489-6. [DOI] [PubMed] [Google Scholar]
- 24.Brown JP. A review of the genetic effects of naturally occurring flavonoids, anthraquinones and related compounds. Mutat Res. 1980;75:243–277. doi: 10.1016/0165-1110(80)90029-9. [DOI] [PubMed] [Google Scholar]
- 25.Zhong Z, Connor HD, Froh M, et al. Polyphenols from Camellia sinenesis prevent primary graft failure after transplantation of ethanol-induced fatty livers from rats. Free Radic Biol Med. 2004;36:1248–1258. doi: 10.1016/j.freeradbiomed.2004.02.012. [DOI] [PubMed] [Google Scholar]
- 26.Liu J, Mori A. Monoamine metabolism provides an antioxidant defense in the brain against oxidant- and free radical-induced damage. Arch Biochem Biophys. 1993;302:118–127. doi: 10.1006/abbi.1993.1189. [DOI] [PubMed] [Google Scholar]
- 27.Spencer JP, Jenner A, Butler J, et al. Evaluation of the pro-oxidant and antioxidant actions of L-DOPA and dopamine in vitro: implications for Parkinson’s disease. Free Radic Res. 1996;24:95–105. doi: 10.3109/10715769609088005. [DOI] [PubMed] [Google Scholar]
- 28.Baratto MC, Tattini M, Galardi C, et al. Antioxidant activity of galloyl quinic derivatives isolated from P. lentiscus leaves. Free Radic Res. 2003;37:405–412. doi: 10.1080/1071576031000068618. [DOI] [PubMed] [Google Scholar]
- 29.Guo Q, Zhao B, Li M, Shen S, Xin W. Studies on protective mechanisms of four components of green tea polyphenols against lipid peroxidation in synaptosomes. Biochim Biophys Acta. 1996;1304:210–222. doi: 10.1016/s0005-2760(96)00122-1. [DOI] [PubMed] [Google Scholar]
- 30.Stone TW, Perkins MN. Quinolinic acid: a potent endogenous excitant at amino acid receptors in CNS. Eur J Pharmacol. 1981;72:411–412. doi: 10.1016/0014-2999(81)90587-2. [DOI] [PubMed] [Google Scholar]
- 31.Schwarcz R, Whetsell WO, Jr., Mangano RM. Quinolinic acid: an endogenous metabolite that produces axon-sparing lesions in rat brain. Science. 1983;219:316–318. doi: 10.1126/science.6849138. [DOI] [PubMed] [Google Scholar]
- 32.Beal MF, Kowall NW, Ellison DW, Mazurek MF, Swartz KJ, Martin JB. Replication of the neurochemical characteristics of Huntington’s disease by quinolinic acid. Nature. 1986;321:168–171. doi: 10.1038/321168a0. [DOI] [PubMed] [Google Scholar]
- 33.Heyes MP, Saito K, Crowley JS, et al. Quinolinic acid and kynurenine pathway metabolism in inflammatory and non-inflammatory neurological disease. Brain. 1992;115:1249–1273. doi: 10.1093/brain/115.5.1249. [DOI] [PubMed] [Google Scholar]
- 34.Heyes MP, Brew BJ, Martin A, et al. Quinolinic acid in cerebrospinal fluid and serum in HIV-1 infection: relationship to clinical and neurological status. Ann Neurol. 1991;29:202–209. doi: 10.1002/ana.410290215. [DOI] [PubMed] [Google Scholar]
- 35.Heyes MP, Nowak TS., Jr Delayed Increases in regional brain quinolinic acid follow transient ischemia in the gerbil. J Cereb Blood Flow Metab. 1990;10:660–667. doi: 10.1038/jcbfm.1990.119. [DOI] [PubMed] [Google Scholar]
- 36.Stone TW. Neuropharmacology of quinolinic and kynurenic acids. Pharmacol Rev. 1993;45:309–379. [PubMed] [Google Scholar]
- 37.Rios C, Santamaria A. Quinolinic acid is a potent lipid peroxidant in rat brain homogenates. Neurochem Res. 1991;16:1139–1143. doi: 10.1007/BF00966592. [DOI] [PubMed] [Google Scholar]
- 38.Santamaria A, Rios C. MK-801, an N-methyl-D-aspartate receptor antagonist, blocks quinolinic acid-induced lipid peroxidation in rat corpus striatum. Neurosci Lett. 1993;159:51–54. doi: 10.1016/0304-3940(93)90796-n. [DOI] [PubMed] [Google Scholar]
- 39.Shoham S, Wertman E, Ebstein RP. Iron accumulation in the rat basal ganglia after excitatory amino acid injections-dissociation from neuronal loss. Exp Neurol. 1992;118:227–241. doi: 10.1016/0014-4886(92)90039-s. [DOI] [PubMed] [Google Scholar]
- 40.Tamari K, Kaji J. On the biological studies of the blast mould (Piricularia Oryzae CAVARA), the causative mould of the blast disease of the rice plant. Part 1. studies on the toxins produced by blast mould. J Agr Chem Soc Jpn. 1953;23:254–258. [Google Scholar]
- 41.Tamari K. Biochemical studies on the blast mould (Piricularia Oryzae CAVARA) Kagaku. 1955;25:18–23. [Google Scholar]
- 42.Minakata K, Okuno E, Nakamura M, Iwahashi H. Idetification of radicals formed in the reaction mixtures of rat liver microsomes with ADP, Fe3+ and NADPH using HPLC-EPR and HPLC-EPR-MS. J Biochem. 2007;142:73–78. doi: 10.1093/jb/mvm114. [DOI] [PubMed] [Google Scholar]
- 43.Iwahashi H. Some polyphenols inhibit the formation of pentyl radical and octanoic acid radical in the reaction mixture of linoleic acid hydroperoxide with ferrous ions. Biochem J. 2000;346:265–273. [PMC free article] [PubMed] [Google Scholar]
- 44.Iwahashi H, Kawamori H, Fukushima K. Quinolinic acid, α-picolinic acid, fusaric acid, and 2,6-pyridinedicarboxylic acid enhance the Fenton reaction in phosphate buffer. Chem Biol Interact. 1999;118:201–215. doi: 10.1016/s0009-2797(99)00080-0. [DOI] [PubMed] [Google Scholar]


