

Abstract
TCRμ is an unconventional TCR that was first discovered in marsupials and appears to be absent from placental mammals and non-mammals. Here we show that TCRμ is also present in the duckbill platypus, an egg-laying monotreme, consistent with TCRμ being ancient and present in the last common ancestor of all extant mammals. As in marsupials, platypus TCRμ is expressed in a form containing double V domains. These V domains more closely resemble antibody V than that of conventional TCR. Platypus TCRμ differs from its marsupial homologue by requiring two rounds of somatic DNA recombination to assemble both V exons and has a genomic organization resembling the likely ancestral form of the receptor genes. These results demonstrate that the ancestors of placental mammals would have had TCRμ but it has been lost from this lineage.
Introduction
Conventional T cells exist in two distinct lineages based on the composition of their TCR heteroduplex: αβ T cells use a TCR composed of α and β chains while γδ T cells use γ and δ chains. Like Ig, the Ag binding V domains of the TCR chains are encoded by exons that are assembled from gene segments by somatic DNA recombination. All jawed vertebrates have both αβ and γδ T cells and the genes encoding these four TCR chains are highly conserved both in sequence and organization (1-3). Recently, a fifth locus encoding TCR chains, named TCRμ, were found in marsupial mammals (4). TCRμ contains C regions related to TCRδ but is transcribed in a form that would include double V domains that are more related to IgH V (VH) than to TCR V genes (2, 4, 5). TCRμ does not substitute for TCRδ in marsupials since the genes encoding conventional TCRδ chains are highly conserved and expressed (2, 6).
TCRμ genes are distinct and unlinked to those that encode conventional TCR chains and have atypical gene organization. The N-terminal V of TCRμ (Vμ) is encoded by somatically recombined genes (V, D, and J), with the recombination taking place in thymocytes, resulting in clonal diversity (4). The second, C-proximal V domain (Vμj) is encoded by an exon where the V, D, and J genes are already pre-joined in the germ-line DNA and are relatively invariant (4). This is the only known example of germ-line joined V genes being used in a TCR. The TCRμ locus is also organized in tandem clusters, which is also atypical of TCR genes (2, 4).
Searching the available placental mammal, avian, and amphibian genomes failed to uncover TCRμ orthologues (2). However, here we show that TCRμ is present in a monotreme, the duckbill platypus Ornithorhyncus anatinus. The monotremes are oviparous mammals that last shared a common ancestor with marsupials and placentals at least 165 million years ago (MYA) (7). The genomic organization of the platypus TCRμ locus reveals insight into the evolution of this uniquely mammalian TCR locus and supports its ancient presence in mammals.
Materials and Methods
Whole genome analysis and annotation
Analyses were performed using the platypus genome assembly Version 5.0.1 available at GenBank (http://www.ncbi.nlm.nih.gov/genome/guide/platypus/). Marsupial Cμ sequences were used to search based on homology using the BLAST algorithm (4, 5, 8). Scaffolds containing Cμ sequences were retrieved and exon boundaries were determined by the presence of canonical mRNA splice sites. Platypus cDNA sequences were used to search against the O. anatinus genome project to identify the genomic V, D and J gene segments. The beginning and end of each coding exon of V, D and J gene segments were identified by the presence of mRNA splice sites or flanking recombination signal sequences (RSS). Supplementary Fig. 1 shows the location of each TCRμ V, D, J and C segments on the scaffolds. Platypus TCRδ chain C region sequence (GenBank accession number XM_001516959) was used to identify the single copy platypus Cδ on scaffold 588, which is separate from any of the scaffolds containing the putative platypus TCRμ sequences.
PCR and cDNA analyses
A spleen cDNA library constructed from tissue from a Tasmanian platypus was screened by PCR (9). All PCR primer sequences used in this study are presented in Table I. PCR amplification was performed using Advantage™-HF 2 PCR (BD Biosciences, Clontech Laboratories, Palo Alto, California) with the conditions: denaturation at 94 °C for 1 min for 1 cycle, followed by 34 cycles of 94°C for 30 s, annealing/extension at 62 °C for 4 min, and a final extension period of 68 °C for 5 min. Forward and reverse primers complementary to sequence internal to the platypus Cμ exon were paired with primers in the λgt10 vector used to construct the library to amplify clones containing the 5’ and 3’ un-translated regions (UTR) (10). This approach generated the partial cDNA sequences analyzed. Full-length platypus TCRμ cDNA sequences were isolated by PCR using primers complementary to 5’ and 3’ UTR. PCR products were cloned using TOPO TA cloning Kit (Invitrogen, Carsbad, CA) and sequenced using BigDye Terminator Cycle Sequencing Kit (Applied Biosystems, Foster City, CA). The GenBank accession numbers of the cDNA sequences described here are: clone 21, GU458338; clone 26, GU458339; clone 2.22, GU458341; clone 3815, GU475137; clone 1951, GU475138; clone 1953, GU475139; clone 1954, GU475140; clone 1955, GU475141; clone 4951, GU475142; clone 4942, GU475143; clone 786, GU475144; clone 6, GU458343; clone 17, GU475135; clone 2.34, GU458340; clone 10 GU264000; clone 36, GU475136; clone 4966, GU475145; clone 1.22, GU458342.
Table I.
Sequences and description of oligonucleotide primers used
| Sequence (5’-3’) | Orientation | Region |
|---|---|---|
| CCTGGGCAGTGGGGGCCATGGCCTG | R | Cμ |
| GGGATAGTAATCTTTCACCAGGCAAG | R | Cμ |
| AGCAAGTTCAGCCTGGTTAAG | F/R | λ gt10 vector |
| ATTATGAGTATTTCTTCCAGGGTA | F/R | λ gt10 vector |
| CCCAACCCATGGTCTTTGTCATG | F | Cμ |
| GGAACCAGAGCTTCGCTGCTTGCC | F | Cμ |
| AACCATGCTGGTCCAGGTC | F | 5’ UTR |
| CAGGAGGGAAATGATTCAGG | R | 3’ UTR |
| CGGAAACAAAAGAAGGCAGA | R | 3’ UTR |
| CGTGAAATACTCGGGGGAAT | F | Vμ1 |
| AGGCTCTGCATTGATCTTCG | F | Vμ2 |
Phylogenetic analysis
Phylogenetic analyses were performed on nucleotide alignments using the MEGA4 program (11) with UPGMA (Unweighted Pair Group with Arithmetic mean), MP (Maximum parsimony), Neighbor-Joining (NJ) and ME (Minimum Evolution) methods. Amino acid translations were first aligned to establish gapping and then converted back to nucleotide using the BioEdit program (12).
The GenBank accession numbers of the sequences used in the phylogenetic analyses of TCRμ C and V region sequences were: Cβ sequences are Echidna, AY423735; Platypus, XM_001509180; Opossum, AY014507; Human, AF043178; Mouse, FJ188408. Cγ sequences are Opossum, DQ499632; Platypus, DQ011295; Human, X15019; Mouse, X03802. Cα sequences are Echidna, DQ011301; Platypus, XM_001507799; Opossum, AY014504; Human, FJ79357; Mouse, DQ186679. Cδ sequences are Platypus, XM_001516959; Human, M21624; Mouse, M37694; Bandicoot, AY955295; Opossum, XP_001379771; Wallaby, AY238447; Frog, GQ262033 and GQ262033; Chicken, XM_423780. Cμ sequences are Wallaby, AY956350; Bandicoot, AY955293; Opossum Cμ sequences are from MonDom5 scaffold 3.430000001-435000000 (13). The sequences of platypus Cμ used in the alignment are from platypus assembly version 5.0.1 and scaffold locations are presented in Supplementary Fig. 1. Wallaby Vδ48, AY238448; Wallaby Vδ51, AY238451; Bandicoot Vδ46, DQ076246; Cattle Vδ13, D16113; Human Vα96, Z14996; Human Vα34, AB360834; Human Vβ04, M27904; Mouse Vβ16 M15616; Cattle Vβ19 D90129; Rabbit Vβ19 D17419; Sheep Vβ11, AF030011; Human Vγ29, M13429; Mouse Vγ38, M13338; Cattle Vγ 88, U73188; Sheep Vγ98, Z12998; Platypus Vγ95, DQ011295; Platypus Vγ19, DQ011319; Shark NAR62, AY114762; Shark NAR78, AY114978; Shark NAR82, AY261682; Shark NAR60, EU213060; Shark TNAR05, DQ022705; Shark TNAR88, DQ022688; Shark TNAR10, DQ022710; Opossum Vμ sequences are DQ979402, DQ979398, EF503722, EF5037719, DQ979397, DQ979396, EF503721, EF503718. The sequences of platypus Vμ used in the alignment are from platypus assembly version 5.0.1 and locations are presented in Supplementary Fig. 1. Frog VHδ sequences are GQ262028, GQ262032, GQ232013; IgVH sequences are: possum VH50, AAL87470; possum VH1, AAL87474; bandicoot VH5.1, AY586158; Opossum VH sequences are from MonDom5 scaffold 1.295000001-300000000 (12). Mouse VH3660, K01569; mouse VH3609N, X55935; mouse VHDNA4, M20829; mouse VHJ588, Z37145; mouse VHJ606, X03398; mouseVHQ52, M27021; mouse VHS107, J00538; mouse VHSM7 M31285; mouse VH11, Y00743; mouse VH98, AJ851868. Human VH sequences were obtained from the VBASE database. Pig VH3, U15194; cattle VH, AF015505; sheep VH, Z49180; echidna VH7g, AY101438; echidna VH8g, AY101439; echidna VH51g, AY101442; platypus VH29, AF381294; platypus VH26, AF381293; platypus VH3, AF381314; platypus VH53, AF381304.
Results
Identification of a platypus TCRμ homologue
Fifteen gene sequences with similarity to opossum Cμ were identified in the platypus whole genome assembly (14). Searching the unassembled, raw trace sequences from the platypus whole genome shotgun sequence did not uncover any additional genes with homology to opossum Cμ Six of these contained complete open reading frames (ORF) and were used in all subsequent analyses (Supplementary Figs. 1 and 2). When compared to opossum Cμ and conventional TCR C genes from a variety of mammals, the platypus sequences had greatest nucleotide identity to opossum Cμ (Table II, Supplementary Fig. 2). Included in these analyses was the single copy conventional platypus TCRδ C gene which is located on scaffold 588 in the genome assembly, separate from any of the TCRμ related genes (Table II, Fig. 1 and data not shown). Phylogenetic analyses using several models for tree reconstruction result in the platypus and marsupial Cμ together forming a well-supported monophyletic clade consistent with having identified the platypus TCRμ homologue (Fig. 1).
Table II.
Comparison of platypus Cμ with opossum Cμ and conventional mammalian TCR C regions
| Platypus Cμ N=6 | Platypus Cδ N=1 | Opossum Cμ N=8 | Cδ4 N=5 | Cα5 N=5 | Cβ6 N=5 | Cγ7 N=4 | |
|---|---|---|---|---|---|---|---|
| Platypus Cμ N=61 | 80-982(843) | 43-47(44) | 50-56(52) | 41-54(50) | 21-26(24) | 25-32(29) | 27-33(31) |
| Platypus Cδ N=1 | 43-47(44) | 100 | 43-47(45) | 46-53(50) | 26-30(28) | 29-32(30) | 29-33(32) |
| Opossum Cμ N=8 | 50-56(52) | 43-47(45) | 75-96(83) | 41-54(48) | 21-30(25) | 26-34(30) | 26-33(29) |
| Cδ N=5 | 41-54(50) | 46-53(50) | 41-54(48) | 55-83(67) | 21-30(25) | 24-31(27) | 28-34(31) |
| Cα N=5 | 21-26(24) | 26-30(28) | 21-30(25) | 21-30(25) | 45-87(54) | 22-33(27) | 24-33(27) |
| Cβ N=5 | 25-32(29) | 29-32(30) | 26-34(30) | 24-31(27) | 22-33(27) | 63-93(72) | 28-36(31) |
| Cγ N=4 | 27-33(31) | 29-33(32) | 26-33(29) | 28-34(31) | 24-33(27) | 28-36(31) | 48-76(54) |
Number of sequences included in the comparison
The range of % nucleotide identity
The mean % nucleotide identity
Cδ sequences of human, mouse, opossum, bandicoot, wallaby
Cα sequences of human, mouse, opossum, echidna, platypus
Cβ sequences of human, mouse, opossum, echidna, platypus
Cγ sequences of human, mouse, opossum, platypus
FIGURE 1.

Phylogenetic analyses of platypus and marsupial Cμ and C regions from conventional TCR chains. Phylogenetic relationship between Cμ and other conventional TCRs are simplified according to the phylogenetic trees constructed using different methods: (A) Neighbor-Joining (NJ); (B) Maximum Parsimony (MP); (C) Unweighted Pair Group Method with Arithmetic mean (UPGMA); (D) Minimum Evolution (ME). All phylogenetic analyses are based on nucleotide alignments and branch support is indicated as the percentage of out of 1000 bootstrap replicates.
Platypus TCRμ is transcribed in a double V form
To investigate the structure of expressed platypus TCRμ, full-length transcripts were isolated from a spleen cDNA library. Transcripts averaged 1300 bp in length, which is longer than a conventional TCR transcript and more similar to the double V encoding opossum TCRμ (Fig. 2). Each encoded a leader (L) peptide followed by two complete V domains, designated V1 and V2 for the 5’ (N-terminal) and 3’ (C-proximal) domains, respectively. They also contained one C domain along with sequences corresponding to the connecting peptide (CP), transmembrane (TM) and cytoplasmic (CT) regions typical of trans-membrane TCR chains (Fig. 2). The clones encoded conserved residues found in conventional TCR including cysteines forming intra-chain disulfide bonds in the V and C domains as well as inter-chain disulfide bond in the CP (Fig. 2). The framework region (FR) 4 of V1 and V2 contain the sequence YGXG and FXXG, respectively, similar to the conserved FGXG motif in conventional TCR and marsupial TCRμ (4,15,16) (Fig. 2). Also present are two positively charged amino acids (arginine and lysine) in the TM region that, in conventional TCR chains, participate in association with the CD3 signaling complex (17). Comparison to the genomic sequence revealed that the CP is unusual in platypus TCRμ in that it is encoded on two exons, designated CP1 and CP2 with the conserved cysteine in CP2 (Fig. 2). This is unlike the opossum TCRμ and most conventional TCR where the CP is encoded by a single exon (4).
FIGURE 2.

Predicted amino acid alignment of full-length platypus TCRμ cDNA clones. Dashes indicate identity and gaps introduced to the alignment are shown as dots. The sequences were divided into the Leader, V1, V2 and C domains. The FR and CDR of the V domains along with the Cμ, CP, and TM-CT of C domain were shown above the sequence alignment. Conserved cysteines are shaded. Conserved lysines and arginines are shaded and indicated by *. Conserved residues YGXG and FXXG in FR4 of the V1 and V2 domains, respectively are noted. The borders of CDR and FR were indicated above the sequences.
Both V1 and V2 are encoded by somatically recombined genes
The germ-line genes encoding the V1 and V2 domains were identified by comparing 18 unique V1 and 16 V2 sequences from both partial and full-length platypus splenic cDNA clones to the genome assembly. V1 and V2 domains share less than 65% nucleotide identity to each other and, by convention, are encoded by different V gene sub-groups designated Vμ1 and Vμ2, respectively. Nine Vμ1 and six Vμ2 genes were identified in the germ-line sequence (Supplementary Fig. 1). All nine of the Vμ1 genes contained upstream exons encoding a conserved L sequence; however none of the Vμ2 germ-line genes had a L exon (not shown). The sequences corresponding to FR4 in V1 and V2 were also used to identify eight Jμ1 and twelve Jμ2 genes, respectively. Jμ1 and Jμ2 are easily distinguished by length and sequence with Jμ1 being shorter and sharing less than 50% nucleotide identity with Jμ2 genes (Fig. 3). All Vμ and Jμ genes were flanked by conserved RSS, the recognition substrates for the Recombination Activating Gene product (18). The RSS flanking the Vμ and Jμ genes contained 23 and 12 bp spacers, respectively, typical of TCR genes (Fig. 3). In all cDNA sequences analyzed, Vμ1 were recombined to Jμ1 and Vμ2 to Jμ2. These results support both the V1 and V2 domains in platypus TCRμ are encoded by exons that are fragmented in the germ-line DNA and undergo RAG mediated V(D)J recombination.
FIGURE 3.

Nucleotide sequence and translations of the 3’ end of Vμ1 and Vμ2 gene segments and complete Jμ1 and Jμ2 gene segments. RSS flanking V and J gene segments in platypus genome are indicated. The scaffolds on which V and J sequences were identified are shown on the left. Pseudogenes are indicated by ψ. Stop codons are indicated as *. Nucleotide sequences of V and J genes are shown in lowercase with amino acid sequences underneath, whereas the RSS sequences are shown in uppercase. Heptamers and nonamers are in bold, and 12 bp or 23 bp spacers are indicated. The YGXG and FXXG conserved motif corresponding to FR4 are shaded.
The sequences corresponding to complementarity determining region 3 (CDR3) differed both in length and diversity between V1 and V2 domains (Fig. 2). The V1 CDR3 are longer and up to 22 codons in length whereas none of the V2 CDR3 exceeded 12 codons. Using the V1 CDR3 sequences identified 35 putative Dμ genes in the platypus genome assembly, all of which were asymmetrically flanked by RSS containing a 12 bp spacer on the 5’ side and 23 bp spacer on the 3’ side, as is typical of TCR D genes (Supplementary Fig. 3). Based on length and nucleotide identity the D genes fell into two groups designated Dμ1 and 2. Dμ1 (n = 20) contained coding regions 10 to 13 nucleotides in length while Dμ2 (n = 15) were 18 to 19 nucleotides (Supplementary Fig. 3). There was greater than 75% nucleotide identity within each group but less than 40% nucleotide identity between Dμ1 and Dμ2 genes. Although Dμ genes could be distinguished in the genomic sequence, individual contributions to the V1 junctions were difficult to establish due to their similarity and short length. Nonetheless it was possible to determine that the Vμ1-Jμ1 junctions contained two, three or four Dμ genes, in roughly a 1:2:1 ratio, similar to the multiple D genes found in opossum TCRμ rearrangements (Fig. 4, Supplementary Table 1). Typical of D gene segments, the Dμ present in V1 junctions were used in multiple reading frames (Supplementary Fig. 3). The gene segments encoding the V1 domains demonstrated extensive trimming and no evidence of P nucleotide additions, although N nucleotide additions were common (Fig. 4).
FIGURE 4.

Sequences corresponding to the CDR3 of (A) V1 and (B) V2 domains from full-length and partial platypus splenic TCRμ cDNAs.
In contrast to V1, the CDR3 of 14 of the 16 V2 cDNA sequences could be accounted for entirely by recombination between germ-line Vμ2 and Jμ2 genes, with evidence for P and N nucleotide additions but no Dμ genes being incorporated (Fig. 4, Supplementary Table 1). The remaining two clones contained a short stretch of four or five nucleotides that matches Dμ2.8, and cannot be ruled out as being from a D segment. Whether coincidence or evidence of a D segment is not clear, and is not evident from the genomics where no Dμ has been found between Vμ2 and Jμ2 gene segments (see below). These results are consistent with the longer CDR3 in V1 domains being due to incorporation of multiple D segments and the shorter V2 CDR3 being the result of direct V to J recombination in most if not all junctions.
Platypus TCRμ V genes are related to clan III VH genes
The relationship Vμ genes have to each other and with V genes from Ig and conventional TCR was investigated by phylogenetic analyses. These analyses included VH from the platypus IgH locus (19). The results of these analyses support Vμ1 and Vμ2 each forming their own distinct clades with strong bootstrap support (99-100%) consistent with their designation as separate subgroups (Fig. 5). Furthermore, the platypus Vμ subgroups together form a single clade nested within mammalian clan III VH genes. This is in contrast to the marsupial Vμ (Vμ and Vμj), which are not monophyletic but are closely related to VH (Fig. 5) (4).
FIGURE 5.
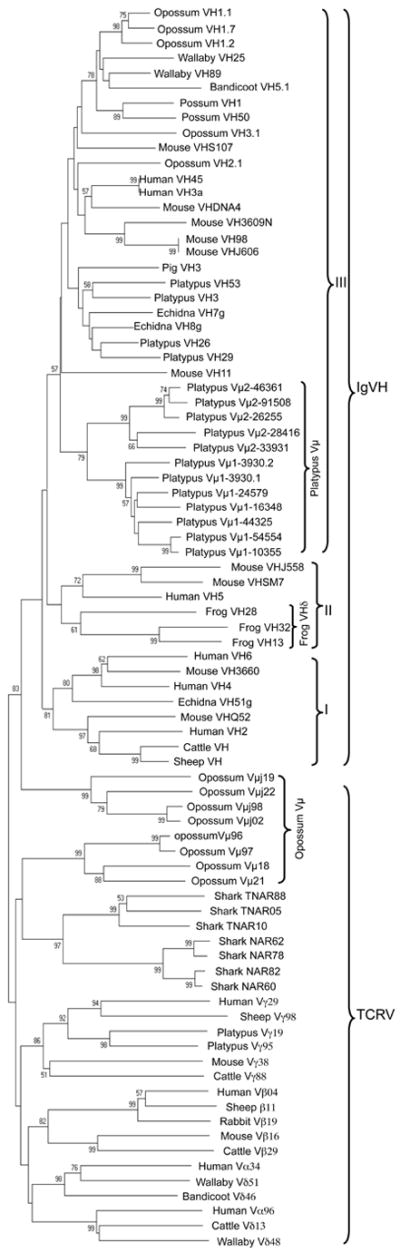
Phylogenetic analysis of platypus and marsupial Vμ including V genes from conventional TCR, shark NAR and NAR-TCR and Ig VH. This neighbor-joining tree is based on nucleotide alignments and branch support is indicated as the percentage of out of 1000 bootstrap replicates. Only those nodes with greater than 50% support are indicated. The three major clans of vertebrate VH are indicated by Roman numerals.
Platypus TCRμ genomic organization
The TCRμ locus is not fully assembled in the current version of the platypus genome, but rather was scattered on 55 separate scaffolds ranging in length from less than 1 kb up to 64.8 kb (Supplementary Fig. 1). Seventeen of the 35 Dμ segments were on scaffolds also containing Vμ, Jμ and/or Cμ sequences, supporting their being part of a larger TCRμ locus (Supplementary Fig. 1). Combining the scaffold analyses with the cDNA sequences reveals a minimal model for the organization of the platypus TCRμ locus. Three scaffolds contain multiple Dμ either transcriptionally downstream of Vμ1 genes (scaffold 3930) or upstream of a Jμ1 gene (scaffolds Ultra190 and 19044) consistent with the evidence from cDNA sequences having multiple Dμ in the junctions between Vμ1 and Jμ1 genes (Fig. 6A, Supplementary Fig. 1). One scaffold (28416) contains single Vμ2 and Jμ2 genes that correspond to those used in expressed recombinations (Fig. 6A, Supplementary Fig. 1, Supplementary Table 1). However, no Dμ genes were found on this scaffold consistent with the lack of D segments in the majority of Vμ2-Jμ2 junctions (Figs. 4 and 6, Supplementary Fig. 1, Supplementary Table 1).
FIGURE 6.

Diagrams of the predicted platypus TCRμ gene organization, transcripts, and protein structure. (A) Representative TCRμ scaffolds containing TCRμ coding sequences. Closed or open triangles flanking the Vμ, Dμ and Jμ gene segments indicate the presence of 23- or 12-bp spacer RSS, respectively. The L sequence, CP, TM-CT, and 3’ UTR exons are indicated. (B) Predicted TCRμ germ-line DNA and rearranged DNA structure. (C) Primary TCRμ mRNA transcript structure. (D) Predicted TCRμ protein organization. Conserved R and K residues in the TM region are indicated. (E) Predicted platypus TCRμ cluster and representative opossum TCRμ cluster.
Full-length cDNA clones containing similar or identical Vμ1 sequence also had similar or identical Jμ1, Vμ2, Jμ2 and Cμ (Supplementary Table 1). The most parsimonious explanation for these observations is a cluster organization of platypus TCRμ genes, similar to that found in marsupials (4). In other words, the V, D and J genes encoding V1 domains are upstream of the V and J gene segments encoding V2, followed by Cμ (Fig. 6B). Consistent with this prediction, three scaffolds (19044, 26255, and 33931) contain Jμ1 genes upstream of Vμ2 genes and many of the scaffolds containing Cμ genes also contained an upstream Jμ2 (Fig. 6A, Supplementary Fig. 1). A conservative model for the organization of the platypus TCRμ genes is presented in Figure 6B. The model may be overly conservative since two cDNA clones appeared to use different Vμ1 but the same Jμ1 while two others appeared to use the same Vμ1 recombined to two different Jμ1 (compare clones 2.34, 10 and 17 in Supplementary Table 1). These results imply there may be multiple Vμ1 and Jμ1 in some clusters, or alternatively may be due to trans-cluster recombination as has been found for both opossum TCRμ and shark TCRδ genes (4, 20).
To estimate the possible number of TCRμ clusters, the number of unique Cμ sequences that could be isolated from an individual platypus was determined. PCR was performed on genomic DNA from a single platypus using primers designed to amplify all 15 Cμ identified in the genome assembly. Twenty individual clones were sequenced and yielded nine distinct Cμ sequences consistent with at least five Cμ exons per haploid platypus genome (not shown). This number is slightly lower but not significantly different from what would be predicted from the platypus whole genome sequence where 15 different Cμ were identified or a minimum of eight per haploid genome. Whether this is an artifact of the assembly or normal platypus variation remains to be determined.
Discussion
The discovery of a platypus TCRμ homologue confirms that this unconventional TCR locus is not unique to marsupials but rather it is ancient in the mammalian lineage and appeared prior to the divergence of the prototherian (monotremes) and therian (marsupial and placental) mammals more than 165 MYA (7). TCRμ was clearly retained in the marsupial lineage and, therefore, would have been present in the last common ancestor of marsupials and placental mammals. However, no TCRμ homologue has been identified in placental mammals, consistent with gene loss in this lineage (2). Furthermore, a TCRμ homologue has yet to be found in the available avian, reptilian, and amphibian genomes, consistent with its appearance in the synapsids (mammals and their extinct relatives) after their divergence from the diapsids (birds and reptiles) 310 MYA (2, 21). This conclusion is also consistent with phylogenetic analyses of TCRμ C region genes published previously, where marsupial Cμ appears to diverge from Cδ after the split between mammals and birds (4).
The most distinctive feature common to both marsupial and platypus TCRμ is their transcription in a form predicted to encode three extra-cellular Ig domains (V-V-C) instead of the conventional two domains (V-C). TCR with this characteristic have only been described in one other vertebrate lineage, the cartilaginous fish. Both the elasmobranchs (sharks, rays, and skates) and the holocephalins (ratfish) use an isoform of TCRδ, called NAR-TCR, that also has a double V expressed with a conventional Cδ (22).
There are a number of common characteristics shared between mammalian TCRμ and shark NAR-TCR, as well as distinctive differences (Table III). In both platypus TCRμ and NAR-TCR the exons encoding both V domains require somatic DNA recombination to be assembled (22). The supporting or V2 domains in NAR-TCR are encoded by a dedicated subset of Vδ gene segments that, like the platypus Vμ2, lack L sequences and would be unable to encode the N-terminus of an extra-cellular protein (22). This is different, however, in marsupials where the exon encoding the V2 domain, called Vμj, is pre-assembled as a germ-line joined gene and contains a L sequence that is contiguous with the exon encoding the extra-cellular V domain (Fig. 6C) (4). In the case of marsupial TCRμ this L sequence is left out of the Vμj exon in the mature mRNA due to a canonical RNA splice site at the junctions between the L and V sequences (2, 4). This arrangement makes it possible to transcribe a two-domain form of marsupial TCRμ that contains only Vμj and C region. Indeed, such transcripts are found in the opossum thymus, however, are rare in peripheral lymphoid tissues, leading to the current working hypothesis that it is the double-V form that is the mature, functional chain (4). Furthermore, in the opossum, Monodelphis domestica, there are eight tandem clusters of TCRμ genes and in six of these the Vμj L sequences contain mutations rendering them non-functional (2, 4). Therefore, while the shark and platypus have fully deleted the L sequence of the supporting V, the L sequences in marsupials are apparently degenerating due to lack of use.
Table III.
Comparison of the features of TCRμ, shark NAR TCR, and mammalian conventional TCRα/δ.
| Locus | Model Species | C gene | Double V | Somatic recombination | Leader sequence | No. of D segments used | CDR3 length$ (mean) | V nature | Ref | |||||
|---|---|---|---|---|---|---|---|---|---|---|---|---|---|---|
| N-terminal | C-proximal | N-terminal | C-proximal | N-terminal | C-proximal | N-terminal | C-proximal | N-terminal | C-proximal | |||||
| TCRμ | Platypus | Cμ | Yes | Yes | Yes | Yes | No | 2-4 | 0? | 9-22(14) | 9-12(11) | VH Clan III | VH Clan III | herein |
| Opossum | Cμ | Yes | Yes | No§ | Yes | Yes# | 1-3 | NA* | 8-29(17) | 11 | VH-related | VH-related | 4 | |
| NAR-TCR | Nurse shark | Cδ | Yes | Yes | Yes | Yes | No | 1 | 1-2 | 9-25(16) | 9-27(16) | V-NAR | Vδ | 22 |
| TCRα/δ | Xenopus | Cδ1 | No | Yes | NA | Yes | NA | 1-2 | NA | 7-20(13) | NA | Vα, Vδ, VHδ (VH Clan II) | NA | 23 |
| TCRα/δ | Human | Cδ | No | Yes | NA | Yes | NA | 2-3 | NA | 8-12(15) | NA | Vα, Vδ | NA | 24 |
| TCRα/δ | Mouse | Cδ | No | Yes | NA | Yes | NA | 2 | NA | 6-19(13) | NA | Vα, Vδ | NA | 24 |
Range in codons
The C proximal V in marsupial TCRμ is a germ-line joined V
Fused to the V domain exon as the result of retrotransposition
Not applicable
Both TCRμ and NAR-TCR utilize V domains more similar to antibody V genes than conventional TCR V genes. The N-terminal V domains in NAR-TCR are related to V used in IgNAR, which are light-chainless antibodies unique to cartilaginous fishes (22, 25). As already described, the second V in NAR-TCR is a Vδ gene, making the NAR-TCR appear to be a hybrid between IgNAR and TCRδ (22). In contrast, the genes used to encode both V1 and V2 domains in platypus TCRμ are indistinguishable from mammalian clan III Ig VH genes and unrelated to NAR V genes. Marsupial Vμ and Vμj on the other hand are somewhat intermediary. Vμj are more similar to Ig VH, but do not fall within the three traditional mammalian VH clans, and Vμ appears to be more related to NAR V genes, although this latter relationship is only weakly supported in phylogenetic analyses (Fig. 5).
The current model for the structure of NAR-TCR is an unpaired N-terminal domain, much like the V-NAR domain in IgNAR, binding antigens as a single domain (22, 25). This Ag binding is similar to that which has been described for single V domain IgNAR antibodies in sharks and light-chainless IgG in camels (26, 27). It seems likely that TCRμ is structured similarly to NAR-TCR, with a single, unpaired N-terminal V domain capable of binding antigen directly. Based on conserved residues, including cysteines TCRμ is predicted to form a heterodimer with another TCR chain (4). However, since no other TCR related genes encoding a three-domain chain have been found in the marsupial genome it is predicted that the partner is a conventional two domain TCR chain, likely TCRγ, leaving the N-terminal domain unpaired (2).
The common characteristics found in mammalian TCRμ and shark NAR-TCR raise the question of whether these features are due to homology by descent or convergent evolution. An argument could be made that the evolutionary distance between sharks and mammals is sufficiently vast, and the differences between TCRμ and NAR-TCR extensive enough that each evolved independently and appear analogous due to convergence on a common structure and function. This could imply a common evolutionary pressure shared between cartilaginous fish and early mammals to have T cells capable of binding Ag directly using single domain binding sites.
Phylogenetic analyses of platypus and marsupial TCRμ C region support that they are orthologous genes that would have been found in a last common ancestor of the three living mammalian lineages. However, following the divergence of the oviparous monotremes from the viviparous marsupials and placental mammals, TCRμ appears to have followed different evolutionary paths. In the placental mammals it was lost altogether (2). As discussed earlier, in the marsupials the genes encoding the V2 domain appear to have been replaced in the germ-line by a pre-joined V gene, most likely via retro-transposition (4). This novel marsupial adaptation is consistent with the V2 domains serving strictly supporting roles rather than being Ag-binding and, therefore, requiring little or no clonal variation. In the platypus the TCRμ V2 domain is encoded by somatically recombined genes, but variation remains restricted through limited junctional diversity, with no D segments and few N or P additions in the V-J junctions. Comparisons of the length of the CDR3 region in the platypus and marsupial V2 domains, where they are both relatively short, suggests that D segments, if they were ever present, were deleted early in the evolution of TCRμ prior to the divergence of prototherians and therians (4). The mean codon length of the platypus V2 CDR3 is the same (n = 11) as that found in the germ-line joined marsupial Vμj genes (Table III). In contrast the V1 domains of both platypus and opossum TCRμ have comparatively longer and more diverse CDR3 due to the incorporation of multiple D segments during V(D)J recombination in both species (4).
The lack of an intron separating the L from the V in the Vμj exon is evidence of retro-transposition in the evolution of TCRμ in marsupials (4). In other words, Vμj is a functional, partially processed gene. The insertion of joined V genes into the germ-line by retro-transposition would require co-existing retro-elements in the genome and one noteworthy distinction between the opossum and the platypus genomes is the abundance of retro-elements. The opossum has among the highest percentage of retro-elements of any vertebrate genome sequenced (28). In contrast, monotremes are relatively devoid of retro-elements (14, 29). Whether this extreme difference contributed to the evolution of opossum and platypus TCRμ is not known. Furthermore, this explanation is not fully satisfying since processed pseudogenes have been found in the platypus and echidna genomes, consistent with retro-transposition having occurred sometime in the past for some monotreme genes (10).
Phylogenetic analyses support TCRμ being related to and likely derived from a TCRδ ancestor (4, 5). As stated earlier, if TCRμ evolved from a duplication of TCRδ genes it likely occurred after the separation of mammals from birds and reptiles (4). However, some insight into the origins of TCRμ may come from recent work on the genetics of amphibian TCRδ chains (23). The TCRα/δ locus in the frog Xenopus tropicalis contains two Cδ genes, one of which, Cδ1, is expressed with V genes called VHδ. These frog VHδ that are indistinguishable from clan II Ig VH genes and, although the X. tropicalis TCRα/δ and Igh loci are closely linked, the VHδ genes appear to be dedicated for use in TCRδ chains and are not used in IgH chains (23). This close linkage, however, may have facilitated insertion of VH genes among the TCRδ genes in amphibians. The region of the frog TCRα/δ locus containing Cδ1 and multiple VHδ genes is distinct and in an inverted transcriptional orientation from the rest of the TCRα/δ genes, functioning almost as a separate mini-cluster (23). Amphibians, therefore, appear to be another vertebrate lineage that uses TCRδ chains containing antibody-like V genes. Unlike TCRμ and NAR-TCR, frog TCRδ chains are not expressed with two V domains, however. Rather, X. tropicalis TCRδ chains using VHδ are structured like conventional two-domain TCR chains.
It is possible, and seems likely, that the TCRμ locus evolved from genome duplication and translocation of an ancestral region of the TCRα/δ locus similar to the Cδ1 region in frogs. Indeed, the discovery of VH genes in the X. tropicalis TCRα/δ locus is consistent with their presence in the TCRδ locus prior to the evolution of TCRμ. Internal duplications of clusters of V, D, and J segments within the TCRμ locus, as hypothesized previously, would then give rise to the double V organization in mammals (2). What remains puzzling is the variation in the source of VH genes used in each lineage. The VHδ in X. tropicalis are apparently derived from clan II VH, the platypus Vμ genes are clan III VH, and although the marsupial Vμ genes are more closely related to VH than TCR V genes but fall outside the clan I, II, and III designation. These observations suggest that the V genes used in TCRδ or TCRμ chains have been replaced over time with different VH lineages, even within the mammals. If the platypus TCRμ locus is indeed organized as tandem clusters similar to what has been shown in opossum (4), such gene clusters may facilitate gene replacement and duplication that is not easily achieved by the translocon organization of the conventional TCR genes.
The lack of TCRμ in commonly studied mammals such as humans and mice no doubt contributed to it remaining undiscovered for nearly a quarter century following that of the conventional TCRα, β, γ, and δ (4, 28-31). Determining why placental mammals may have lost this TCR chain will require first determining what function(s) TCRμ+ T cells perform in those species where they are found.
Supplementary Material
Special abbreviations
- RSS
recombination signal sequences
- ORF
open reading frame
- NAR
New Antigen Receptor
- MYA
million years ago
- VH
Ig heavy chain V region
- L
leader
- CP
connecting peptide
- TM
transmembrane
- CT
cytoplasmic
- FR
framework region
Footnotes
This publication was made possible in part by support from a National Institutes of Health grant no. IP20RR18754 from the Institutional Development Award (IDeA) program of the National Center for Research Resources, the National Science Foundation award IOS-0641382 (to RDM).
Competing Financial Interests The authors declare no competing financial interests.
References
- 1.Rast JP, Anderson MK, Strong SJ, Luer C, Litman RT, Litman GW. Alpha, beta, gamma and delta T cell antigen receptor genes arose early in vertebrate phylogeny. Immunity. 1997;6:1–11. doi: 10.1016/s1074-7613(00)80237-x. [DOI] [PubMed] [Google Scholar]
- 2.Parra ZE, Baker ML, Hathaway J, Lopez AM, Trujillo J, Sharp A, Miller RD. Comparative genomic analysis and evolution of the T cell receptor loci in the opossum Monodelphis domestica. BMC Genomics. 2008;9:111. doi: 10.1186/1471-2164-9-111. [DOI] [PMC free article] [PubMed] [Google Scholar]
- 3.Chen H, Kshirsagar S, Jensen I, Lau K, Covarrubias R, Schluter SF, Marchalonis JJ. Characterization of arrangement and expression of the T cell receptor gamma locus in the sandbar shark. Proc Natl Acad Sci USA. 2009;106:8591–8596. doi: 10.1073/pnas.0811283106. [DOI] [PMC free article] [PubMed] [Google Scholar]
- 4.Parra ZE, Baker ML, Schwarz R, Deakin JE, Lindblad-Toh K, Miller RD. Discovery of a new T cell receptor in marsupials. Proc Natl Acad Sci USA. 2007;104:9776–9781. doi: 10.1073/pnas.0609106104. [DOI] [PMC free article] [PubMed] [Google Scholar]
- 5.Baker ML, Osterman AK, Brumburgh S. Divergent T cell receptor delta chains from marsupials. Immunogenetics. 2005;57:665–673. doi: 10.1007/s00251-005-0030-0. [DOI] [PubMed] [Google Scholar]
- 6.Parra ZE, Baker ML, Lopez AM, Trujillo J, Volpe JM, Miller RD. TCRμ recombination and transcription relative to the conventional TCR during postnatal development in opossums. J Immunol. 2009;182:154–163. doi: 10.4049/jimmunol.182.1.154. [DOI] [PMC free article] [PubMed] [Google Scholar]
- 7.Bininda-Emonds OR, Cardillo M, Jones KE, MacPhee RD, Beck RM, Grenyer R, Price SA, Vos RA, Gittleman JL, Purvis A. The delayed rise of present-day mammals. Nature. 2007;446:507–512. doi: 10.1038/nature05634. [DOI] [PubMed] [Google Scholar]
- 8.Altschul SF, Gish W, Miller W, Myers EW, Lipman DJ. Basic local alignment search tool. J Mol Biol. 1990;215:403–410. doi: 10.1016/S0022-2836(05)80360-2. [DOI] [PubMed] [Google Scholar]
- 9.Vernersson M, Aveskogh M, Munday B, Hellman L. Evidence for an early appearance of modern post-switch immunoglobulin isotypes in mammalian evolution (II); cloning of IgE, IgG1 and IgG2 from a monotreme, the duck-billed platypus, Ornithorhynchus anatinus. Eur J Immunol. 2002;32:2145–2155. doi: 10.1002/1521-4141(200208)32:8<2145::AID-IMMU2145>3.0.CO;2-I. [DOI] [PubMed] [Google Scholar]
- 10.Miska KB, Harrison GA, Hellman L, Miller RD. The Major Histocompatibility Complex in monotremes: An analysis of the evolution of Mhc class I genes across all three mammalian subclasses. Immunogenetics. 2002;54:381–393. doi: 10.1007/s00251-002-0484-2. [DOI] [PubMed] [Google Scholar]
- 11.Tamura K, Dudley J, Nei M, Kumar S. MEGA4: Molecular Evolutionary Genetics Analysis (MEGA) software version 4.0. Mol Biol Evol. 2007;24:1596–1599. doi: 10.1093/molbev/msm092. [DOI] [PubMed] [Google Scholar]
- 12.Hall TA. BioEdit: a user-friendly biological sequence alignment editor and analysis program for Windows 95/98/NT. Nucl Acid Symp Ser. 41:95–98. [Google Scholar]
- 13.Wang X, Olp JJ, Miller RD. On the genomics of immunoglobulins in the gray, short-tailed opossum Monodelphis domestica. Immunogenetics. 2009;61:581–596. doi: 10.1007/s00251-009-0385-8. [DOI] [PMC free article] [PubMed] [Google Scholar]
- 14.Warren WC, Hillier LW, Marshall Graves JA, Birney E, Ponting CP, Grutzner F, Belov K, Miller W, Clarke L, Chinwalla AT, et al. Genome analysis of the platypus reveals unique signatures of evolution. Nature. 2008;453:175–183. doi: 10.1038/nature06936. [DOI] [PMC free article] [PubMed] [Google Scholar]
- 15.Belov K, Miller RD, Ilijeski A, Hellman L, Harrison GA. Isolation of monotreme T cell receptor alpha and beta chains. Immunogenetics. 2004;56:164–169. doi: 10.1007/s00251-004-0679-9. [DOI] [PubMed] [Google Scholar]
- 16.Parra ZE, Arnold T, Nowak MA, Hellman L, Miller RD. TCR gamma chain diversity in the spleen of the duckbill platypus (Ornithorhynchus anatinus) Dev Comp Immunol. 2006;30:699–710. doi: 10.1016/j.dci.2005.10.002. [DOI] [PubMed] [Google Scholar]
- 17.Campbell KS, Backstrom BT, Tiefenthaler G, Palmer E. CART: A conserved antigen receptor transmembrane motif. Semin Immunol. 1994;6:393–410. doi: 10.1006/smim.1994.1049. [DOI] [PubMed] [Google Scholar]
- 18.Schatz DG, Oettinger MA, Baltimore D. The V(D)J recombination activating gene, RAG-1. Cell. 1989;59:1035–1048. doi: 10.1016/0092-8674(89)90760-5. [DOI] [PubMed] [Google Scholar]
- 19.Gambon-Deza F, Espinel CS, Magadan-Mompo S. The immunoglobulin heavy chain locus in the platypus (Ornithorhynchus anatinus) Mol Immunol. 2009;46:2515–2523. doi: 10.1016/j.molimm.2009.05.025. [DOI] [PubMed] [Google Scholar]
- 20.Criscitiello MF, Ohta Y, Saltis M, McKinney EC, Flajnik MF. Evolutionarily Conserved TCR Binding Sites, Identification of T Cells in Primary Lymphoid Tissues, and Surprising Trans-Rearrangements in Nurse Shark. J Immunol. 2010;184:6950–6960. doi: 10.4049/jimmunol.0902774. [DOI] [PMC free article] [PubMed] [Google Scholar]
- 21.Kumar S, Hedges SB. A molecular timescale for vertebrate evolution. Nature. 1998;392:917–920. doi: 10.1038/31927. [DOI] [PubMed] [Google Scholar]
- 22.Criscitiello MF, Saltis M, Flajnik MF. An evolutionarily mobile antigen receptor variable region gene: doubly rearranging NAR-TcR genes in sharks. Proc Natl Acad Sci USA. 2006;103:5036–5041. doi: 10.1073/pnas.0507074103. [DOI] [PMC free article] [PubMed] [Google Scholar]
- 23.Parra ZE, Ohta K, Criscitiello MF, Flajnik MF, Miller RD. The dynamic TCRδ: TCRδ chains in the amphibian Xenopus tropicalis utilize antibody-like V genes. Eur J Immunol. 2010;40:2319–2329. doi: 10.1002/eji.201040515. [DOI] [PMC free article] [PubMed] [Google Scholar]
- 24.Rock EP, Sibbald PR, Davis MM, Chien YH. CDR3 length in antigen-specific immune receptors. J Exp Med. 1994;179:323–328. doi: 10.1084/jem.179.1.323. [DOI] [PMC free article] [PubMed] [Google Scholar]
- 25.Greenberg AS, Avila D, Hughes M, Hughes A, McKinney EC, Flajnik MF. A new antigen receptor gene family that undergoes rearrangement and extensive somatic diversification in sharks. Nature. 1995;374:168–173. doi: 10.1038/374168a0. [DOI] [PubMed] [Google Scholar]
- 26.Stanfield RL, Dooley H, Flajnik MF, Wilson IA. Crystal structure of a shark single-domain antibody V region in complex with lysozyme. Science. 2004;305:1770–1773. doi: 10.1126/science.1101148. [DOI] [PubMed] [Google Scholar]
- 27.Desmyter A, Transue TR, Ghahroudi MA, Thi MH, Poortmans F, Hamers R, Muyldermans S, Wyns L. Crystal structure of a camel single-domain VH antibody fragment in complex with lysozyme. Nature Struct Biol. 1996;3:803–811. doi: 10.1038/nsb0996-803. [DOI] [PubMed] [Google Scholar]
- 28.Mikkelsen TJ, Wakefield MJ, Aken B, Amemiya CT, Chang JL, Duke S, Garber M, Gentles AJ, Goodstadt L, Heger A, et al. Genome of the marsupial Monodelphis domestica reveals adaptive turnover of coding and non-coding sequences. Nature. 2007;447:167–177. doi: 10.1038/nature05805. [DOI] [PubMed] [Google Scholar]
- 29.Kordis D, Lovsin N, Gubensek F. Phylogenomic analysis of the L1 retrotransposons in deuterostomia. Syst Biol. 2006;55:886–901. doi: 10.1080/10635150601052637. [DOI] [PubMed] [Google Scholar]
- 30.Hedrick SM, Cohen DI, Nielsen EA, Davis MM. Isolation of cDNA clones encoding T cell-specific membrane-associated proteins. Nature. 1984;308:149–153. doi: 10.1038/308149a0. [DOI] [PubMed] [Google Scholar]
- 31.Chien YH, Gascoigne NRJ, Kavaler J, Lee NE, Davis MM. Somatic recombination in a murine T-cell receptor gene. Nature. 1984;309:322–326. doi: 10.1038/309322a0. [DOI] [PubMed] [Google Scholar]
- 32.Yanagi Y, Yoshikai Y, Leggett K, Clark SP, Aleksander I, Mak TW. A human T cell-specific cDNA clone encodes a protein having extensive homology to immunoglobulin chains. Nature. 1984;308:145–149. doi: 10.1038/308145a0. [DOI] [PubMed] [Google Scholar]
- 33.Brenner MB, Mclean J, Dialynas DP, Strominger JL, Smith JA, Owen FL, Seidman JG, Ip S, Rosen F, Krangel MS. Identification of a putative second T-cell receptor. Nature. 1986;322:145–149. doi: 10.1038/322145a0. [DOI] [PubMed] [Google Scholar]
Associated Data
This section collects any data citations, data availability statements, or supplementary materials included in this article.