

Non-technical summary
Hypoxia causes an increase in breathing followed by a secondary depression that is most pronounced, and potentially life-threatening, in premature infants. Adenosine triphosphate (ATP) is released in brainstem respiratory networks during hypoxia, where it attenuates the secondary respiratory depression. Mechanisms are unknown but likely to be complex because ATP is degraded by enzymes into ADP, which is excitatory, and adenosine (ADO), which is inhibitory. We demonstrate in mouse, like rat, that ATP in the preBötzinger complex (preBötC), a site critical for inspiratory rhythm generation, increases frequency. Unlike rat, this increase is only observed in mouse if ADO receptors are blocked. Differential ATP sensitivity is likely to reflect that ADO is only inhibitory in mouse, and that mouse preBötC enzymes favour ADO production. Thus, purinergic signalling in preBötC networks appears balanced to favour inhibition in mouse but excitation in rat. Knowledge of purinergic signalling increases our understanding of processes underlying respiratory responses to hypoxia.
Abstract
Abstract
ATP signalling in the CNS is mediated by a three-part system comprising the actions of ATP (and ADP) at P2 receptors (P2Rs), adenosine (ADO) at P1 receptors (P1Rs), and ectonucleotidases that degrade ATP into ADO. ATP excites preBötzinger complex (preBötC) inspiratory rhythm-generating networks where its release attenuates the hypoxic depression of breathing. Its metabolite, ADO, inhibits breathing through unknown mechanisms that may involve the preBötC. Our objective is to understand the dynamics of this signalling system and its influence on preBötC networks. We show that the preBötC of mouse and rat is sensitive to P2Y1 purinoceptor (P2Y1R) activation, responding with a >2-fold increase in frequency. Remarkably, the mouse preBötC is insensitive to ATP. Only after block of A1 ADORs is the ATP-evoked, P2Y1R-mediated frequency increase observed. This demonstrates that ATP is rapidly degraded to ADO, which activates inhibitory A1Rs, counteracting the P2Y1R-mediated excitation. ADO sensitivity of mouse preBötC was confirmed by a frequency decrease that was absent in rat. Differential ectonucleotidase activities are likely to contribute to the negligible ATP sensitivity of mouse preBötC. Real-time PCR analysis of ectonucleotidase isoforms in preBötC punches revealed TNAP (degrades ATP to ADO) or ENTPDase2 (favours production of excitatory ADP) as the primary constituent in mouse and rat, respectively. These data further establish the sensitivity of this vital network to P2Y1R-mediated excitation, emphasizing that individual components of the three-part signalling system dramatically alter network responses to ATP. Data also suggest therapeutic potential may derive from methods that alter the ATP–ADO balance to favour the excitatory actions of ATP.
Introduction
Extracellular ATP acts on seven subtypes of ionotropic P2X (North, 2002) and eight subtypes of metabotropic P2Y receptor (Abbracchio et al. 2003) to support diverse signalling functions in the peripheral and central nervous systems. In central respiratory control, P2 receptor (P2R) signalling is most strongly implicated in chemoreceptor reflexes that regulate arterial O2, and CO2 or pH (Gourine et al. 2005a). During hypoxia, an initial increase in ventilation is followed by a secondary depression that is most pronounced, and potentially life-threatening, in fetal animals and premature infants. ATP contributes to this ventilatory response. It is released from the ventral respiratory column after the initial increase in ventilation where it attenuates the secondary hypoxic ventilatory depression (Gourine, 2005). The ATP excitation likely involves a potent P2Y1R-mediated excitation of preBötC inspiratory networks, which in turn is likely to have both neuronal and astrocytic components (Lorier et al. 2008; Huxtable et al. 2010).
It is also important to consider that the actions of ATP are not determined solely by its actions at P2Rs. ATP signalling is best considered as a three-part system whose effects are determined from a dynamic interaction between the signalling actions of ATP and ADP at P2Rs, the spatial distribution of ectonucleotidases that differentially metabolize ATP into ADP, AMP and adenosine (ADO), and the signalling actions of ADO at P1 receptors (P1Rs). The dynamics of this interaction are highly relevant for respiratory control because ADO is implicated as a respiratory depressant in adult (Eldridge et al. 1984; Yamamoto et al. 1994), newborn (Runold et al. 1989; Herlenius et al. 1997) and especially fetal mammals (Bissonnette et al. 1990). It is also implicated in the hypoxia-induced depression of ventilation (Moss, 2000). The control of swimming onset and offset in tadpoles by a similar ATP–ADO interaction (Dale & Gilday, 1996) suggests that this control mechanism may not be unique to inspiratory networks but represent a more widespread property of rhythmic motor networks. To fully understand the significance of ATP signalling for respiratory control requires the characterization of processes ongoing within each limb of this three-part signalling system.
To this end, we will characterize the purinergic modulation of the preBötC network in mouse. Responses in rat will be simultaneously assessed as a positive control to ensure the validity of any differences between mouse and published responses in rat. The rationale for extending this analysis to mouse is threefold. First, the sensitivity of preBötC networks to P2Y1R excitation has only been reported in neonatal Wistar and Sprague–Dawley (SD) rat (Lorier et al. 2007, 2008; Huxtable et al. 2009, 2010). Determining whether this mechanism is limited to rats is an important step in defining its potential significance in modulation of respiratory rhythm in mammals in general. We will also test whether ADO produced by degradation of ATP in the preBötC is sufficient to inhibit inspiratory rhythm. Reports in intact mammals of many species consistently show that ADO inhibits breathing (Lagercrantz et al. 1984; Eldridge et al. 1985; Burr & Sinclair, 1988; Koos & Matsuda, 1990; Bissonnette et al. 1991; Wilson et al. 2004). Despite this and the clinical significance of ADO signalling for the control of breathing, neither the mechanism(s) nor the site(s) mediating the inhibitory actions of ADO on breathing rhythm have been identified. Brainstem involvement is uncertain. An A1R-mediated inhibition is reported in some mouse studies (Mironov et al. 1999; Vandam et al. 2008) but ADO is often reported to have no effect on brainstem rhythm in rat (Brockhaus & Ballanyi, 2000; Ballanyi, 2004; Ruangkittisakul & Ballanyi, 2010), suggesting a possible species difference. Even in mouse the role of the preBötC in the ADO inhibition is unknown. Some preBötC inspiratory neurons are inhibited by ADO (Mironov et al. 1999), but whether this is sufficient to inhibit frequency will be explored. Ectonucleotidase expression in the preBötC of mouse and rat will also be determined to gain insight into the degree to which differences in ATP response kinetics might be attributed to differential enzyme expression. Third, establishing the ATP sensitivity of murine networks will also be of value given that the modulation of preBötC rhythm by ATP appears to involve both neurons (Lorier et al. 2008) and astrocytes (Huxtable et al. 2010). Transgenic tools for identifying, monitoring and manipulating astrocytes are more readily available in mouse. Baseline data in mouse will facilitate the application of these tools in determining the role of astrocytes in the purinergic modulation of preBötC activity.
Methods
All experiments were conducted in accordance with the guidelines of the Canadian Council on Animal Care and were approved by the University of Alberta Animal Ethics Committee. The experiments comply with the policies and regulations of The Journal of Physiology given by Drummond (2009).
Rhythmic medullary slices
Animals were anaesthetized through inhalation of isoflurane and decerebrated. The brainstem–spinal cord was then isolated in cold artificial cerebrospinal fuid (aCSF) containing the following (in mm): 120 NaCl, 3 KCl, 1.0 CaCl2, 2.0 MgSO4, 26 NaHCO3, 1.25 NaH2PO4, 20 d-glucose, equilibrated with 95% O2–5% CO2. The brainstem–spinal cord was pinned to a wax chuck, and serial 100–200 μm sections were cut in the rostral-to-caudal direction using a vibrating blade microtome (VT1000S, Leica, Nussloch, Germany) and transilluminated to identify anatomical landmarks. Rhythmic, transverse, 700 μm-thick slices of the medulla from SD rats (postnatal day 0–4 (P0–P4)) and Swiss CD mice (postnatal day 0–5 (P0–P5)) were cut with the preBötC at the rostral surface of the slice, –0.35 mm caudal to the caudal aspect of the facial nucleus in rat (Smith et al. 1991; Ruangkittisakul et al. 2006; Lorier et al. 2007) and –0.35 to –0.4 mm caudal to the caudal aspect of the facial nucleus in mouse paying particular attention to the structure of the inferior olive (Ruangkittisakul et al. 2011). Slices were pinned with the rostral surface up on Sylgard resin in a recording chamber (volume, 5 ml) and perfused with aCSF that was recirculated at a flow rate of 15 ml min−1. The concentration of K+ in the aCSF ([K+]e) was raised from 3 to 9 mm at least 30 min before the start of data collection. Medullary slices from neonatal Swiss CD mice and SD rats generated a stable rhythm in 3 mm K+ that then decayed. The majority of protocols in this study involved multiple interventions, and therefore required slices that produced stable inspiratory-related rhythm for extended periods (i.e. >5 h). Therefore, the [K+]e was raised from 3 to 9 mm to produce prolonged, stable rhythm (Ruangkittisakul et al. 2006).
Electrophysiological recordings
Inspiratory activity was recorded, using glass suction electrodes (A-M Systems, Carlsborg, WA, USA), from cut ends of XII (hypoglossal) nerve rootlets and directly from the ventrolateral surface of the slice. Surface field potentials were recorded using a four-axis manual manipulator to place a suction electrode (120 μm inside diameter) on the surface of the slice over the approximate region of the ventral respiratory cell column (VRC) (Ramirez et al. 1997). The pipette was systematically moved in steps corresponding to one-half of the pipette diameter until the most robust signal was detected. Signals were amplified, bandpass filtered (100 Hz to 5 kHz), full-wave rectified, integrated using a leaky integrator (τ = 25 or 50 ms), and displayed using Axoscope 9.2 (Molecular Devices, Sunnyvale, CA, USA). Data were saved to computer using a Digidata 1322 A/D board and AxoScope 9.2 software (Molecular Devices) for off-line analysis. All recordings were conducted at room temperature (22–24°C).
Drugs and their application
Adenosine 5′-triphosphate disodium salt (ATP) (P2R agonist, 100 μm microinjected) and adenosine (A1,2,3 agonist, 500 μm microinjected) were obtained from Sigma-Aldrich. All other chemicals were obtained from Tocris Bioscience including: SP ([Sar9-Met(O2)11]-substance P, (NK1R agonist, 1 μm microinjected); MRS 2279 ((1R*,2S*)-4-[2-chloro-6-(methylamino)-9H-purin-9-yl]-2-(phosphonooxy)bicyclo[3.1.0]hexane-1-methanol dihydrogen phosphate ester diammonium salt, P2Y1R antagonist, 500 μm microinjected); MRS 2365 ([[(1R,2R,3S,4R,5S)-4-[6-amino-2-(methylthio)-9H-purin-9-yl]-2,3-dihydroxybicyclo[3.1.0]hex-1-yl]meth-yl]diphosphoric acid mono ester trisodium salt), P2Y1R agonist, 100 μm microinjected); and DPCPX (8-cyclopentyl-1,3-dipropylxanthine), A1R antagonist, microinjected at 2 μm local, bath-applied at 0.5 μm and given 15 min to equilibrate). A P2XR antagonist cocktail was bath-applied and given 15 min to equilibrate. It consisted of: TNP-ATP (50 μm, selective for P2X1, P2X3 and P2X2/3 receptors in the nm range, but can also affect P2X2, P2X4, P2X6, P2X1/5 and P2X7 receptors at concentrations several orders of magnitude higher (Lambrecht, 2000; Lorier et al. 2007)), NF023 (8,8'-[carbonylbis(imino-3,1-phenylenecarbonylimino)] bis-1,3,5-naphthalene-trisulphonic acid, 10 μm, selective for P2X1) (Soto et al. 1999), 5-BDBD (5-(3-bromophenyl)-1,3-dihydro-2H-benzofuro[3,2-e]-1, 4-diazepin-2-one, 50 μm, selective for P2X4) (Donnelly-Roberts et al. 2008) and A740003 (N-[1-[[(cyanoamino)(5-quinolinylamino)methylene]amino]-2, 2-dimethylpropyl]-3,4-dimethoxybenzeneacetamide, 10 μm, selective for P2X7) (King, 2007).
Drugs were prepared as stock solutions in aCSF and frozen in aliquots. The final concentration of K+ in the drug solutions was matched to that of the aCSF. Exceptions were ATP and ADO, which were made fresh on the day of the experiment, and DPCPX, which was made up in DMSO and diluted such that the final concentration of DMSO never exceeded 0.01%. In slice preparations, drugs were unilaterally applied locally to the preBötC via triple-barrelled pipettes (5–6 μm outer diameter per barrel) pulled from borosilicate glass capillaries (World Precision Instruments, Sarasota, FL, USA). Care was taken to ensure that the outer tip diameter was within this range because fluorescent imaging (40× objective) of Lucifer yellow-filled triple-barrelled pipettes established that pipettes in this range did not leak, but they did leak if tip diameter exceeded 6.5 μm. Avoiding leakage was essential because of the potential for agonist evoked P2R desensitization or internalization. Drug microinjections were controlled by a programmable stimulator (Master-8; A.M.P.I., Jerusalem, Israel) connected to a picospritzer (Spritzer4 Pressure Micro-Injector, 18 psi). Consecutive agonist applications were separated by a minimum of 15 min. We did not systematically assess whether this was the minimum time interval required for consistent responses, but it was sufficient for reproducible responses. The concentrations of drugs used in the present study should not be directly compared with those in experiments in which similar agents are applied in the bath or directly to isolated cells. The concentration of drug decreases exponentially with distance from the pipette tip, and previous experiments with this preparation have established that drug concentration in the pipette must be ∼10-fold greater than the bath-applied concentration to produce similar effects (Liu et al. 1990).
The drug injection site was established by first placing a suction electrode on the rostral surface of the slice and moving in 50 μm increments in both the x and y planes to identify the region that gave the largest amplitude inspiratory signal in-phase with the XII nerve recording. This served as an initial reference point from which to begin functionally mapping the ventrolateral medulla for the site that produced the most rapid-onset frequency increase in response to locally injected substance P (SP). The rationale is that as distance from the site of maximum sensitivity decreases, the onset delay will also decrease since drug will have less distance to diffuse to its site of action. The neurokinin 1 (NK1) receptor agonist SP (1 μm) was locally injected under the surface electrode using a triple-barrelled drug pipette. The drug pipette was then systematically moved in 50 μm steps along the dorsoventral axis and SP injections (1 μm, 10 s) repeated at 15 min intervals. The pipette was then moved to the maximally responsive position on the dorsoventral axis and injections continued on the mediolateral axis. Traces were immediately examined to identify the site of maximum SP sensitivity, the SP ‘hotspot’, where SP evoked a frequency increase that was at least twofold greater than baseline and occurred in the first interburst interval following drug onset. Identifying the injection site in this manner was essential because our previous data in rat revealed that, while the sites of maximum SP sensitivity and maximum ATP sensitivity correspond very closely, ATP is rapidly hydrolysed in the preBötC and undergoes limited diffusion compared to SP. In other words, if injection sites are outside the hotspot, it is possible to evoke a significant SP response but no ATP response. Based on these criteria, the established sensitivity of preBötC networks to SP (Johnson et al. 1996; Gray et al. 1999; Lorier et al. 2007; Huxtable et al. 2009, 2010), the close correspondence between the sites of maximum SP and maximum ATP sensitivity (the ATP hotspot) (Lorier et al. 2007), and that the ATP hotspot has been identified via histological and immunohistochemical criteria as the preBötC (Lorier et al. 2007), we are confident that the SP hotspot corresponds to the preBötC. Similar criteria were applied to define the MRS 2365 (100 μm) hotspot in mouse and ATP (100 μm) hotspot in rat. We have previously demonstrated that ATP diffuses minimally through the medullary tissue (Funk et al. 2008a; Huxtable et al. 2009) and that to evoke a frequency increase the injection site must be very close to the ATP ‘hotspot’, which corresponds histologically and immunohistochemically in postnatal animals to the preBötC (Lorier et al. 2007).
Mapping studies
Previous mapping studies in rhythmic medullary slices from neonatal rat demonstrated that the maximum potentiation of frequency by locally microinjected ATP occurs in the preBötC (Lorier et al. 2007). This mapping procedure was performed here in mice using 10 s applications of 100 μm MRS 2365 to determine if the P2Y1R sensitive-site was also spatially restricted. Mapping began with injection of MRS 2365 (10 s, 100 μm) into the SP hotspot. MRS 2365 responses were then mapped by moving the injection site in 100 μm increments along the dorsoventral axis until the response diminished by at least 50% of maximum. The pipette was then moved to the maximally responsive position on the dorsoventral axis and injections continued on the mediolateral axis. Microinjections were repeated at 15 min intervals. At the end of the mapping procedure, the pipette was returned to the site of maximum MRS 2365 sensitivity (which in all cases corresponded to the SP hotspot) for a final injection. Physical interference between the surface extracellular electrode and the injection pipette prevented microinjections medial to the recording pipette.
Real time-PCR
Brainstems from mice and rat were isolated and sectioned as described above for rhythmic slice preparations. When landmarks for the rostral border of the preBötC were apparent, a single 300 μm section was isolated and pinned down on Sylgard in sterile aCSF. PreBötC tissue from mice and rats was then removed bilaterally using a 21 gauge tissue punch. Two punches from each animal were put directly into lysis buffer (Dynabead mRNA DIRECT kit; Invitrogen Molecular Probes, Carlsbad, CA, USA) and stored at –80°C until needed. mRNA was extracted using the same Dynabead mRNA DIRECT kit (Invitrogen Molecular Probes). mRNA was used as the template to make cDNA using High Capacity Reverse Transcription kit (Applied Biosystems, Carlsbad, CA, USA) with oligo d(T) primers. The product of the reverse transcription reaction was then cleaned using MinElute PCR purification kit (Qiagen, Mississauga, Ontario, Canada) to obtain a pure and concentrated sample that was used directly in the real-time PCR reaction, which was run in triplicate. A standard curve was run in triplicate for each transcript of interest to obtain the relationship between starting copy number and threshold cycle number. The standard curve was generated using a plasmid containing the full cDNA of interest that was diluted to contain a specific copy number: 2×101 to 2×10⁸. Clones for ENTPDase 1, 2 and 3 (the ecto-nucleoside triphosphate diphosphohydrolases) were generous gifts from H. Zimmerman (Institute of Cell Biology and Neuroscience, Goethe-University). Those for tissue non-specific alkaline phosphatase (TNAP), ecto5′ ectonucleotidase and cyclophilin A were obtained commercially (Open Biosystems). An icycler (Bio-Rad, Mississauga, Ontario, Canada) and 2× SYBR Green master mix (Applied Biosystems) were used to run the PCR and the data were retrieved to show specific starting copy number in each sample. The housekeeping gene cyclophilin A was used as an internal control to facilitate comparison between runs and species cDNA. Genes of interest were ENTPDase1, 2 and 3, TNAP and ecto5′ ectonucleotidase. The following sense (s) and antisense (as) primer sequences for each transcript were used: ENTPDase-1(s 5′-GGAGCCTGAAGAGCTACCC, as 5′-GTCTGATTTAGGGGCACGAA, accession number U81295); ENTP-Dase-2 (s 5′-CTTCGGGATGTACCCAGAGA, as 5′-CAGCAGGTAGTTGGCAGTCA, accession number Y11 835); ENTPDase-3 (s 5′-ATGTGTATCAGTGGCCAGCA, as 5′-CTCATTTTGCAACCTCAGCA, accession number AJ437217); TNAP (s 5′-CCTTGAAAAATGCCCTGAA, as 5′-CTTGGAGAGAGCCACAAAGG, accession number BC088399); ECTO5′(s 5′-ATGCCTTTGGCAAATACCTG, as 5′-GGTTTCCCATGTTGCACTCT, accession number BC098665), and CYCLA (s 5′-CACCGTGTTCTTCGACATCAC, as 5′-CCAGTGCTCAGAGCACGAAAG). Temperature curves were run for each primer pair to establish conditions in which primer efficiencies were all >95%. Expression levels of the ectonucleotidase genes of interest were first measured as the ratio of the starting copy number relative to the starting copy number of cyclophilin A. From this, we assessed the total ectonucleotidase mRNA expression as the sum of all isoforms and then calculated the percentage of this total contributed by each isoform (eg. starting copy no. for each isoform/(∑ starting copy number for TNAP, ENTPDase 1, 2, 3 and ecto5′ ectonucleotidase) × 100).
Data analysis
The effects of a drug on frequency of integrated inspiratory bursts recorded via suction electrodes from XII nerve roots were assessed off-line using pCLAMP 9.2 (Clampfit) and Microsoft Excel software. Values of frequency during the drug were compared with the average value during the 2 min control period that immediately preceded drug application. The maximum effect of a drug on frequency was determined as the maximum (or minimum) value measured in the moving average of inspiratory frequency (calculation based on the average of three consecutive bursts) during the first minute after injection. The time course of the response was obtained by averaging data points in 30 s bins for the 1 min period immediately before drug application, in 10 s bins for the first 60 s after the onset of drug application (first 30 s only for SP and MRS 2365), and in 30 s bins for the remainder of the time. Parameters are reported relative to control (predrug or prestimulus) levels, as means ± standard error of the mean (SEM). Statistical comparison of means was performed on raw data unless otherwise stated using GraphPad Prism version 4 (GraphPad Software Inc., La Jolla, CA, USA). Statistical comparison of relative data was performed only after verification of normality. Differences between means were identified using a one-way ANOVA with Dunnett's multiple comparison test or via two-way repeated measures ANOVA. The proportional contribution of mRNA for TNAP and ENTPDase2 isoforms to the total ectonucleotidase mRNA was then compared in mice vs. rat using a one-way ANOVA with Bonferroni's correction for multiple comparisons. All values are reported as means ± SEM. Values of P < 0.05 were assumed significant.
Results
Effects of ATP on preBötC rhythm differ between mouse and rat
To test whether ATP directly modulates preBötC rhythm generating networks of mouse, as seen previously in SD and Wistar rat (Lorier et al. 2004, 2007; Huxtable et al. 2009), we locally applied ATP to the preBötC of rhythmically active medullary slices of Swiss CD mice. The injection site for ATP within the preBötC was established using the mapping protocol developed previously (Lorier et al. 2007; Huxtable et al. 2009, 2010) based primarily on the functional criterion that activation of NK1Rs in the preBötC evokes a rapid-onset increase in burst frequency (Johnson et al. 1996; Gray et al. 1999). When injected into the site of maximum sensitivity (the SP hotspot), SP (1 μm) produced a rapid-onset, 2.70 ± 0.43-fold increase in burst frequency that peaked within 10 s of SP application and remained significantly greater than baseline frequency until 90 s after drug onset (Fig. 1A and B, n = 10, P < 0.05). Local injection of ATP (100 μm) into the same site had no significant effect on inspiratory frequency. ATP caused only small, statistically insignificant fluctuations in frequency.
Figure 1. Differential effects of ATP on preBötC rhythm in mouse and rat.
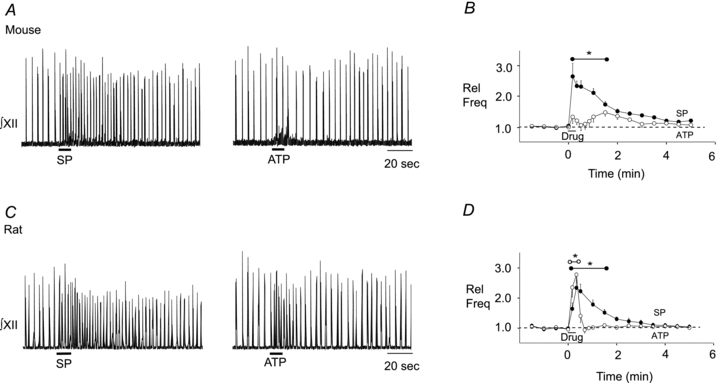
Integrated XII nerve (∫XII) recordings from a medullary slice preparation showing responses to local application of SP (1 μm, 10 s) and ATP (0.1 mm, 10 s) in the preBötC of mouse (A) and rat (C). Group data illustrating the time course of the response evoked by each agonist in mouse (B, n = 10) and rat (D, n = 6) (solid circle symbol, SP; open circle symbol, ATP). *Range over which values were significantly different from control. Error bars indicate SEM. Rel Freq, relative frequency.
Given the surprising finding that ATP was without effect in the mouse preBötC, we performed parallel experiments in SD rat as a positive control and to verify previous data (Lorier et al. 2004, 2007; Huxtable et al. 2009, 2010). SP responses in rat were similar to those in mouse. SP produced a rapid onset, 2.30 ± 0.23-fold increase in frequency that remained significantly elevated above baseline for 90 s (Fig. 1C and D, n = 6, P < 0.05). In contrast, ATP responses were markedly different between rat and mouse. As seen previously in SD and Wistar rats (Lorier et al. 2004, 2007; Huxtable et al. 2009, 2010), local application of ATP (0.1 mm; 10 s) produced a rapid-onset, short duration, 2.77 ± 0.05-fold increase in burst frequency that was significantly greater (one-way ANOVA, Dunnett's multiple comparison, n = 6, P < 0.01) than baseline for 20 s (Fig. 1C and D).
PreBötC of mouse is directly sensitive to modulation by P2Y1Rs
The frequency effects of ATP in the preBötC of postnatal rat are mediated primarily by P2Y1Rs (Lorier et al. 2007). However, because ATP has multiple signalling actions via activation of P2X- and P2YRs, we hypothesized that the lack of an ATP-evoked frequency effect in mouse reflects that ATP is acting on other purinergic receptors to counteract a P2Y1R-mediated frequency increase. As an initial test of this hypothesis, we assessed whether the preBötC rhythm generating network in mice is sensitive to P2Y1R modulation by locally applying a P2Y1R agonist (MRS 2365) to the preBötC. As previously, parallel experiments in rat served as positive controls. Injection of MRS 2365 (0.1 mm, 10 s) into the site of maximum SP sensitivity produced a significant 2.63 ± 0.20-fold (n = 10, P < 0.01) and 2.01 ± 0.08-fold (n = 6, P < 0.01) frequency increase in mouse (Fig. 2A) and rat (Fig. 2B) slice preparations, respectively. Increases remained elevated above baseline frequency for 60 s (mouse) and 30 s (rat) (Fig. 2C, one-way ANOVA, Dunnett's multiple comparison, P < 0.05).
Figure 2. P2Y1R activation in the preBötC increases frequency in mouse and rat.
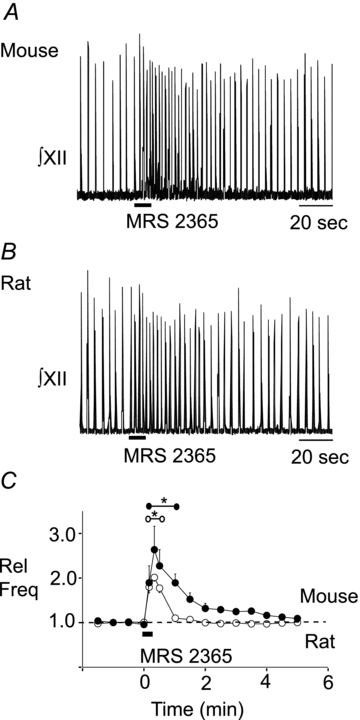
Integrated XII nerve (∫XII) recordings from a medullary slice preparation showing responses to local application of the P2Y1R agonist MRS 2365 (0.1 mm, 10 s) in the preBötC of mouse (A) and rat (B). Group data (C) illustrating the time course of the response evoked by MRS 2365 in mouse (n = 10, •) and rat (n = 6, ○). *Range over which values were significantly different from control. Error bars indicate SEM. Rel Freq, relative frequency.
The site of maximum P2Y1R sensitivity corresponds to the site of maximum SP sensitivity
To establish in mouse that the site at which frequency is maximally sensitive to SP corresponds to the site of maximum P2Y1R sensitivity, as well as the spatial selectivity of the P2Y1R-mediated frequency increase, we injected MRS 2365 in a grid-like fashion around the SP hotspot and mapped the P2Y1R evoked frequency increase (Lorier et al. 2007). The MRS 2365-mediated increase in frequency decreased when microinjection sites were moved away from the hotspot in any direction. This is shown for a series of injections applied progressively more ventral from the identified SP hotspot in a single rhythmic slice. The frequency increase evoked by MRS 2365 decreased progressively as the injection site was moved ventrally. At 300 μm ventral, MRS 2365 had no effect (Fig. 3A). Group data in Fig. 3B are consistent with this and show that when MRS 2365 is microinjected 100 μm lateral to the hotspot, responses decreased to 0.75 ± 0.1 of the response evoked at the SP hotspot. In the dorsoventral axis, responses decreased to 0.56 ± 0.05, 0.51 ± 0.06 and 0.44 ± 0.07 of maximum when injections were made 100, 200 and 300 μm dorsal to the SP hotspot (Fig. 3B), and to 0.63 ± 0.1, 0.49 ± 0.05 and 0.36 ± 0.05 of the maximum when injections were made 100, 200 and 300 μm ventral to the hotspot (Fig. 3A and B). All frequency responses evoked by MRS 2365 outside the SP hotspot were significantly smaller than that induced at the SP hotspot (n = 5, one-way ANOVA, Dunnett's multiple comparison, P < 0.01). These data indicate that SP and MRS 2365 act within the same site to maximally excite inspiratory rhythm. Data also establish that P2Y1R sensitivity of the inspiratory rhythm is not a general property of the ventrolateral medulla but a property that is restricted to a specific region.
Figure 3. P2Y1R potentiation of frequency in mouse is spatially restricted to the preBötC.
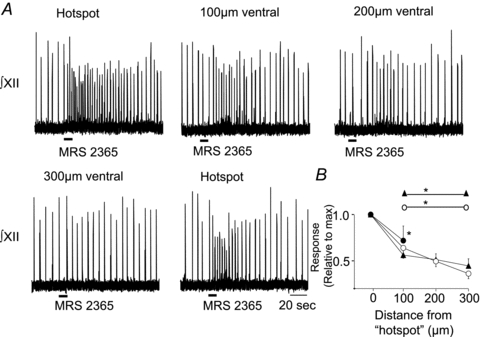
A, integrated XII nerve (∫XII) recordings from a mouse medullary slice preparation illustrating the effects on inspiratory-related output of locally applying 0.1 mm MRS 2365 (P2Y1R agonist) at the site of maximum SP sensitivity (hotspot) in the VRC and at sites of varying distance from the hotspot. B, group data illustrating P2Y1R agonist responses evoked when injections were made at increasing distances from the hotspot in the ventral (n = 5, ○), dorsal (n = 5, ▴) and lateral (n = 5, •) directions. Data are plotted relative to the maximum response evoked at the hotspot. *Significantly different from maximum response. Error bars indicate SEM.
P2 and P1R interactions mediate the effects of ATP in mouse preBötC
We hypothesized that the different effects of ATP and the hydrolysis-resistant P2Y1R agonist MRS 2365 on frequency in the mouse reflected degradation of ATP to ADO and, in the case of ATP, coactivation of excitatory (P2Y1) and inhibitory (P1) receptor mechanisms. We compared the effect of local application of ATP to the SP hotspot, before and after block of A1Rs via local preapplication of the A1R antagonist DPCPX (Fig. 4A) into the preBötC. DPCPX was used because the inhibitory actions of ADO within the preBötC of mice are primarily mediated through A1R (Mirinov et al. 1999).
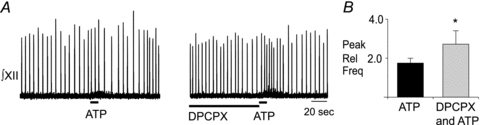
Figure 4. DPCPX in the preBötC of mouse unmasks an ATP-mediated frequency increase.
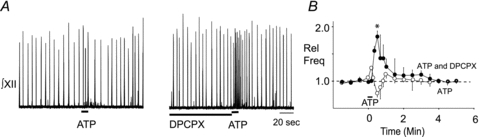
A, integrated XII nerve (∫XII) recordings from a mouse medullary slice preparation showing responses to local application of ATP (0.1 mm, 10 s; left trace) under control conditions and after a 90 s preapplication of an A1R antagonist (2 μm DPCPX; right trace). B, group data illustrating the time course response evoked by ATP alone (n = 6, ○) and in the presence of DPCPX (n = 6, •). *Significant difference from control. Error bars indicate SEM. Rel Freq, relative frequency.
As seen previously in Fig. 1, although local application of ATP alone evoked minor fluctuations in mouse rhythm (Fig. 4A), none of these changes was significant (Fig. 4B). However, when applied after DPCPX (2 μm, 90 s), ATP produced a significant 1.82 ± 0.08-fold increase in frequency that became significantly greater than baseline 20 s after the onset of the ATP application and remained elevated above control for the next 30 s (n = 6; one-way ANOVA, Dunnett's multiple comparison, P < 0.01). In addition to demonstrating that ATP alone has no effect on baseline frequency (one-way ANOVA) and that it does increase frequency relative to baseline in the presence of DPCPX (one-way ANOVA), comparison of the ATP response in control with that in DPCPX revealed that the frequency response in DPCPX is significantly elevated compared to the control ATP response (two-way repeated measures ANOVA, time–drug interaction P < 0.0005, df = 17, F = 2.73). The unmasking of an ATP-evoked frequency increase by the A1R antagonist DPCPX suggests that ATP is ordinarily broken down to ADO, which acts via A1Rs to counteract the effects of ATP at P2Y1Rs. The caveat with this experiment is that the concentration of DPCPX produced in the tissue by local application of 2 μm DPCPX, which will be in the range of 0.2 μm due to diffusion and dilution from the point source of the pipette tip, has the potential to affect A2ARs. We therefore repeated these experiments using a 20-fold lower concentration of DPCPX in the pipette (0.1 μm). The resulting tissue concentration of DPCPX of approximately 0.01 μm is 3-fold lower than the IC50 for A2ARs (Klotz, 2000) and should be selective for A1Rs. Under these conditions, DPCPX significantly enhanced the effects of ATP on inspiratory frequency from 1.74 ± 0.22 in control to 2.72 ± 0.62 (Fig. 5, n = 6, paired t test, P = 0.004) in DPCPX. These findings further support our hypothesis that when ATP is injected into the preBötC an A1R-mediated inhibition counteracts a P2Y1R-mediated excitation.
Figure 5. A1R antagonism in the preBötC of mouse unmasks an ATP-mediated frequency increase.
A, integrated XII nerve (∫XII) recordings from a mouse medullary slice preparation showing responses to local application of ATP (0.1 mm, 10 s; left trace) under control conditions and after a 90 s preapplication of an A1R antagonist (0.2 μm DPCPX; right trace). B, group data illustrating the peak frequency effect evoked by ATP alone and in the presence of DPCPX (n = 6). *Significant difference from ATP alone. Error bars indicate SEM. Rel Freq, relative frequency.
To further explore this hypothesis, we tested whether P2Y1R antagonists could block the excitatory effects of ATP once they are unmasked by DPCPX. We bath-applied DPCPX (0.2 μm) and then compared the effects on frequency of locally applying ATP into the preBötC before and immediately after preapplication of the P2Y1R antagonist (90 s, 500 μm). When applied alone (with DPCPX in the bath throughout the experiment), ATP evoked a significant 1.75 ± 0.13-fold increase in frequency compared to the control baseline frequency (Fig. 6A and B, n = 6, one-way ANOVA, Dunnett's multiple comparison, P < 0.01). Following preapplication of MRS 2279, ATP no longer had any effect on baseline frequency (Fig. 6A and B, n = 6, one-way ANOVA, Dunnett's multiple comparison). In addition to comparing frequency values during drug to those observed pre-drug, a comparison of the frequency responses evoked by ATP alone and following preapplication of MRS 2279 revealed that the frequency response following MRS 2279 was significantly smaller than control (Fig. 6A and B, n = 6, two-way repeated measures ANOVA, time–drug interaction P < 0.0001, df = 34, F = 4.685). The inhibitory actions of MRS 2279 were completely reversible. After 15 min of washout, ATP produced a 1.79 ± 0.22-fold increase in frequency (Fig. 6A and B).
Figure 6. P2Y1Rs contribute to the ATP-evoked frequency increase in mouse.
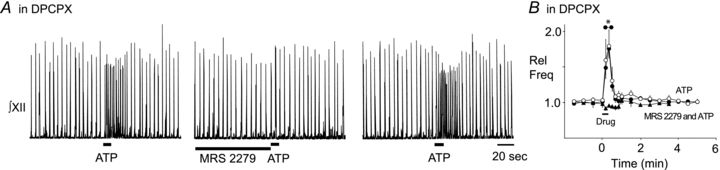
A, integrated XII nerve (∫XII) recordings from a mouse medullary slice preparation illustrating the responses evoked in bath-applied DPCPX, by applying ATP (0.1 mm, 10 s; left trace) under control conditions, after a 90 s preapplication of P2Y1R antagonist, MRS 2279 (0.5 mm; middle trace) and during recovery (0.1 mm; right trace). B, group data illustrating the time course of the response evoked in bath-applied DPCPX by ATP alone (n = 6, ○) in the presence of MRS 2279 (n = 6, ▴) and during recovery (•). *Significantly different from control. Error bars indicate SEM. Rel Freq, relative frequency.
While the excitatory effects of ATP appear to be completely mediated by P2Y1Rs, there is immunohistochemical and electrophysiological evidence of P2XRs in the ventrolateral medulla (Thomas et al. 2001; Gourine et al. 2003). To determine if P2XRs counteract the P2Y1R excitatory effects of ATP in the preBötC, a P2X antagonist cocktail consisting of TNP-ATP (50 μm), NF023 (10 μm), 5-BDBD (50 μm) and A740003 (10 μm) was bath-applied. ATP was without effect before and after local preapplication of the P2XR antagonist cocktail (one-way ANOVA, n = 5; data not shown), i.e. preapplication of the P2X antagonist cocktail did not unmask a significant ATP excitation.
ADO differentially affects preBötC rhythm in mouse and rat
At least two factors could contribute to our observation that in the rat ATP alone is excitatory, while in the mouse ATP is only excitatory in the presence of an A1R antagonist. First, we hypothesized that preBötC rhythm generating networks of postnatal mice are more sensitive to ADO-mediated inhibition than rat. To test this, we compared in rhythmic slices from postnatal mouse and rat the effects on inspiratory rhythm of locally applying ADO directly into the preBötC, as defined using the SP mapping protocol described previously. In mice, ADO (500 μm, 30 s) reduced inspiratory frequency to 0.69 ± 0.06 of control. Frequency remained significantly below control for the interval between 30 and 60 s after the onset of ADO application (Fig. 7B, n = 6, one-way ANOVA, Dunnett's multiple comparison, P < 0.05). Similar injections in rat had no effect on baseline inspiratory frequency (Fig. 7A and B, n = 6).
Figure 7. Differential effects of ADO on preBötC rhythm in mouse and rat.
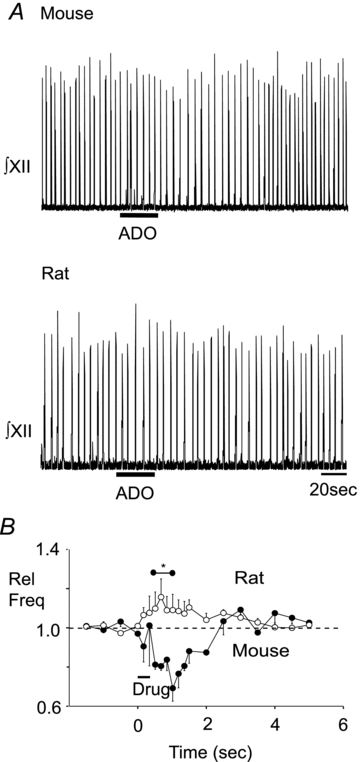
A, integrated XII nerve (∫XII) recordings from a medullary slice preparation illustrating responses evoked by local application of ADO (500 μm, 30 s) into the preBötC of mouse (top trace) and rat (bottom trace). B, group data illustrating the time course of the response evoked by ADO in mouse (n = 6, •) and rat (n = 6, ○). *Temporal range over which mouse values were significantly different from control. Error bars indicate SEM. Rel Freq, relative frequency.
Ectonucleotidase isoform expression in the preBötC differs between mouse and rat
We also hypothesized that the differential ATP sensitivity in mouse and rat reflects differential expression of ectonucleotidases in the preBötC. Specifically, we hypothesized that the complement of ectonucleotidase isoforms in the preBötC of mouse favours inhibition via rapid degradation of ATP directly to ADO, while in the rat it favours excitation through generation of ADP. This was based on the observations that ectonucleotidase-mediated degradation of ATP is a key determinant of ATP response kinetics in the preBötC of rat (Huxtable et al. 2009), and increasing evidence for spatial heterogeneity of ectonucleotidase expression between brain regions (Langer et al. 2008). To test this hypothesis we collected preBötC tissue punches from mouse and rat, extracted mRNA and used real-time PCR to compare levels of mRNA expression for the five major ectonucleotidase isoforms involved in ATP degradation. These included ENTPDase 1, 2 and 3, TNAP and ecto5′-ectonucleotidase. The ENTPDase isoforms 1, 2 and 3 all degrade ATP to AMP but with different affinities. ENTPDase 2 is unique in that it has 100-fold higher affinity for ATP than ADP and will therefore lead to the accumulation of ADP in an environment with excess ATP as substrate. Importantly, ADP is a stronger P2Y1R agonist than ATP. TNAP completely degrades ATP to ADO, while ecto5′ ectonucleotidase degrades AMP to ADO. Based on our hypothesis, we predicted that TNAP would be prevalent in mice while ENTPDase 2 would be dominant in rat. mRNA copy number for each enzyme isoform was first expressed relative to cyclophilin A. Since we cannot be certain that cyclophilin A expression levels are the same in preBötC punches from mouse and rat, we cannot directly compare these ratios between mouse and rat. Instead, we simply compared the proportion that each isoform contributed to the total ectonucleotidase mRNA. As predicted, TNAP was the most highly expressed isoform in the mouse preBötC, while ENTPDase 2 was the most highly expressed isoform in rat. TNAP comprised 79.7 ± 3.8% of the total ectonucleotidase mRNA in mouse (Fig. 8, n = 6), which was a significantly greater proportion than in rat (17.7 ± 0.8%, n = 4, P < 0.001). In contrast, ENTPDase 2 comprised 54.6 ± 1.3% of the total ectonucleotidase mRNA in rat and this was significantly greater than its proportional expression in mouse (7.3 ± 1.8%) (one-way ANOVA, Bonferroni multiple comparison, P < 0.001).
Figure 8. Real-time PCR analysis reveals differential expression of ectonucleotidase isoforms in preBötC tissue punches from mouse and rat.
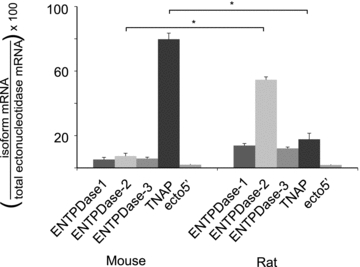
The percentage contribution of each ectonucleotidase isoform to the total ectonucleotidase mRNA expressed in preBötC punches from mouse (n = 6) and rat (n = 4). Error bars indicate SEM. *Significant difference between the compared columns.
Discussion
Differential sensitivity of rat and mouse preBötC networks to ATP
ATP in the preBötC of neonatal Wistar and SD rat evokes a biphasic response comprising a rapid, P2Y1R-mediated increase that peaks within 10–20 s, followed by a secondary inhibition that reaches a nadir ∼30–40 s after drug onset (Lorier et al. 2007; Huxtable et al. 2009). The kinetics of the frequency response in rat closely follow the concentration of ATP in the preBötC (Huxtable et al. 2009), which is in large part determined by ectonucleotidases that degrade ATP ultimately to ADO. The source of the secondary frequency decrease in rats is not known. It is variable in magnitude, appears to be more prominent in Wistar than SD rats and is dependent on ATP degradation since it is absent when non-hydrolysable ATP agonists are used (Lorier et al. 2007). In fetal rats, an ADO contribution is likely since a basal ADO tone reduces frequency, and blockade of ADORs enhances the ATP-evoked frequency increase (Huxtable et al. 2009). However, in postnatal rats neither of these effects are present and the secondary inhibition (Huxtable et al. 2009) cannot be blocked with ADO antagonists (Funk et al. 2008a). That this secondary inhibition is not obvious in Fig. 1 is likely to reflect in part that we are using SD rats. Most significant, however, is that the inhibition is very brief (1–2 cycles) and that its timing varies between preparations. Thus, when group data are plotted as a time course relative to ATP onset as in Fig. 1, this secondary decrease in frequency is often obscured (Lorier et al. 2007; Huxtable et al. 2009).
Given the potency of ATP in the rat preBötC, our demonstration that ATP does not significantly affect the activity of preBötC inspiratory networks in postnatal mice was very surprising. Several factors could account for this differential sensitivity. PreBötC networks in mice may simply be insensitive to P2 and P1R modulation. Alternatively, preBötC networks of mice might be sensitive to ATP but the P2Y1R-mediated excitation previously characterized in rat may be obscured by an opposing inhibitory mechanism, including actions of ATP at other P2Rs, actions of the inhibitory ATP metabolite ADO at P1Rs, or differential expression of ecotnucleotidases in the preBötC of mice that underlies a more rapid degradation of ATP to its inactive (eg. AMP) or inhibitory (ADO) metabolites.
P2Y1 receptor sensitivity
Our data show conclusively that the preBötC network of mouse is highly sensitive to the excitatory effects of P2Y1R activation. Application of a P2Y1R selective agonist potently increased frequency when applied to the preBötC as defined by the SP hotspot. Several lines of evidence support the finding that the SP hotspot corresponds to the preBötC. First, it is well established that SP excites preBötC networks in mice and rat and this response has been used as a functional marker for the preBötC (Johnson et al. 1996; Gray et al. 1999; Lieske et al. 2000). NK1R immunoreactivity is the anatomical marker used most extensively for identifying the preBötC (Gray et al. 1999, 2001; Guyenet & Wang, 2001; Wang et al. 2001; Pagliardini et al. 2003; Pagliardini et al. 2005) and while NK1R expression is not limited to the preBötC, it is the most densely labelled region in the ventral medulla. Second, our previous mapping studies in rat revealed that the site of maximum ATP sensitivity corresponds closely with that of SP, and that this site corresponds to the preBötC based on anatomy and NK1R immunolabelling (Lorier et al. 2007). Our functional identification of the preBötC was based on the site at which SP evoked the maximum, most rapid-onset frequency increase; i.e. the frequency increase occurred in the first interburst interval following drug onset. The latter criterion was most useful based on the rationale that as distance to the site of maximum sensitivity decreases, the onset delay also decreases because less time is required for the drug to diffuse to its site of action. We are therefore confident that the lack of an ATP response in mice does not reflect that injection sites were outside the preBötC. This is corroborated by the fact that when A1Rs were blocked, ATP caused frequency to increase.
In addition, mapping experiments using the P2Y1R agonist MRS 2365 confirmed that the site at which frequency is maximally sensitive to SP corresponds to the site of maximum P2Y1R sensitivity. As seen for ATP responses in rat (Lorier et al. 2007), the MRS 2365 effect also decreases with distance from the hotspot. The ATP response in rat was more spatially restricted than the P2Y1R effect in mouse, but this is expected since ATP is rapidly degraded in the preBötC and undergoes very limited diffusion. MRS 2365 is hydrolysis resistant and is expected to diffuse over greater distances.
The cellular mechanisms underlying the P2Y1R excitation in mice are not known. In rat it most likely reflects activation of neurons and glia. ATP evokes inward currents in virtually all preBötC inspiratory neurons tested, including pacemaker neurons, via either the inhibition of a resting K+ channel or activation of a mixed cation current (Lorier et al. 2008). P2Y1Rs, in contrast, primarily activate a mixed cation current in inspiratory neurons. Thus, it is the activation of this mixed cation current that most likely mediates the neuronal component of the ATP frequency increase. Additional possibilities are that P2Y1Rs influence rhythm by modulating the persistent Na+ current (INaP) or the calcium-dependent, non-selective cation (ICAN) current, which underlie pacemaker activity of preBötC inspiratory neurons (Feldman & Del Negro, 2006). ICAN is of particular interest because metabotropic glutamate receptors act via phospholipase C (PLC) to enhance ICAN and amplify glutamatergic inspiratory synaptic currents in preBötC neurons (Pace et al. 2007; Pace & Del Negro, 2008). P2Y1Rs, like metabotropic glutamate receptors, signal through PLC (von Kugelgen & Wetter, 2000; Sak & Illes, 2005).
PreBötC glia also contribute to the P2Y1R-mediated frequency increase (Huxtable et al. 2010). Glial toxins markedly attenuate the sensitivity of preBötC networks to ATP but not SP. The mechanisms via which glia contribute to the ATP-evoked frequency increase remain to be characterized. The working hypothesis is that P2Y1R-mediated increases in Ca2+ concentration in the astrocytes evoke glutamate and ATP release, which both act on respiratory neurons to increase frequency. Ca2+-dependent gliotransmitter release has been described in astrocytes from multiple brains regions, including the retrotrapezoid nucleus (RTN) (Gourine et al. 2010). Within the preBötC complex of rhythmic slices, ATP and MRS 2365 evoke whole-cell currents in electrophysiologically identified astrocytes and increases in intracellular Ca2+ in small, putative astrocytes. Astrocytes cultured specifically from the preBötC also respond to P2Y1R activation with robust Ca2+ increases and glutamate release, which in turn may contribute to the ATP-evoked frequency increase (Huxtable et al. 2010). However, it remains to be determined whether the ATP-evoked frequency increase is dependent on increases in astrocytic Ca2+.
Differential ATP sensitivity of mouse and rat preBötC to ATP reflects differential sensitivity to the ATP metabolite ADO
Given that the preBötC network is sensitive to P2Y1R-mediated excitation, the lack of an ATP effect in mice may reflect that ATP activates some other mechanism that obscures the P2Y1 excitation. It is highly unlikely that an inhibitory P2XR mechanism obscures the P2Y1R-mediated excitation because a P2XR antagonist cocktail delivered prior to ATP did not reveal any ATP excitation. We cannot exclude the possibility that our cocktail failed to block a critical P2XR subtype, but this is unlikely. The cocktail included TNP-ATP, which selectively antagonizes P2X1, P2X3 and P2X2/3 receptors in the nanomolar range (Lambrecht, 2000; Lorier et al. 2007), as well as P2X2, P2X4, P2X6, P2X1/5 and P2X7 receptors at concentrations used here (Lambrecht, 2000). It also included NF023, 5-BDBD and A740003 which selectively antagonize P2X1, P2X4 and P2X7 receptors, respectively (Soto et al. 1999; King, 2007; Donnelly-Roberts et al. 2008).
Instead, the failure to observe an ATP-mediated frequency increase in mice appears to result from the degradation of ATP to ADO and the activation of an A1R-mediated inhibition that obscures the P2Y1R excitation. This was apparent in that the block of A1Rs within the preBötC revealed a potent, P2Y1R-mediated ATP excitation. ADO sensitivity of mouse preBötC networks was confirmed by significant frequency reductions following local injection of ADO directly into the preBötC. We are not suggesting that all ATP is instantaneously converted to ADO upon injection into the preBötC. In fact, the unmasking in mouse of an ATP-evoked excitation following block of A1Rs indicates that significant ATP remains in the preBötC. Rather, our data indicate that when ATP is applied in mouse, sufficient ADO is produced rapidly enough to counteract the P2Y1R-mediated excitation.
The situation is very different in the neonatal rat in that blockade of A1Rs does not affect the ATP evoked excitation (Huxtable et al. 2009). This insensitivity of the rat ATP response to A1R antagonists suggests that production of ADO from ATP either does not occur fast enough to counteract the initial ATP excitation or that ADO does not inhibit preBötC networks in rat. Most likely it is both. RTPCR analysis of ectonucleotidase expression reveals that the enzyme complement in mouse favours rapid degradation of ATP to adenosine while that in rat favours generation of ADP, which is excitatory at P2Y1Rs (details discussed below). Moreover, even if ATP is degraded to ADO at the same rate in rat and mouse, ADO would not alter the P2Y1R-mediated excitation in rat because the preBötC of postnatal rat is not sensitive to ADO (Fig. 7).
Our definitive demonstration that mouse and rat preBötC networks are differentially sensitive to ADO is significant because it helps to resolve considerable confusion in the literature on the mechanisms and sites that mediate the inhibitory actions of ADO on breathing. To clarify, in intact animals when ADO is applied either systemically or via cerebroventricular administration where it can act throughout the CNS, data are consistent. First, ADO inhibits breathing in virtually all species examined (under anaesthesia) including sheep, lambs, piglets, rabbits, cats and rats (Lagercrantz et al. 1984; Eldridge et al. 1985; Burr & Sinclair, 1988; Koos & Matsuda, 1990; Bissonnette et al. 1991; Schmidt et al. 1995; Wilson et al. 2004). The observation in conscious humans that adenosine stimulates breathing (Fuller et al. 1987; Griffiths et al. 1990, 1997; Reid et al. 1991) underlies the suggestion that anaesthetic might enhance the inhibitory actions of adenosine. However, it appears more likely that the stimulatory action of adenosine in awake humans is dominated by its excitation of peripheral chemoreceptors (Fuller et al. 1987; Reid et al. 1991; Kowaluk et al. 1998). Second, the ADO inhibition is larger in fetal/newborns (Eldridge et al. 1984; Wilson et al. 2004). Third, ADO antagonists are associated with an increase in baseline frequency implying the respiratory networks are under tonic ADO-mediated inhibition (Schmidt et al. 1995). At least two discrete mechanisms are involved in the inhibition of ventilation by ADO. An A2AR-mediated excitation of GABAergic neurons that ultimately inhibits brainstem respiratory networks is a major contributor to the ADO-mediated inhibition evoked in vivo in sheep (Koos et al. 2005), lambs (Koos & Chau, 1998), piglets (Wilson et al. 2004) and rat (Mayer et al. 2006). Neither the source of the A2A excitatory input to GABAergic neurons nor the GABAergic input to the brainstem is known, but both appear suprabulbar in origin and are therefore unlikely to be contributors to the brainstem mechanisms examined here. This is based on the observation that, although A2ARs are expressed in regions of the ventral respiratory column containing GABAergic neurons (Wilson et al. 2004), an A2AR-mediated GABAergic inhibition has never been detected in reduced preparations that lack suprabulbar structures (Herlenius & Lagercrantz, 1999). In rhythmic medullary slices of mice, A2A agonists applied to inspiratory neurons do not affect rhythm. Similarly, A2A antagonists do not prevent the inhibitory actions of ADO (Mironov et al. 1999). In addition, the inhibitory actions of ADO in mouse medullary slices and island preparations are not affected by antagonizing GABA or glycine receptors (Vandam et al. 2008).
Most relevant to this study is the inconsistent description in the literature of a brainstem-delimited, A1R-mediated inhibition of inspiratory frequency. Comparison between studies is confounded by multiple factors including differences in (i) preparations (degree of reduction; brainstem spinal cord vs. rhythmic slice), (ii) species (mouse vs. rat), (iii) developmental stage, and (iv) method of drug application (specifically to the preBötC or bath application where it affects all regions of the preparation). Bath application of ADO agonists to inspiratory rhythm-generating brainstem spinal cord preparations from rat inhibits rhythm in some (Herlenius et al. 1997; Herlenius & Lagercrantz, 1999) but not all studies (Brockhaus & Ballanyi, 2000; Funk et al. 2008; Ruangkittisakul & Ballanyi, 2010). Developmental factors likely account for some discrepancies as the ADO inhibition of frequency described in the rat brainstem–spinal cord is prominent in fetal rats but disappears by P3 (Herlenius et al. 1997). Consistent with developmental changes are the observations in rhythmic slices from fetal but not postnatal rats that A1R antagonists enhance responses of preBötC networks to locally-applied ATP and that local application of A1 antagonists into the preBötC increases rhythm (Huxtable et al. 2009).
Species differences are suggested by the observations in mice that A1R activation inhibits frequency in P4–14 slices (Mironov et al. 1999; Vandam et al. 2008) and P7 preBötC island preparations (Vandam et al. 2008), but not in brainstem–spinal cord preparations from rats older than P3 (Herlenius et al. 1997). However, the degree to which developmental or preparation-dependent factors account for apparent species difference is unclear. The A1R inhibition in rat disappears by P3 while in mice it is present between P4 and P14. Similarly problematic is that ADO effects have been tested on the brainstem–spinal cord preparation in rat but the medullary slice in mouse. By performing parallel experiments in the two species at similar stages of development using the same preparation and the same method of drug application, we show conclusively that the preBötC networks of neonatal mice and rat are differentially sensitive to A1R-mediated inhibition. Whereas in rats the A1R antagonist DPCPX has no effect on the ATP response (Huxtable et al. 2009), in mice local application of ATP in the preBötC only increased inspiratory frequency when applied in the presence of DPCPX. It is possible that the tissue concentration of DPCPX produced in the initial experiments by local injection at 2 μm was high enough to affect A2A and A2BRs. However, subsequent use of 0.1 μm DPCPX (which would produce tissue levels of ∼0.01 μm; Liu et al. 1990) verified that block of A1Rs unmasks an ATP-mediated excitation. We cannot exclude the possibility that minor differences in the circuit elements contained within mouse and rat slices contribute to their differential responses to purinergic agents. However, we do not consider this to be a significant factor because drugs were locally injected directly into the preBötC rather than bath-applied. In bath-application protocols, drugs can act at any locus within the slice, in which case differential drug responses could reflect differences in slice architecture. With local application into the preBötC, regions outside the preBötC are not exposed to the drug. Thus, minor differences in slice architecture should have minimal influence on drug responses. Slices were generated in reference to detailed mouse (Ruangkittisakul et al. 2011) and rat (Smith et al. 1991; Ruangkittisakul et al. 2006; Lorier et al. 2007) atlases so that the location of the preBötC relative to the rostral surface of the slice was similar between species. This facilitated application of drugs directly into the preBötC. In addition, responses to SP, ATP or MRS 2365 were mapped in each experiment to ensure that drugs were locally injected into the preBötC.
Because drugs were applied specifically into the preBötC, unmasking of an ATP-evoked frequency increase by DPCPX and the ADO-evoked frequency decrease show that activation of A1Rs in the preBötC is sufficient to inhibit rhythm. The brainstem site(s) responsible for the A1R-mediated inhibition of inspiratory frequency have not previously been identified because ADO or its agonists were always bath-applied. A reduction in the frequency of rhythmic bursts generated by preBötC islands and an inhibition of preBötC inspiratory neurons by A1Rs (via presynaptic inhibition of PSCs and postsynaptic hyperpolarization following inhibition of intracellular cAMP production and KATP channel activation) (Mironov et al. 1999) both suggested that A1Rs in the preBötC contribute to the ADO-mediated frequency inhibition. However, these data did not establish that activation of preBötC A1Rs is sufficient to slow frequency.
Differential ectonucleotidase expression
The differential sensitivity of mouse and rat preBötC networks to ATP may also reflect unique patterns of ectonucleotidase expression. There are multiple ectonucleotidase isoforms, each with different substrate affinities and end-products (Dunwiddie et al. 1997; Zimmermann, 2000; Abbracchio et al. 2009). They also appear to be differentially distributed between and within discrete brain nuclei (Kukulski et al. 2004). Multiple isoforms with high activities are present in the medulla of adult rat (Langer et al. 2008). These data lack the spatial resolution required to define expression patterns within specific respiratory-related nuclei, but they clearly show that enzyme distribution is not uniform. Functionally, ectonucleotidases in the preBötC of rat are incredibly efficient at breaking down ATP and are significant determinants of preBötC ATP response kinetics. This is apparent in that ATP frequency responses closely follow ATP concentration profiles in rat and that ATP responses are significantly prolonged when hydrolysis resistant-ATP analogues are used (Lorier et al. 2007; Funk et al. 2008a; Huxtable et al. 2009) (Fig. 2). However, the significance of ectonucleotidase diversity and spatial heterogeneity for functioning networks, including preBötC inspiratory networks, remains unclear due to a lack of isoform-selective inhibitors and reliable information regarding the regional and cellular distribution of specific enzymes.
Our real-time PCR analysis of ectonucleotidase mRNA in preBötC tissue punches reveals the expression of multiple isoforms in the preBötC, and that the pattern varies among species. More importantly, the properties of the dominant isoform in the preBötC of mouse and rat match those predicted based on the respective ATP responses. For example, the ATP response in mice, which comprises a P2Y1R excitation that is masked by an A1 inhibitory mechanism, predicts an enzyme complement that supports the rapid degradation of ATP to ADO. Consistent with this, TNAP, which degrades ATP all the way to ADO, is the dominant isoform in the mouse preBötC. In contrast, the potent excitatory response of rat preBötC networks to ATP predicts an enzyme complement that predisposes toward excitation. ENTPDase2 is the dominant transcript in the rat preBötC. It has an ∼100-fold greater affinity for ATP than ADP and will cause ADP accumulation if the activity of enzymes that degrade ADP is low. This would most likely facilitate the excitatory effect of ATP because ADP is a more potent P2Y1R agonist than ATP (Burnstock, 2006; von Kugelgen, 2006). An important caveat is that we report mRNA levels and these are not always indicative of protein levels. However, our observation that the properties of the most abundant transcripts match with the kinetics of network ATP responses in both mouse and rat suggests that transcript levels do reflect protein expression.
Based on the differential ADO sensitivity and ectonucleotidase expression in the preBötC of mouse and rat, the functional significance of ectonucleotidase activity for ATP signalling will also differ. In mouse, ectonucleotidases will not only reduce the P2Y1-mediated excitation, they will also enhance the ADO-mediated inhibition. In contrast, greater ENTPDase 2 levels in rat will preferentially produce ADP and likely enhance or prolong the P2Y1R-mediated excitation. Generation of ADO is not relevant since preBötC networks in rat are not sensitive to ADO (Fig. 9). A full understanding of the role played by ectonucleotidases, however, will require use of preparations and stimuli that evoke endogenous release of ATP as well as analysis tools that provide increased spatial resolution to define at the cellular level the location of the various enzyme isoforms.
Figure 9. Schematic diagram of purinergic signalling in the preBötC illustrating that the balance between the excitatory effects of ATP at P2Y1Rs and the inhibitory effects of ADO at A1Rs is tipped in favour of excitation in rats.
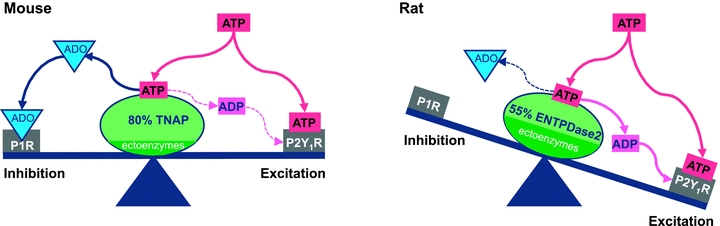
Our data suggest that in mice, ATP alone does not affect rhythm because its P2Y1R-mediated excitatory action is balanced by an A1R-mediated inhibition that occurs due to the rapid degradation of ATP to ADO by TNAP, the predominant ectonucleotidase in the preBötC of mouse. In contrast, ATP is excitatory in the rat preBötC, likely reflecting that the predominant ectonucleotodase in rat, ENTPDase 2, preferentially produces ADP, which is excitatory at P2Y1Rs. In addition, any ADO generated from the degradation of ATP is without consequence because the rat preBötC is not sensitive to the inhibitory actions of ADO.
Physiological significance
Hypoxia evokes ATP release within the ventral respiratory columns (VRCs), including the preBötC, where it attenuates the hypoxic respiratory depression (Gourine et al. 2005b). We therefore interpret our data in the context of the network response to hypoxia. From this perspective, our data define mechanisms through which ATP and its metabolites could act when they are released endogenously. The excitatory P2Y1R mechanism seen in mouse preBötC indicates that when ATP is released endogenously in response to hypoxia, or any other stimulus, it could excite preBötC networks (Gourine et al. 2005b). The lack of a frequency increase in response to exogenous ATP in mice does not exclude the possibility of a frequency increase in response to endogenous ATP because the time course of P2Y1R activation, ATP degradation and A1R activation may differ. However, in mouse the ectonucleotidase complement favours ADO production and ADO directly inhibits preBötC networks, suggesting that the duration and magnitude of any endogenous ATP-evoked excitation is likely to be much smaller in the mouse compared to rat.
The surprising finding that preBötC networks in neonatal rat are not sensitive to ADO has several implications. It indicates that the hypoxic depression of breathing in rat (Mortola, 1996; Mayer et al. 2006) does not involve A1R mechanisms in the preBötC. It also suggests that an A2A-mediated, GABAergic inhibition or an unknown, non-adenosinergic mechanism plays a more significant role in rat. These data are clinically relevant because ADO is implicated in the hypoxic depression of ventilation (Yan et al. 1995) and apnoea of prematurity (AOP) (Bhatt-Mehta & Schumacher, 2003). Caffeine administration is the therapy of choice for AOP. Its efficacy as a respiratory stimulant is attributed to antagonism of A1 and A2A ADORs. However, a significant portion of premature infants do not respond to caffeine. This, combined with ongoing debate about potential long-term negative side effects of perinatal caffeine treatment on CNS development, including networks underlying respiratory control and sleep (Schmidt et al. 2007; Montandon et al. 2008), emphasize the need for alternative treatments. Data also provide insight into basic mechanisms important in identifying drug targets such as strategies to enhance or extend P2Y1 signalling actions through inhibition of ectonucleotidase activity. The presence of this mechanism in mice and rats, combined with a P2Y1-like excitation of spinal locomotor central pattern generators in tadpole (Dale & Gilday, 1996; Brown & Dale, 2002) suggest it may be a common excitatory mechanism in rhythmic networks.
In summary, our analysis of preBötC networks in neonatal mouse and rat further confirms the sensitivity of this vital network to P2Y1R-mediated excitation. In addition, species variability in ATP responses emphasize that ATP signalling must be viewed as a three-part signalling system because differences in individual components dramatically alter overall network responses (Fig. 9). These data also suggest that there may be significant therapeutic potential in developing methods that alter the ATP–ADO balance to favour the excitatory actions of ATP over the inhibitory actions of ADO (by enhancing ATP release, ATP actions, minimizing ATP breakdown or inhibiting the actions of ADO). Species differences also emphasize that manipulation of ATP signalling in humans to treat CNS disorders of breathing requires that this three-part system be explored further in higher mammals, including primates and humans.
Acknowledgments
This work was supported by the Alberta Heritage Foundation for Medical Research (AHFMR), Canadian Institute for Health Research (CIHR), Canadian Foundation for Innovation (CFI), Alberta Science and Research Authority (ASRA), J.D.Z. is supported by studentships from the AMRF and WCHRI. V.R. is supported by a studentship from the Lung Association, AB & NWT. G.D.F. is an AHFMR Scientist. ENTPDase clones for rat were a generous gift from H. Zimmerman, Institute of Cell Biology and Neuroscience, Goethe-University. We are grateful to James Huber for his assistance with programming.
Glossary
Abbreviations
- ADO
adenosine
- ADP
adenosine diphosphate
- ENTPDase
ecto-nucleoside triphosphate diphosphohydrolases
- P2X
ionotropic purinoceptor
- P2Y
metabotropic purinoceptor
- preBötC
preBötzinger complex
- TNAP
tissue non-specific alkaline phosphatase
- VRC
ventral respiratory column
Author contributions
J.D.Z. performed all experiments and data analysis procedures except those listed below. She also contributed to experimental design, article drafting and revision, and final approval. V.R. performed and analysed experiments associated with Fig. 5, contributed relevant sections of text and participated in the final revision process. L.B.H. designed, performed and analysed the RTPCR experiments that described ectonucleotidase expression in the preBötC of mouse and rat, contributed relevant sections to the manuscript and provided final approval. G.D.F. oversaw all aspects of the study, from conception to final publication. All Experiments were performed in the laboratory of G. D. Funk, Department of Physiology, University of Alberta.
References
- Abbracchio MP, Boeynaems JM, Barnard EA, Boyer JL, Kennedy C, Miras-Portugal MT, King BF, Gachet C, Jacobson KA, Weisman GA, Burnstock G. Characterization of the UDP-glucose receptor (re-named here the P2Y14 receptor) adds diversity to the P2Y receptor family. Trends Pharmacol Sci. 2003;24:52–55. doi: 10.1016/S0165-6147(02)00038-X. [DOI] [PMC free article] [PubMed] [Google Scholar]
- Abbracchio MP, Burnstock G, Verkhratsky A, Zimmermann H. Purinergic signalling in the nervous system: an overview. Trends Neurosci. 2009;32:19–29. doi: 10.1016/j.tins.2008.10.001. [DOI] [PubMed] [Google Scholar]
- Ballanyi K. Neuromodulation of the perinatal respiratory network. Curr Neuropharmacol. 2004;2:221–243. doi: 10.2174/1570159043476828. [DOI] [PubMed] [Google Scholar]
- Bhatt-Mehta V, Schumacher RE. Treatment of apnea of prematurity. Paediatr Drugs. 2003;5:195–210. doi: 10.2165/00128072-200305030-00006. [DOI] [PubMed] [Google Scholar]
- Bissonnette JM, Hohimer AR, Chao CR, Knopp SJ, Notoroberto NF. Theophylline stimulates fetal breathing movements during hypoxia. Pediatr Res. 1990;28:83–86. doi: 10.1203/00006450-199008000-00002. [DOI] [PubMed] [Google Scholar]
- Bissonnette JM, Hohimer AR, Knopp SJ. The effect of centrally administered adenosine on fetal breathing movements. Respir Physiol. 1991;84:273–285. doi: 10.1016/0034-5687(91)90123-z. [DOI] [PubMed] [Google Scholar]
- Brockhaus J, Ballanyi K. Anticonvulsant A1 receptor-mediated adenosine action on neuronal networks in the brainstem-spinal cord of newborn rats. Neuroscience. 2000;96:359–371. doi: 10.1016/s0306-4522(99)00544-8. [DOI] [PubMed] [Google Scholar]
- Brown P, Dale N. Modulation of K+ currents in Xenopus spinal neurons by p2y receptors: a role for ATP and ADP in motor pattern generation. J Physiol. 2002;540:843–850. doi: 10.1113/jphysiol.2001.013192. [DOI] [PMC free article] [PubMed] [Google Scholar]
- Burnstock G. Historical review: ATP as a neurotransmitter. Trends Pharmacol Sci. 2006;27:166–176. doi: 10.1016/j.tips.2006.01.005. [DOI] [PubMed] [Google Scholar]
- Burr D, Sinclair JD. The effect of adenosine on respiratory chemosensitivity in the awake rat. Respir Physiol. 1988;72:47–57. doi: 10.1016/0034-5687(88)90078-3. [DOI] [PubMed] [Google Scholar]
- Dale N, Gilday D. Regulation of rhythmic movements by purinergic neurotransmitters in frog embryos. Nature. 1996;383:259–263. doi: 10.1038/383259a0. [DOI] [PubMed] [Google Scholar]
- Donnelly-Roberts D, McGaraughty S, Shieh CC, Honore P, Jarvis MF. Painful purinergic receptors. J Pharmacol Exp Ther. 2008;324:409–415. doi: 10.1124/jpet.106.105890. [DOI] [PubMed] [Google Scholar]
- Drummond GB. Reporting ethical matters in The Journal of Physiology: standards and advice. J Physiol. 2009;587:713–719. doi: 10.1113/jphysiol.2008.167387. [DOI] [PMC free article] [PubMed] [Google Scholar]
- Dunwiddie TV, Diao L, Proctor WR. Adenine nucleotides undergo rapid, quantitative conversion to adenosine in the extracellular space in rat hippocampus. J Neurosci. 1997;17:7673–7682. doi: 10.1523/JNEUROSCI.17-20-07673.1997. [DOI] [PMC free article] [PubMed] [Google Scholar]
- Eldridge FL, Millhorn DE, Kiley JP. Respiratory effects of a long-acting analog of adenosine. Brain Res. 1984;301:273–280. doi: 10.1016/0006-8993(84)91096-5. [DOI] [PubMed] [Google Scholar]
- Eldridge FL, Millhorn DE, Kiley JP. Antagonism by theophylline of respiratory inhibition induced by adenosine. J Appl Physiol. 1985;59:1428–1433. doi: 10.1152/jappl.1985.59.5.1428. [DOI] [PubMed] [Google Scholar]
- Feldman JL, Del Negro CA. Looking for inspiration: new perspectives on respiratory rhythm. Nat Rev Neurosci. 2006;7:232–242. doi: 10.1038/nrn1871. [DOI] [PMC free article] [PubMed] [Google Scholar]
- Fuller RW, Maxwell DL, Conradson TB, Dixon CM, Barnes PJ. Circulatory and respiratory effects of infused adenosine in conscious man. Br J Clin Pharmacol. 1987;24:309–317. doi: 10.1111/j.1365-2125.1987.tb03174.x. [DOI] [PMC free article] [PubMed] [Google Scholar]
- Funk GD, Huxtable AG, Lorier AR. ATP in central respiratory control: A three-part signaling system. Respir Physiol Neurobiol. 2008;164:131–142. doi: 10.1016/j.resp.2008.06.004. [DOI] [PubMed] [Google Scholar]
- Gourine AV. On the peripheral and central chemoreception and control of breathing: an emerging role of ATP. J Physiol. 2005;568:715–724. doi: 10.1113/jphysiol.2005.095968. [DOI] [PMC free article] [PubMed] [Google Scholar]
- Gourine AV, Atkinson L, Deuchars J, Spyer KM. Purinergic signalling in the medullary mechanisms of respiratory control in the rat: respiratory neurones express the P2X2 receptor subunit. J Physiol. 2003;552:197–211. doi: 10.1113/jphysiol.2003.045294. [DOI] [PMC free article] [PubMed] [Google Scholar]
- Gourine AV, Llaudet E, Dale N, Spyer KM. ATP is a mediator of chemosensory transduction in the central nervous system. Nature. 2005a;436:108–111. doi: 10.1038/nature03690. [DOI] [PubMed] [Google Scholar]
- Gourine AV, Llaudet E, Dale N, Spyer KM. Release of ATP in the ventral medulla during hypoxia in rats: role in hypoxic ventilatory response. J Neurosci. 2005b;25:1211–1218. doi: 10.1523/JNEUROSCI.3763-04.2005. [DOI] [PMC free article] [PubMed] [Google Scholar]
- Gourine AV, Kasymov V, Marina N, Tang F, Melina F, Figueiredo MF, Lane S, Teschemacher AG, Spyer KM, Deisseroth K, Kasparov S. Astrocytes control breathing through pH-dependent release of ATP. Science. 2010;329:571–575. doi: 10.1126/science.1190721. [DOI] [PMC free article] [PubMed] [Google Scholar]
- Gray PA, Janczewski WA, Mellen N, McCrimmon DR, Feldman JL. Normal breathing requires preBotzinger complex neurokinin-1 receptor-expressing neurons. Nat Neurosci. 2001;4:927–930. doi: 10.1038/nn0901-927. [DOI] [PMC free article] [PubMed] [Google Scholar]
- Gray PA, Rekling JC, Bocchiaro CM, Feldman JL. Modulation of respiratory frequency by peptidergic input to rhythmogenic neurons in the preBotzinger complex. Science. 1999;286:1566–1568. doi: 10.1126/science.286.5444.1566. [DOI] [PMC free article] [PubMed] [Google Scholar]
- Griffiths TL, Christie JM, Parsons ST, Holgate ST. The effect of dipyridamole and theophylline on hypercapnic ventilatory responses: the role of adenosine. Eur Respir J. 1997;10:156–160. doi: 10.1183/09031936.97.10010156. [DOI] [PubMed] [Google Scholar]
- Griffiths TL, Warren SJ, Chant AD, Holgate ST. Ventilatory effects of hypoxia and adenosine infusion in patients after bilateral carotid endarterectomy. Clin Sci (Lond) 1990;78:25–31. doi: 10.1042/cs0780025. [DOI] [PubMed] [Google Scholar]
- Guyenet PG, Wang H. Pre-Botzinger neurons with preinspiratory discharges ‘in vivo’ express NK1 receptors in the rat. J Neurophysiol. 2001;86:438–446. doi: 10.1152/jn.2001.86.1.438. [DOI] [PubMed] [Google Scholar]
- Herlenius E, Lagercrantz H. Adenosinergic modulation of respiratory neurones in the neonatal rat brainstem in vitro. J Physiol. 1999;518:159–172. doi: 10.1111/j.1469-7793.1999.0159r.x. [DOI] [PMC free article] [PubMed] [Google Scholar]
- Herlenius E, Lagercrantz H, Yamamoto Y. Adenosine modulates inspiratory neurons and the respiratory pattern in the brainstem of neonatal rats. Pediatr Res. 1997;42:46–53. doi: 10.1203/00006450-199707000-00008. [DOI] [PubMed] [Google Scholar]
- Huxtable AG, Zwicker JD, Alvares TS, Ruangkittisakul A, Fang X, Hahn LB, Posse de Chaves E, Baker GB, Ballanyi K, Funk GD. Glia contribute to the purinergic modulation of inspiratory rhythm-generating networks. J Neurosci. 2010;30:3947–3958. doi: 10.1523/JNEUROSCI.6027-09.2010. [DOI] [PMC free article] [PubMed] [Google Scholar]
- Huxtable AG, Zwicker JD, Poon BY, Pagliardini S, Vrouwe SQ, Greer JJ, Funk GD. Tripartite purinergic modulation of central respiratory networks during perinatal development: the influence of ATP, ectonucleotidases, and ATP metabolites. J Neurosci. 2009;29:14713–14725. doi: 10.1523/JNEUROSCI.2660-09.2009. [DOI] [PMC free article] [PubMed] [Google Scholar]
- Johnson SM, Smith JC, Feldman JL. Modulation of respiratory rhythm in vitro: role of Gi/o protein-mediated mechanisms. J Appl Physiol. 1996;80:2120–2133. doi: 10.1152/jappl.1996.80.6.2120. [DOI] [PubMed] [Google Scholar]
- King BF. Novel P2X7 receptor antagonists ease the pain. Br J Pharmacol. 2007;151:565–567. doi: 10.1038/sj.bjp.0707266. [DOI] [PMC free article] [PubMed] [Google Scholar]
- Klotz KN. Adenosine receptors and their ligands. Naunyn Schmiedebergs Arch Pharmacol. 2000;362:382–391. doi: 10.1007/s002100000315. [DOI] [PubMed] [Google Scholar]
- Koos BJ, Chau A. Fetal cardiovascular and breathing responses to an adenosine A2a receptor agonist in sheep. Am J Physiol Regul Integr Comp Physiol. 1998;274:R152–159. doi: 10.1152/ajpregu.1998.274.1.R152. [DOI] [PubMed] [Google Scholar]
- Koos BJ, Kawasaki Y, Kim YH, Bohorquez F. Adenosine A2A-receptor blockade abolishes the roll-off respiratory response to hypoxia in awake lambs. Am J Physiol Regul Integr Comp Physiol. 2005;288:R1185–1194. doi: 10.1152/ajpregu.00723.2004. [DOI] [PubMed] [Google Scholar]
- Koos BJ, Matsuda K. Fetal breathing, sleep state, and cardiovascular responses to adenosine in sheep. J Appl Physiol. 1990;68:489–495. doi: 10.1152/jappl.1990.68.2.489. [DOI] [PubMed] [Google Scholar]
- Kowaluk EA, Bhagwat SS, Jarvis MF. Adenosine kinase inhibitors. Curr Pharm Des. 1998;4:403–416. [PubMed] [Google Scholar]
- Kukulski F, Sevigny J, Komoszynski M. Comparative hydrolysis of extracellular adenine nucleotides and adenosine in synaptic membranes from porcine brain cortex, hippocampus, cerebellum and medulla oblongata. Brain Res. 2004;1030:49–56. doi: 10.1016/j.brainres.2004.09.044. [DOI] [PubMed] [Google Scholar]
- Lagercrantz H, Yamamoto Y, Fredholm BB, Prabhakar NR, von Euler C. Adenosine analogues depress ventilation in rabbit neonatesTheophylline stimulation of respiration via adenosine receptors? Pediatr Res. 1984;18:387–390. doi: 10.1203/00006450-198404000-00018. [DOI] [PubMed] [Google Scholar]
- Lambrecht G. Agonists and antagonists acting at P2X receptors: selectivity profiles and functional implications. Naunyn Schmiedebergs Arch Pharmacol. 2000;362:340–350. doi: 10.1007/s002100000312. [DOI] [PubMed] [Google Scholar]
- Langer D, Hammer K, Koszalka P, Schrader J, Robson S, Zimmermann H. Distribution of ectonucleotidases in the rodent brain revisited. Cell Tissue Res. 2008;334:199–217. doi: 10.1007/s00441-008-0681-x. [DOI] [PubMed] [Google Scholar]
- Lieske SP, Thoby-Brisson M, Telgkamp P, Ramirez JM. Reconfiguration of the neural network controlling multiple breathing patterns: eupnea, sighs and gasps. Nat Neurosci. 2000;3:600–607. doi: 10.1038/75776. [DOI] [PubMed] [Google Scholar]
- Liu G, Feldman JL, Smith JC. Excitatory amino acid-mediated transmission of inspiratory drive to phrenic motoneurons. J Neurophysiol. 1990;64:423–436. doi: 10.1152/jn.1990.64.2.423. [DOI] [PubMed] [Google Scholar]
- Lorier AR, Huxtable AG, Robinson DM, Lipski J, Housley GD, Funk GD. P2Y1 receptor modulation of the pre-Botzinger complex inspiratory rhythm generating network in vitro. J Neurosci. 2007;27:993–1005. doi: 10.1523/JNEUROSCI.3948-06.2007. [DOI] [PMC free article] [PubMed] [Google Scholar]
- Lorier AR, Lipski J, Housley GD, Greer JJ, Funk GD. ATP sensitivity of preBotzinger complex neurones in neonatal rat in vitro: mechanism underlying a P2 receptor-mediated increase in inspiratory frequency. J Physiol. 2008;586:1429–1446. doi: 10.1113/jphysiol.2007.143024. [DOI] [PMC free article] [PubMed] [Google Scholar]
- Lorier AR, Peebles K, Brosenitsch T, Robinson DM, Housley GD, Funk GD. P2 receptors modulate respiratory rhythm but do not contribute to central CO2 sensitivity in vitro. Respir Physiol Neurobiol. 2004;142:27–42. doi: 10.1016/j.resp.2004.04.007. [DOI] [PubMed] [Google Scholar]
- Mayer CA, Haxhiu MA, Martin RJ, Wilson CG. Adenosine A2A receptors mediate GABAergic inhibition of respiration in immature rats. J Appl Physiol. 2006;100:91–97. doi: 10.1152/japplphysiol.00459.2005. [DOI] [PubMed] [Google Scholar]
- Mironov SL, Langohr K, Richter DW. A1 adenosine receptors modulate respiratory activity of the neonatal mouse via the cAMP-mediated signaling pathway. J Neurophysiol. 1999;81:247–255. doi: 10.1152/jn.1999.81.1.247. [DOI] [PubMed] [Google Scholar]
- Montandon G, Kinkead R, Bairam A. Adenosinergic modulation of respiratory activity: Developmental plasticity induced by perinatal caffeine administration. Respir Physiol Neurobiol. 2008;164:87–95. doi: 10.1016/j.resp.2008.07.013. [DOI] [PubMed] [Google Scholar]
- Mortola JP. Ventilatory responses to hypoxia in mammals. In: Haddad GG, Lister G, editors. Tissue Oxygen Deprivation: From Molecular to Integrated Function. Vol. 95. New York: Dekker; 1996. pp. 433–477. [Google Scholar]
- Moss IR. Respiratory responses to single and episodic hypoxia during development: mechanisms of adaptation. Respir Physiol. 2000;121:185–197. doi: 10.1016/s0034-5687(00)00127-4. [DOI] [PubMed] [Google Scholar]
- North RA. Molecular physiology of P2X receptors. Physiol Rev. 2002;82:1013–1067. doi: 10.1152/physrev.00015.2002. [DOI] [PubMed] [Google Scholar]
- Pace RW, Del Negro CA. AMPA and metabotropic glutamate receptors cooperatively generate inspiratory-like depolarization in mouse respiratory neurons in vitro. Eur J Neurosci. 2008;28:2434–2442. doi: 10.1111/j.1460-9568.2008.06540.x. [DOI] [PubMed] [Google Scholar]
- Pace RW, Mackay DD, Feldman JL, Del Negro CA. Inspiratory bursts in the preBotzinger complex depend on a calcium-activated non-specific cation current linked to glutamate receptors in neonatal mice. J Physiol. 2007;582:113–125. doi: 10.1113/jphysiol.2007.133660. [DOI] [PMC free article] [PubMed] [Google Scholar]
- Pagliardini S, Adachi T, Ren J, Funk GD, Greer JJ. Fluorescent tagging of rhythmically active respiratory neurons within the pre-Botzinger complex of rat medullary slice preparations. J Neurosci. 2005;25:2591–2596. doi: 10.1523/JNEUROSCI.4930-04.2005. [DOI] [PMC free article] [PubMed] [Google Scholar]
- Pagliardini S, Ren J, Greer JJ. Ontogeny of the pre-Botzinger complex in perinatal rats. J Neurosci. 2003;23:9575–9584. doi: 10.1523/JNEUROSCI.23-29-09575.2003. [DOI] [PMC free article] [PubMed] [Google Scholar]
- Ramirez JM, Telgkamp P, Elsen FP, Quellmalz UJ, Richter DW. Respiratory rhythm generation in mammals: synaptic and membrane properties. Respir Physiol. 1997;110:71–85. doi: 10.1016/s0034-5687(97)00074-1. [DOI] [PubMed] [Google Scholar]
- Reid PG, Watt AH, Penny WJ, Newby AC, Smith AP, Routledge PA. Plasma adenosine concentrations during adenosine-induced respiratory stimulation in man. Eur J Clin Pharmacol. 1991;40:175–180. doi: 10.1007/BF00280073. [DOI] [PubMed] [Google Scholar]
- Ruangkittisakul A, Ballanyi K. Methylxanthine reversal of opioid-evoked inspiratory depression via phosphodiesterase-4 blockade. Respir Physiol Neurobiol. 2010;172:94–105. doi: 10.1016/j.resp.2010.04.025. [DOI] [PubMed] [Google Scholar]
- Ruangkittisakul A, Panaitescu B, Ballanyi K. K+ and Ca2+ dependence of inspiratory-related rhythm in novel ‘calibrated’ mouse brainstem slices. Respir Physiol Neurobiol. 2011;175:37–48. doi: 10.1016/j.resp.2010.09.004. [DOI] [PubMed] [Google Scholar]
- Ruangkittisakul A, Schwarzacher SW, Secchia L, Poon BY, Ma Y, Funk GD, Ballanyi K. High sensitivity to neuromodulator-activated signaling pathways at physiological [K+] of confocally imaged respiratory center neurons in on-line-calibrated newborn rat brainstem slices. J Neurosci. 2006;26:11870–11880. doi: 10.1523/JNEUROSCI.3357-06.2006. [DOI] [PMC free article] [PubMed] [Google Scholar]
- Runold M, Lagercrantz H, Prabhakar NR, Fredholm BB. Role of adenosine in hypoxic ventilatory depression. J Appl Physiol. 1989;67:541–546. doi: 10.1152/jappl.1989.67.2.541. [DOI] [PubMed] [Google Scholar]
- Sak K, Illes P. Neuronal and glial cell lines as model systems for studying P2Y receptor pharmacology. Neurochem Int. 2005;47:401–412. doi: 10.1016/j.neuint.2005.05.012. [DOI] [PubMed] [Google Scholar]
- Schmidt B, Roberts RS, Davis P, Doyle LW, Barrington KJ, Ohlsson A, Solimano A, Tin W. Long-term effects of caffeine therapy for apnea of prematurity. N Engl J Med. 2007;357:1893–1902. doi: 10.1056/NEJMoa073679. [DOI] [PubMed] [Google Scholar]
- Schmidt C, Bellingham MC, Richter DW. Adenosinergic modulation of respiratory neurones and hypoxic responses in the anaesthetized cat. J Physiol. 1995;483:769–781. doi: 10.1113/jphysiol.1995.sp020621. [DOI] [PMC free article] [PubMed] [Google Scholar]
- Smith JC, Ellenberger HH, Ballanyi K, Richter DW, Feldman JL. Pre-Botzinger complex: a brainstem region that may generate respiratory rhythm in mammals. Science. 1991;254:726–729. doi: 10.1126/science.1683005. [DOI] [PMC free article] [PubMed] [Google Scholar]
- Soto F, Lambrecht G, Nickel P, Stuhmer W, Busch AE. Antagonistic properties of the suramin analogue NF023 at heterologously expressed P2X receptors. Neuropharmacology. 1999;38:141–149. doi: 10.1016/s0028-3908(98)00158-0. [DOI] [PubMed] [Google Scholar]
- Thomas T, Ralevic V, Bardini M, Burnstock G, Spyer KM. Evidence for the involvement of purinergic signalling in the control of respiration. Neuroscience. 2001;107:481–490. doi: 10.1016/s0306-4522(01)00363-3. [DOI] [PubMed] [Google Scholar]
- Vandam RJ, Shields EJ, Kelty JD. Rhythm generation by the pre-Botzinger complex in medullary slice and island preparations: effects of adenosine A1 receptor activation. BMC Neurosci. 2008;9:95. doi: 10.1186/1471-2202-9-95. [DOI] [PMC free article] [PubMed] [Google Scholar]
- von Kugelgen I. Pharmacological profiles of cloned mammalian P2Y-receptor subtypes. Pharmacol Ther. 2006;110:415–432. doi: 10.1016/j.pharmthera.2005.08.014. [DOI] [PubMed] [Google Scholar]
- von Kugelgen I, Wetter A. Molecular pharmacology of P2Y-receptors. Naunyn Schmiedebergs Arch Pharmacol. 2000;362:310–323. doi: 10.1007/s002100000310. [DOI] [PubMed] [Google Scholar]
- Wang G, Zhou P, Repucci MA, Golanov EV, Reis DJ. Specific actions of cyanide on membrane potential and voltage-gated ion currents in rostral ventrolateral medulla neurons in rat brainstem slices. Neurosci Lett. 2001;309:125–129. doi: 10.1016/s0304-3940(01)02032-8. [DOI] [PubMed] [Google Scholar]
- Wilson CG, Martin RJ, Jaber M, Abu-Shaweesh J, Jafri A, Haxhiu MA, Zaidi S. Adenosine A2A receptors interact with GABAergic pathways to modulate respiration in neonatal piglets. Respir Physiol Neurobiol. 2004;141:201–211. doi: 10.1016/j.resp.2004.04.012. [DOI] [PubMed] [Google Scholar]
- Yamamoto M, Nishimura M, Kobayashi S, Akiyama Y, Miyamoto K, Kawakami Y. Role of endogenous adenosine in hypoxic ventilatory response in humans: a study with dipyridamole. J Appl Physiol. 1994;76:196–203. doi: 10.1152/jappl.1994.76.1.196. [DOI] [PubMed] [Google Scholar]
- Yan S, Laferriere A, Zhang C, Moss IR. Microdialyzed adenosine in nucleus tractus solitarii and ventilatory response to hypoxia in piglets. J Appl Physiol. 1995;79:405–410. doi: 10.1152/jappl.1995.79.2.405. [DOI] [PubMed] [Google Scholar]
- Zimmermann H. Extracellular metabolism of ATP and other nucleotides. Naunyn Schmiedebergs Arch Pharmacol. 2000;362:299–309. doi: 10.1007/s002100000309. [DOI] [PubMed] [Google Scholar]