Abstract
The reversible phosphorolysis of uridine to generate uracil and ribose 1-phosphate is catalyzed by uridine phosphorylase and is involved in the pyrimidine salvage pathway. We define the reaction mechanism of uridine phosphorylase from Trypanosoma cruzi by steady-state and pre-steady-state kinetics, pH-rate profiles, kinetic isotope effects from uridine and solvent deuterium isotope effects. Initial rate and product inhibition patterns suggest a steady-state random kinetic mechanism. Pre-steady state kinetics indicated no rate-limiting step after formation of the enzyme-products ternary complex, as no burst in product formation is observed. The limiting single-turnover rate constant equals the steady-state turnover number, thus chemistry is partially or fully rate limiting. Kinetic isotope effects with [1′-3H]-, [1′-14C]-, and [5′-14C,1,3-15N2]uridine gave experimental values of α-T(V/K)uridine = 1.063, 14(V/K)uridine = 1.069, and 15,β-15(V/K)uridine = 1.018, in agreement with an ANDN (SN2) mechanism where chemistry contributes significantly to the overall rate-limiting step of the reaction. Density functional theory modeling of the reaction in gas phase supports an ANDN mechanism. Solvent deuterium kinetic isotope effects were unity, indicating that no kinetically significant proton transfer step is involved at the transition state. In this N-ribosyl transferase, proton transfer to neutralize the leaving group is not part of transition state formation, consistent with an enzyme-stabilized anionic uracil as the leaving group. Kinetic analysis as a function of pH indicates one protonated group essential for catalysis and for substrate binding.
Uridine phosphorylase (UP)1 (EC 2.4.2.3) catalyzes the reversible phosphorolysis of N-ribosidic bonds of uridine and 2′-deoxyuridine, generating uracil and ribose 1-phosphate (R1P) or 2-deoxyribose 1-phosphate (Scheme 1) (1), an essential step in the salvage of pyrimidines (2). The reaction products can be redirected to nucleoside synthesis or degradation, depending on the metabolic demands of the organism (3). Reaction equilibrium favors nucleoside formation, with an equilibrium constant (Keq) of 0.6 calculated from Haldane relationships (4). The inability of UP to cleave thymidine and the presence of a characteristic α/β-subunit fold place UP in the nucleoside phosphorylase-I (NP-I) family (5).
Scheme 1.
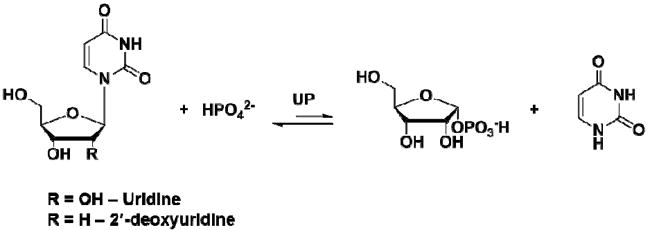
Uridine phosphorolysis catalyzed by UP.
Distinct kinetic mechanisms have been proposed for the reaction catalyzed by UP depending on the organism. A rapid equilibrium random mechanism has been proposed for the Escherichia coli enzyme (4) while human type 1 UP is thought to act by a steady-state ordered mechanism (6). The chemical mechanism for UP reactions is formally an SN2 mechanism, since the reaction catalyzes the inversion of stereochemistry at the ribosyl anomeric carbon. This mechanism has been suggested for E. coli UP (7). However, it is now well known that enzymatic reactions with inversion of stereochemistry can be characterized by fully dissociated SN1 transition states, and these types of transition state are established in N-ribosyltransferases including bovine (8), human, and malarial (9) purine nucleoside phosphorylases (PNPs), and human methylthioadenosine phosphorylase (10), which are also members of the NP-I family (5).
The homodimeric uridine phosphorylase (TcUP) from the kinetoplastid Trypanosoma cruzi has recently been shown to catalyze the arsenolysis of uridine, and the transition state structure for the arsenolysis reaction was shown to form a bimolecular transition state with significant bond order to both the leaving uracil group and to the attacking arsenate (11). Arsenate is a convenient chemical tool to render phosphorolysis reactions irreversible and thereby permit the analysis of intrinsic kinetic isotope effects for transition state analysis (8). However, the physiological reaction involves phosphorolysis of uridine, which is characterized in the present work by steady-state and pre-steady-state kinetics, heavy-atom, tritium, and solvent deuterium kinetic isotope effects, pH-rate profiles, and density functional theory calculations.
EXPERIMENTAL PROCEDURES
Materials
D-[1-3H]Ribose and D-[1-14C]ribose were purchased from American Radiolabeled Chemicals, Inc. D-[6-14C]glucose was purchased from PerkinElmer, Inc. [1,3-15N2]Orotate and deuterium oxide (99.9 atom % deuterium) were obtained from Cambridge Isotope Laboratories, Inc. Pyruvate kinase myokinase, hexokinase, glucose-6-phosphate dehydrogenase, glutamic acid dehydrogenase, 6-phosphogluconic acid dehydrogenase, and phosphoriboisomerase were from Sigma-Aldrich®. Alkaline phosphatase was from Roche. Ribokinase and phosphoribosyl-α-1-pyrophosphate synthetase were prepared as previously described (12, 13). UMP synthase was a kind gift from Dr. Keith Hazleton of this laboratory. All other chemicals and reagents were obtained from commercial sources and were used without further purification.
Expression, purification, and enzymatic assay of TcUP
N-terminal-His6-containing TcUP was expressed in E. coli, purified to homogeneity, and assayed for activity in 100 mM HEPES pH 7.5 in the presence of uridine and phosphate, at 25 °C, as previously reported (11). TcUP concentration was 20 nM, and the reaction volume was 120 μL. One unit of TcUP is the amount of enzyme necessary to convert 1 μmol of uridine to uracil per min.
Synthesis and purification of isotopically labeled uridines
[1′-3H]uridine, [1′-14C]uridine, [5′-14C]uridine, and [5′-14C,1,3-15N2]uridine were synthesized and purified as previously described (11).
Initial velocity and product inhibition studies
Initial rates of TcUP activity were measured in the presence of varied concentrations of uridine (25 – 400 μM) and inorganic phosphate (Pi) (250 – 2000 μM). Product inhibition patterns were determined in the presence of varied concentrations of one substrate, fixed, sub-saturating concentration of the co-substrate, and varied levels of either uracil or R1P. All reactions were carried out in 100 mM HEPES pH 7.5, at 25 °C.
pH-rate profiles
Initial velocities were determined in the presence of varied concentrations of one substrate and a saturating level of the second substrate, in 100 mM MES, 100 mM HEPES, 100 mM CHES buffer mixture, at different pH values ranging from 6.0 to 10.3, at 25 °C. Prior to the experiment, TcUP had been incubated at the pH values cited above and assayed under standard conditions, to ensure enzyme stability at experimental pH values.
Measurement of solvent deuterium kinetic isotope effects
Initial rates were measured in the presence of varied concentrations of one substrate and near-saturating concentration of the second substrate, in H2O or in 98 atom % D2O, at 25 °C. Experiments were conducted in 100 mM HEPES pH(D) 7.5, a plateau region of the pH profiles where the steady-state parameters are pH independent.
Rapid kinetics under single- and multiple-turnover conditions
Rapid kinetic measurements were performed by monitoring the decrease in absorbance at 282 nm upon conversion of uridine to uracil in 100 mM HEPES pH 7.5, at 25 °C, in an SX-20 stopped-flow spectrophotometer (dead time ≤ 1.2 milliseconds) outfitted with a mercury-xenon lamp (Applied Photophysics). Single-turnover rates were measured with 5 μM uridine, 50 mM KH2PO4 pH 7.5, and varied TcUP concentrations (10 – 50 μM). Multiple-turnover measurements were carried out with 500 μM uridine, 50 mM KH2PO4 pH 7.5, and either 5 μM or 10 μM TcUP. The approach to steady-state kinetics was measured with varied concentrations of one substrate, a fixed, near-saturating concentration of the second substrate, and 0.5 μM TcUP.
Measurement of heavy atom and tritium kinetic isotope effects
All heavy atom and tritium kinetic isotope effects were determined by the competitive radiolabel method (13) at 25 °C. A typical reaction mixture (1 mL) contained 50 mM KH2PO4 pH 7.5, 100 mM HEPES pH 7.5, 100 μM uridine (3H- and 14C-labeled and cold carrier), and 1 nM TcUP. Phosphorolysis reactions were allowed to proceed to 10 – 15% completion, at which point half of the reaction mixture was loaded onto charcoal columns (W. R. Grace & Co.). The remainder of the reaction was completely converted to products by addition of 4 μM TcUP and 5 mM NaH2AsO4 pH 7.5, and loaded onto charcoal columns. Column pre-equilibration and elution steps, as well as sample preparation for scintillation counting followed the same procedures previously described (11). Samples were counted in dual-channel fashion, with the 3H decay signal appearing only in channel 1, and 14C signal in both channels. The initial ratio of 3H to 14C counts per minute (cpm) was 2:1, and enough radiolabeled substrate was used so that at least 10,000 cpm of 14C were obtained in channel 2. A sample containing only [14C]uridine was counted as a standard. Kinetic isotope effects are described according to the notation of Northrop (14) as extended by Cook and Cleland (15).
Computational methods
The nucleophilic reaction involving uridine and phosphate dianion (HPO42-) was modeled in vacuo by DFT in B3LYP, using a 6-31G** basis set, as implemented in Gaussian 09 (16). Most transition structures located by this method possessed only one imaginary frequency, and the ones with a second imaginary frequency were only considered when the additional frequency was less than 10% of the first, to minimize errors associated with this type of analysis (17). Stationary-point transition structures, without geometric constraints, were located with both phosphate and arsenate as nucleophiles.
Data analysis
Kinetic data were analyzed by the nonlinear regression function of SigmaPlot 11.0 (SPSS, Inc.), and are expressed as averages and their standard errors for 10 replicate measurements, and, in the case of kinetic isotope effects, for at least 2 independent experiments. Initial rate data at a single concentration of the fixed substrate were fitted to eq 1. Data for intersecting initial velocity patterns were fitted to eq 2, describing a sequential mechanism, and noncompetitive inhibition data, to eq 3. Solvent deuterium kinetic isotope effect data were fitted to eq 4. In eqs 1 - 4, v is the initial rate, ET is the total enzyme amount, kcat is the turnover number, A and B are substrate concentrations, Kia is the dissociation constant for A, Ka and Kb are Michaelis constants for A and B, respectively, Kis and Kii are, respectively, slope and intercept inhibition constants, Fi is the fraction of deuterium label, and EV and EV/Ka are the isotope effects minus 1 on V and V/Ka, respectively.
| eq 1 |
| eq 2 |
| eq 3 |
| eq 4 |
Single-turnover and approach to steady-state data were converted to product formation and fitted, respectively, to eqs 5 and 6, where P is uracil concentration at time t, ΔP is the amplitude change in P, vi is the steady-state initial velocity, and k and λ are observed rate constants for single turnover and approach to steady-state, respectively (18).
| eq 5 |
| eq 6 |
Data for pH-rate profiles were fitted to eq 7, where y is the kinetic parameter, C is the pH-independent value of y, H is the proton concentration, and Ka is the apparent acid dissociation constant for ionizing groups.
| eq 7 |
The total 3H signal was assessed by eq 8, and the total 14C signal, by eq 9 (13). Heavy atom and tritium kinetic isotope effects on V/K were calculated with eq 10 . In eqs 8 - 10, 3H is the total number of cpm for this isotope, 14C is the total number of cpm for this isotope, channel 1 and channel 2 are the number of cpm in each channel, r is the channel 1 to channel 2 ratio of 14C standard, Rf and R0 are ratios of heavy to light isotopes at partial and complete conversions, respectively, and f is the fraction of conversion of the light substrate.
| eq 8 |
| eq 9 |
| eq 10 |
RESULTS AND DISCUSSION
Initial rate patterns and steady-state kinetic parameters
Intersecting families of double-reciprocal plots were obtained with both uridine and phosphate as varying substrates (Figure 1), consistent with ternary complex formation and a sequential mechanism. Because the double-reciprocal plots intersect to the left of the y axes, a rapid equilibrium ordered mechanism was ruled out (19). Data fitting to eq 2 yielded values of kcat = 14 ± 1 s-1, KPi ~ 230 μM, Kuridine ~ 21 μM, KiPi = 1355 ± 354 μM, kcat/KPi ~ 6.1 × 10⁴ M-1 s-1, kcat/Kuridine ~ 6.7 × 10⁵ M-1 s-1. The KM and specificity constant values are reported as approximations because they fall slightly outside the range of concentrations tested. A sequential mechanism has also been reported for the cestode Hymenolepis diminuta (20) and the trematode Schistosoma mansoni (21) UPs.
Figure 1.
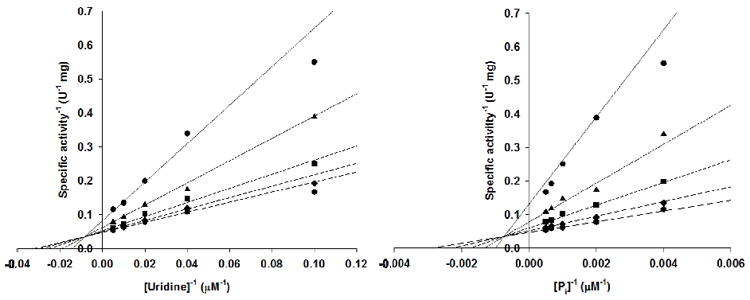
Initial rate patterns for the TcUP reaction.
Product inhibition patterns
Product inhibition data were fitted to eq 3, describing noncompetitive inhibition against both substrates, in agreement with a steady-state random bi bi kinetic mechanism (Table 1) (19, 22). A steady-state random mechanism is also compatible with isotope-trapping experiments and kinetic isotope effect measurements with arsenate as the nucleophile, which ruled out any ordered mechanism with the nucleophile binding first and a steady-state ordered mechanism with uridine binding first to the enzyme (11). These results differ from the steady-state ordered mechanisms reported for human type 1 (6) and rat (23) UPs in which Pi is the first substrate to bind. Rapid-equilibrium random mechanisms have been proposed for UPs from E. coli (4) and Lactobacillus casei (24).
Table 1.
Product inhibition patterns for TcUP.
| Varying substrate | Inhibitor | Type of inhibition | Kis (μM) | Kii (μM) |
|---|---|---|---|---|
| Uridine | R1P | Noncompetitive | 512 ± 165 | 243 ± 28 |
| Uridine | Uracil | Noncompetitive | 79 ± 10 | 304 ± 90 |
| Pi | R1P | Noncompetitive | 601 ± 110 | 256 ± 31 |
| Pi | Uracil | Noncompetitive | 168 ± 45 | 478 ± 83 |
Single-turnover rate constant
The apparent first order rate constant for one turnover of the enzyme (App kchem) was measured as a function of TcUP-Pi binary complex concentration (Figure 2), and its upper limit (kchem = 14 ± 2 s-1) is the asymptotic value given by eq 10, where [E] is the concentration of TcUP-Pi binary complex, and KS′ is an apparent dissociation constant comprising the intrinsic dissociation constant for TcUP-Pi from the TcUP-Pi-uridine ternary complex, with the nucleoside being the limiting substrate (18). If the change in amplitude for binding is negligible in comparison with that for chemistry, the time course for product formation is approximated by a single exponential curve as described by eq 5, even though binding may contribute to App kchem (18). As App kchem becomes independent of [E], all of uridine is bound in the TcUP-Pi-uridine complex and Scheme 2 simplifies to Scheme 3, kchem = k2 + k-2 and is limited only by steps following the formation of the ternary complex capable of undergoing catalysis (25, 26). It is noteworthy that the value of kchem is identical to that of kcat, the steady-state turnover number for TcUP-catalyzed reaction, and KS′ = 19 ± 5 μM is similar to the value of Kuridine. The inset in Figure 2 shows a representative average of stopped-flow traces with 30 μM TcUP, characterized by a single transient (App kchem = 9.6 ± 0.2 s-1).
| eq 10 |
Figure 2.
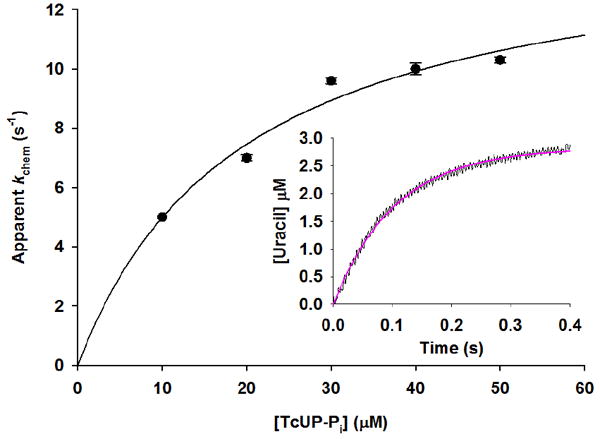
Single-turnover apparent rate constant dependence on TcUP-Pi binary complex concentration. The inset depicts a representative stopped-flow average trace for [TcUP-Pi] = 30 μM.
Scheme 2.

Scheme 3.

No burst in product formation was observed when near-saturating concentrations of both substrates were used, allowing multiple turnovers to occur (Figure 3). The first order rate constants were 14.1 ± 0.4 s-1 and 13.7 ± 0.3 s-1, equal, within experimental error, to kcat and kchem. The absence of a burst phase could be explained by a rate-limiting chemical step or a slow isomerization of the enzyme-substrates ternary complex preceding chemistry. A third possible explanation is an unfavorable equilibrium in the enzyme active site, with k2 being small relative to k-2 (Scheme 3) (25). The latter is unlikely, as enzymes are thought to evolve to bring Keq in their active sites closer to unity than the values in solution (27). In addition, close inspection of Figure 2 shows that the hyperbolic curve intersects the y-axis near the origin, and, since this intersect gives the value of k-2 (28), it is clear that kchem is dominated by k2, and the lack of burst cannot be accounted for by reversibility. Hence, the observations support the inter-conversion of TcUP-Pi-uridine and TcUP-uracil-R1P ternary complexes as the major determinants of the rate of reaction.
Figure 3.
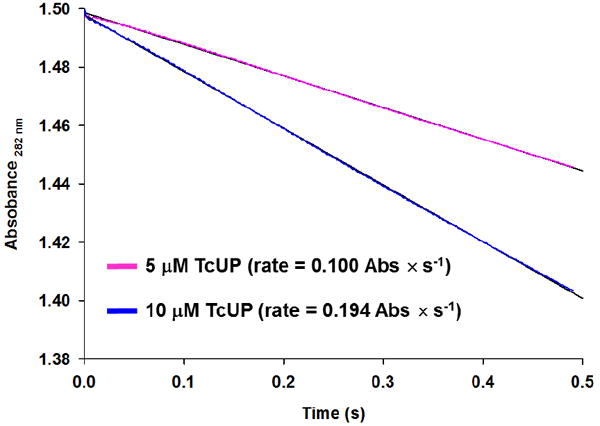
Rapid kinetics of the TcUP reaction under multiple-turnover conditions demonstrating the absence of burst kinetics in product formation.
Pre-steady-state lag phase
In mechanisms lacking a burst, the approach to steady-state may be marked by a substrate concentration-dependent lag phase in product formation, defined as the inverse of the observed rate constant λ (18). A uridine concentration-dependent lag time, τlag, is observed in the reaction catalyzed by TcUP (Figure 4), and a similar pattern was obtained by varying phosphate (data not shown). The apparent second order rate constant for the encounter of the varied substrate and the enzyme-co-substrate binary complex, k1, is estimated by the relationship between τlag and the varied substrate (18), either uridine (Figure 5) or phosphate (Figure 5, inset), described by eq 11, in which [S] is the concentration of the varied substrate and KM is the Michaelis constant. Fitting the data to eq 11 resulted in k1 values of 2.4 × 10⁵ M-1 s-1 and 2.2 × 10⁴ M-1 s-1 for uridine and Pi, respectively, in reasonable agreement with kcat/KM for these substrates.
| eq 11 |
Figure 4.
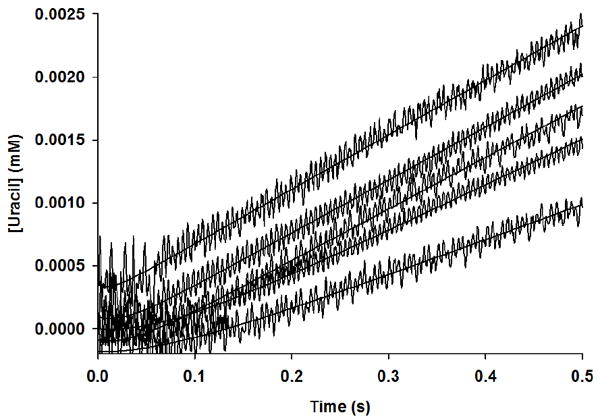
Lag phase in the approach to steady-state for uracil formation.
Figure 5.
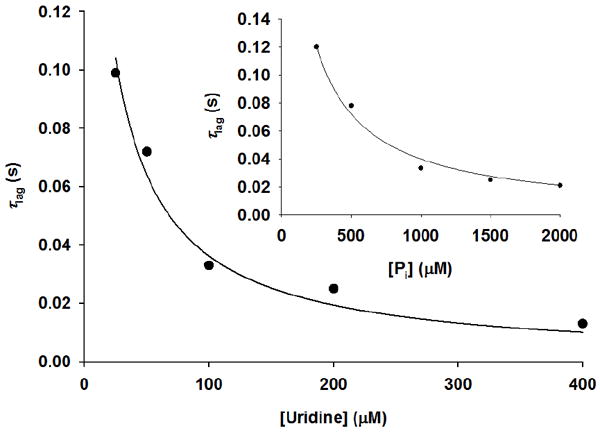
Lag time dependence on the concentration of uridine and (inset) Pi.
1′-14C, 1,3-15N2, and 1′-3H kinetic isotope effects on V/K
Competitive kinetic isotope effects probe isotopic-substitution-sensitive steps between free labeled reactant up to, and including, the first irreversible step, often assumed to be release of the first product under initial rate conditions (29, 30). The competitive kinetic isotope effects determined for the phosphorolysis of uridine by TcUP are summarized in Table 2. The normal KIE values indicate that 1′-3H, 1′-14C, and 1,3-15N2 occupy a less constrained bonding environment in the transition state than in the reactant state (31). The significant values for 14(V/K)uridine, α-T(V/K)uridine, and 15,β-15(V/K)uridine rules out a steady-state ordered kinetic mechanism with uridine binding first to the enzyme, where KIEs would be unity, and suggests that chemistry is at least partly rate-limiting in this reaction (15). In spite of the significant KIE values, caution is advised in interpreting isotope effects on V/K alone as evidence for chemistry contributing to reaction rate (29, 32). Additional evidence however concurs with the observed V/K KIEs to support a contribution from chemistry to the rate of TcUP-catalyzed reaction, such as the steady-state kcat reflecting the rate constant for the inter-conversion of the TcUP-Pi-uridine and TcUP-uracil-R1P ternary complexes.
Table 2.
Competitive kinetic isotope effects for uridine phosphorolysis catalyzed by TcUP.
| L(V/K)uridine Position | Remote Label | Type of L(V/K)uridine | L(V/K)uridine |
|---|---|---|---|
| 1′-3H | [5′-14C]uridine | α-Secondary | 1.063 ± 0.002a |
| 1′-14C | [1′-3H]uridine | Primary | 1.069 ± 0.004b |
| 5′-14C,1,3-15N | [1′-3H]uridine | Primary, β-Secondary | 1.018 ± 0.004b |
Measured with [5′-14C]uridine as remote label, assuming δ-14(V/K) to be unity.
Corrected for [1′-3H]uridine as remote label according to the equation L(V/K) = L(V/K)obs × α-T(V/K).
The intrinsic 1′-14C KIE for the irreversible arsenolysis of uridine catalyzed by TcUP is 1.103 (11), significantly greater than the value of 1.069 for the phosphorolysis reaction (Table 2). In an analogous reaction, phosphate and arsenate as nucleophiles yielded the same intrinsic KIE values for the Phe200Gly mutant of human PNP (33). If we assume that arsenate and phosphate lead to similar intrinsic isotope effects for TcUP, the 14(V/K)uridine for phosphorolysis of uridine represents 67% of the intrinsic 1′-14C KIE, a reasonable comparison to the arsenolysis case, where 14(V/K)uridine represents 78% of the intrinsic KIE with the remaining fraction obscured by forward commitment (Cf) (11). These differences may result from different Cf values for uridine with arsenate and phosphate, and/or the presence of reverse commitment (Cr) with phosphate, which is thought to be negligible for arsenolysis (11).
KIEs on V/K do not directly provide information for quantitative analysis of transition-state structure (14, 29, 34, 35), as they are reduced from their intrinsic values by commitment factors, according to eq 12. Here, Lk is the intrinsic isotope effect, Cf and Cr are the forward and reverse commitment factors, respectively, and LKeq is the isotope effect on the equilibrium constant of the reaction (29, 30). As Cf and Cr cannot assume negative values (36), the magnitude of Lk can only be equal to or larger than the observed normal L(V/K) after correction by eq 12.
| eq 12 |
Hence, the values of 14(V/K)uridine = 1.069, α-T(V/K)uridine = 1.063, and 15,β-15(V/K)uridine = 1.018 represent the lower limit of KIEs for a candidate transition-state structure for TcUP-catalyzed phosphorolysis reaction. The large value of the 14(V/K)uridine and the relatively small value of the α-T(V/K)uridine establish an ANDN (37) (SN2) chemical mechanism. Reactions following DN+AN or DN*AN (37) (SN1) mechanisms are characterized by small primary carbon and large α-secondary hydrogen isotope effects (38, 39). This analysis is in qualitative agreement with the transition-state model proposed for TcUP-catalyzed arsenolysis of uridine on the basis of intrinsic isotope effects (11). In contrast, a glycal intermediate has been proposed for bovine and E. coli UPs from x-ray crystal structures, consistent with ribocation transition states and SN1 mechanisms (40).
Acid-base chemistry
The pH-rate profiles obtained for the TcUP reaction show catalysis and binding of substrates decrease in the basic limb with a slope of −1, indicating that one group needs to be protonated for full enzymatic activity (Figure 6) (41). The similarity in the apparent pKa values, ranging from 9.4 to 9.7, implicates the same group being observed in all profiles, and suggests that the rate-limiting step and the first irreversible step are the same. The pKa value for the 3-NH group of uridine is 9.2 (42), near the range observed here in the pH-profiles. In the bimolecular transition state model proposed for uridine arsenolysis by TcUP, the leaving group is not immediately protonated at 1-N (11), a common feature of reactions involving pyrimidine nucleoside cleavage (40, 43-45). Thus, the product is an anionic nucleobase following C – N bond breakage and C – O bond formation. It is possible that the pH-profiles for TcUP report on the N3 protonation state of uridine, since its deprotonation at high pH would result in an anionic nucleoside , requiring the stabilization of a dianionic leaving group at the transition state, an unlikely possibility reflected in the loss of kcat at elevated pH.
Figure 6.
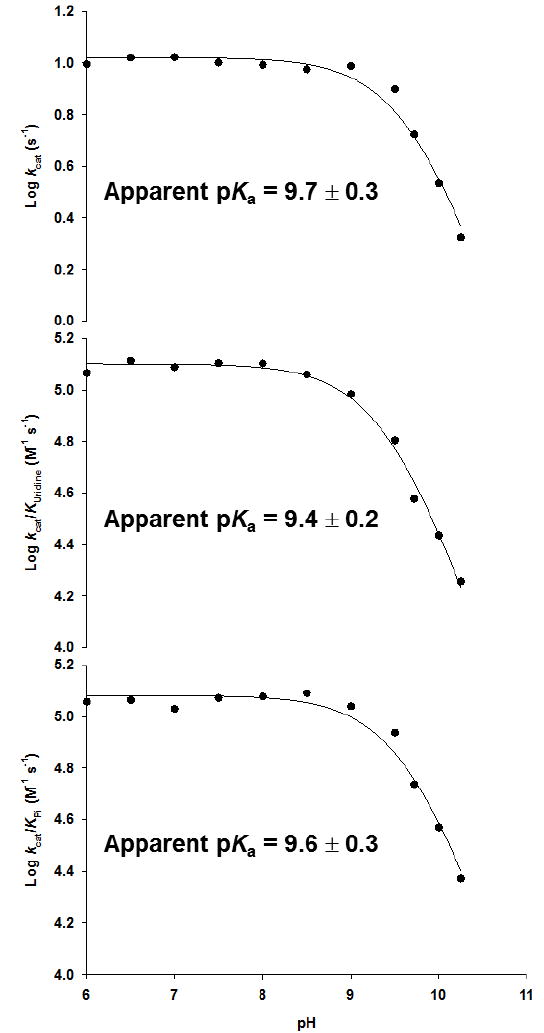
pH-rate profiles for TcUP-catalyzed reaction.
Solvent isotope effects
Solvent deuterium kinetic isotope effects were determined for varied Pi and uridine concentrations in the TcUP reaction (Figure 7). Fitting to eq 4 indicated no significant solvent isotope effects with values of D2O(V/K)uridine = 1.1 ± 0.2, D2OVuridine = 1.0 ± 0.1, D2O(V/K)Pi = 1.0 ± 0.2, and D2OVPi = 1.0 ± 0.1. The UP reaction is expected to involve at least one proton transfer step, the protonation of the anionic uracil at the catalytic site to generate the neutral product uracil. The unity values of D2O(V/K) and D2OV indicate no proton transfer taking place in a rate-limiting step. Fast protonation of bound anionic uracil after the chemical step, or rapid release of anionic uracil to solvent are consistent with this result.
Figure 7.
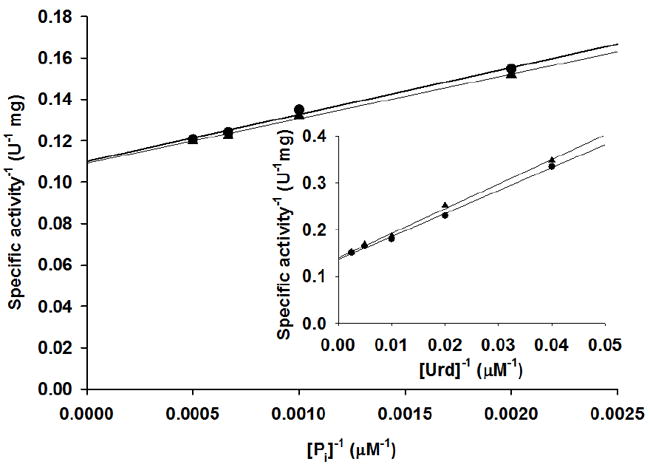
Solvent deuterium kinetic isotope effects with Pi and (inset) uridine as varied substrates.
Potential energy surface and stationary-point transition structures
Phosphorolysis of uridine was modeled in the gas phase by varying the C – N bond length (rC-N) and C – O bond length (rC-O) by increments of 0.2 Å along the reaction coordinate. The potential energy landscape places the transition state in a region with rC-N ranging from 2.0 to 2.2 Å, and rC-O, from 2.4 to 2.8 Å (Figure 8). A stationary-point transition-state structure for the reaction (Figure 9A), located with no geometric constraints, yielded rC-N = 2.02 Å and rC-O = 2.71 Å, within the region suggested by the energy landscape. A strikingly similar transition structure was located in the same fashion with arsenate as nucleophile (Figure 9B) (Stationary-point transition structure coordinates available as Supporting Information). Using rC-N and rC-O in bond order (ni-j) analysis according to eq 13, where nij is the bond order between atoms i and j, rb is the bond length for a single bond between atoms of elements i and j, and rij is the bond length between atoms i and j (46), resulted in nC-N = 0.40 and nC-O = 0.12 at the transition structure in Figure 9A.
| eq 13 |
Figure 8.
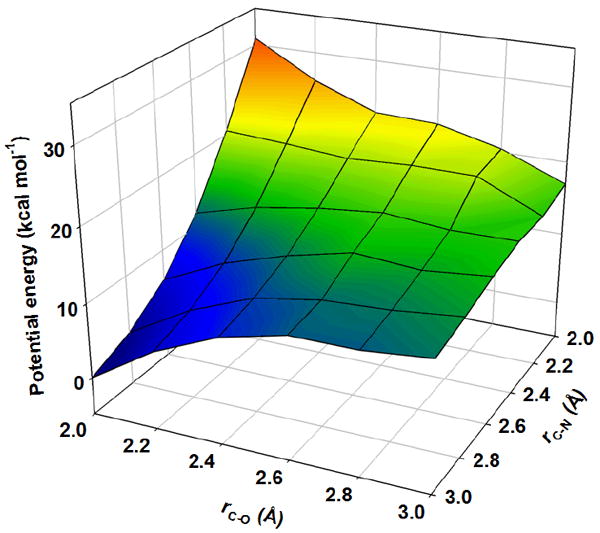
Potential energy surface for uridine phosphorolysis modeled by DFT in the gas phase.
Figure 9.
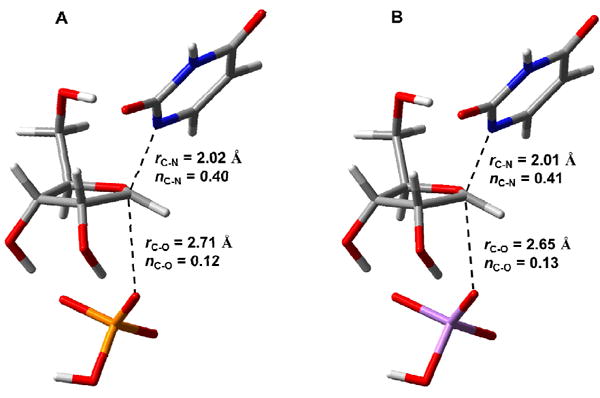
Stick models of stationary-point transition structures for uridine cleavage calculated by DFT in the gas phase with (A) Pi or (B) arsenate as nucleophiles. Carbon atoms are shown in gray, nitrogen in blue, oxygen in red, hydrogen in white, phosphorus in yellow, and arsenic in purple. Bond lengths (in Å) and bond orders (Pauling bond order) are shown for leaving group and nucleophile positions at the calculated transition state.
These values imply significant bond character between the ribosyl group, the leaving group and the nucleophile at the transition state, as expected in an ANDN mechanism (37). The DFT-modeled uridine phosphorolysis mechanism corroborates, qualitatively, the SN2 mechanism proposed for the reaction in solution catalyzed by TcUP2.
Implications for the mechanism of TcUP-catalyzed reaction
Initial rate and product inhibition patterns are compatible with a steady-state random bi bi kinetic mechanism for TcUP-catalyzed reaction, and pre-steady-state kinetics and kinetic isotope effects indicate rate-limiting steps occur up to, and include, the formation of the product R1P and the proposed anionic nucleobase (Scheme 4). The values of the heavy atom and tritium kinetic isotope effects point to an SN2 mechanism for C – N bond loss and C – O bond formation, in agreement with the mechanism proposed for arsenolysis (11). The pH-rate profiles indicate that a protonated group, possibly the 3-NH of uridine, is essential for catalysis. Deprotonation of 3-NH in the ground state would generate a dianioic uracil at the transition state, a less effective leaving group (Scheme 5). A mono-anionic pyrimidine leaving group has also been implicated in other reactions involving pyrimidine nucleosides N-ribosidic bond breakage (40, 43-45, 47, 48). The SN2 mechanism proposed here for the TcUP reaction is also found in DFT-based calculations of uridine phosphorolysis in the gas phase.
Scheme 4.
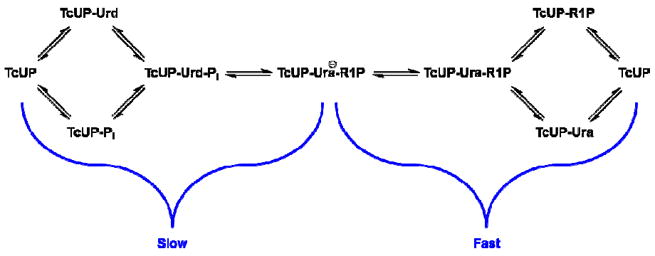
Kinetic mechanism proposed for the TcUP reaction.
Scheme 5.

Chemical mechanism proposed for TcUP-catalyzed uridine phosphorolysis.
Supplementary Material
Acknowledgments
The authors thank Dr. Keith Hazleton of this laboratory for his generous gift of UMP synthase, and Drs. Jennifer S. Hirschi and Mathew J. Vetticatt for insightful discussions on DFT calculations.
Footnotes
This work was supported by NIH grants AI049512 and GM068036.
Abbriviations used: UP, uridine phosphorylase; R1P, α-D-ribose 1-phosphate; Keq, equilibrium constant; NP-I, nucleoside phosphorylase-I; DFT, density functional theory; TcUP, T. cruzi uridine phosphorylase; Pi, inorganic phosphate; PNP, purine nucleoside phosphorylase; KIE, kinetic isotope effect.
It should be pointed out that no quantitative assertion can be made about the transition state structure of the TcUP-catalyzed phosphorolysis of uridine. Intrinsic KIEs are required for quantitative analysis of transition state structures and the KIEs reported here are not intrinsic. Accordingly, the DFT-calculated transition structure depicted in Figure 9A could be interpreted only as a qualitative, not quantitative, representation of the transition structure for the TcUP reaction.
SUPPORTING INFORMATIN AVAILABLE Stationary-point transition structure coordinates with phosphate and arsenate. This material is available free of charge via the Internet at http://pubs.acs.org.
References
- 1.Paege LM, Schlenk F. Bacterial uracil riboside phosphorylase. Arch Biochem Biophys. 1952;40:42–49. doi: 10.1016/0003-9861(52)90071-4. [DOI] [PubMed] [Google Scholar]
- 2.Pizzorno G, Cao D, Leffert JJ, Russell RL, Zhang D, Handschumacher RE. Homeostatic control of uridine and the role of uridine phosphorylase: a biological and clinical update. Biochim Biophys Acta. 2002;1587:133–144. doi: 10.1016/s0925-4439(02)00076-5. [DOI] [PubMed] [Google Scholar]
- 3.Cao D, Leffert JJ, McCabe J, Kim B, Pizzorno G. Abnormalities in uridine homeostatic regulation and pyrimidine nucleotide metabolism as a consequence of the deletion of the uridine phosphorylase gene. J Biol Chem. 2005;280:21169–21175. doi: 10.1074/jbc.M412343200. [DOI] [PubMed] [Google Scholar]
- 4.Vita A, Huang CY, Magni G. Uridine phosphorylase from Escherichia coli B.: kinetic studies on the mechanism of catalysis. Arch Biochem Biophys. 1983;226:687–692. doi: 10.1016/0003-9861(83)90339-9. [DOI] [PubMed] [Google Scholar]
- 5.Pugmire MJ, Ealick SE. Structural analyses reveal two distinct families of nucleoside phosphorylases. Biochem J. 2002;361:1–25. doi: 10.1042/0264-6021:3610001. [DOI] [PMC free article] [PubMed] [Google Scholar]
- 6.Renck D, Ducati RG, Palma MS, Santos DS, Basso LA. The kinetic mechanism of human uridine phosphorylase 1: Towards the development of enzyme inhibitors for cancer chemotherapy. Arch Biochem Biophys. 2010;497:35–42. doi: 10.1016/j.abb.2010.03.004. [DOI] [PubMed] [Google Scholar]
- 7.Komissarov AA, Moltchan OK, Romanova DV, Debabov VG. Enzyme-catalyzed uridine phosphorolysis: SN2 mechanism with phosphate activation by desolvation. FEBS Lett. 1994;355:192–194. doi: 10.1016/0014-5793(94)01204-0. [DOI] [PubMed] [Google Scholar]
- 8.Kline PC, Schramm VL. Purine nucleoside phosphorylase. Catalytic mechanism and transition-state analysis of the arsenolysis reaction. Biochemistry. 1993;32:13212–13219. doi: 10.1021/bi00211a033. [DOI] [PubMed] [Google Scholar]
- 9.Lewandowicz A, Schramm VL. Transition state analysis for human and Plasmodium falciparum purine nucleoside phosphorylases. Biochemistry. 2004;43:1458–1468. doi: 10.1021/bi0359123. [DOI] [PubMed] [Google Scholar]
- 10.Singh V, Schramm VL. Transition-state structure of human 5’-methylthioadenosine phosphorylase. J Am Chem Soc. 2006;128:14691–14696. doi: 10.1021/ja065419p. [DOI] [PMC free article] [PubMed] [Google Scholar]
- 11.Silva RG, Vetticatt MJ, Merino EF, Cassera MB, Schramm VL. Transition-State Analysis of Trypanosoma cruzi Uridine Phosphorylase-Catalyzed Arsenolysis of Uridine. J Am Chem Soc. 2011;133:9923–9931. doi: 10.1021/ja2031294. [DOI] [PMC free article] [PubMed] [Google Scholar]
- 12.Singh V, Lee JE, Nunez S, Howell PL, Schramm VL. Transition state structure of 5’-methylthioadenosine/S-adenosylhomocysteine nucleosidase from Escherichia coli and its similarity to transition state analogues. Biochemistry. 2005;44:11647–11659. doi: 10.1021/bi050863a. [DOI] [PubMed] [Google Scholar]
- 13.Parkin DW, Leung HB, Schramm VL. Synthesis of nucleotides with specific radiolabels in ribose. Primary 14C and secondary 3H kinetic isotope effects on acid-catalyzed glycosidic bond hydrolysis of AMP, dAMP, and inosine. J Biol Chem. 1984;259:9411–9417. [PubMed] [Google Scholar]
- 14.Northrop DB. Steady-state analysis of kinetic isotope effects in enzymic reactions. Biochemistry. 1975;14:2644–2651. doi: 10.1021/bi00683a013. [DOI] [PubMed] [Google Scholar]
- 15.Cook PF, Cleland WW. Mechanistic deductions from isotope effects in multireactant enzyme mechanisms. Biochemistry. 1981;20:1790–1796. doi: 10.1021/bi00510a013. [DOI] [PubMed] [Google Scholar]
- 16.Frisch MJ, et al. Gaussian 09, Revision A.02. Gaussian, Inc.; Wallingford CT: 2009. [Google Scholar]
- 17.Hirschi JS, Takeya T, Hang C, Singleton DA. Transition-state geometry measurements from (13)c isotope effects. The experimental transition state for the epoxidation of alkenes with oxaziridines. J Am Chem Soc. 2009;131:2397–2403. doi: 10.1021/ja8088636. [DOI] [PMC free article] [PubMed] [Google Scholar]
- 18.Hiromi K. Kinetics of fast enzyme reactions: theory and practice. Halsted Press; Tokyo: 1979. [Google Scholar]
- 19.Cleland WW. Enzyme kinetics. Annu Rev Biochem. 1967;36:77–112. doi: 10.1146/annurev.bi.36.070167.000453. [DOI] [PubMed] [Google Scholar]
- 20.Drabikowska AK. Uridine phosphorylase from Hymenolepis diminuta (cestoda): kinetics and inhibition by pyrimidine nucleoside analogs. Acta Biochimica Polonica. 1996;43:733–742. [PubMed] [Google Scholar]
- 21.el Kouni MH, Naguib FN, Niedzwicki JG, Iltzsch MH, Cha S. Uridine phosphorylase from Schistosoma mansoni. J Biol Chem. 1988;263:6081–6086. [PubMed] [Google Scholar]
- 22.Segel IH. Enzyme kinetics. Behavior and analysis of rapid equilibrium and steady-state enzyme systems. John Wiley and Sons, Inc.; New York: 1975. [Google Scholar]
- 23.Kraut A, Yamada EW. Cytoplasmic uridine phosphorylase of rat liver. Characterization and kinetics. J Biol Chem. 1971;246:2021–2030. [PubMed] [Google Scholar]
- 24.Avraham Y, Grossowicz N, Yashphe J. Purification and characterization of uridine and thymidine phosphorylase from Lactobacillus casei. Biochim Biophys Acta. 1990;1040:287–293. doi: 10.1016/0167-4838(90)90089-x. [DOI] [PubMed] [Google Scholar]
- 25.Johnson KA. Transient-state kinetic analysis of enzyme reaction pathways. The Enzymes. 1992;20:1–61. [Google Scholar]
- 26.Johnson KA. Rapid kinetic analysis of mechanochemical adenosinetriphosphatases. Methods Enzymol. 1986;134:677–705. doi: 10.1016/0076-6879(86)34129-6. [DOI] [PubMed] [Google Scholar]
- 27.Albery WJ, Knowles JR. Evolution of enzyme function and the development of catalytic efficiency. Biochemistry. 1976;15:5631–5640. doi: 10.1021/bi00670a032. [DOI] [PubMed] [Google Scholar]
- 28.Strickland S, Palmer G, Massey V. Determination of dissociation constants and specific rate constants of enzyme-substrate (or protein-ligand) interactions from rapid reaction kinetic data. J Biol Chem. 1975;250:4048–4052. [PubMed] [Google Scholar]
- 29.Northrop DB. The expression of isotope effects on enzyme-catalyzed reactions. Annu Rev Biochem. 1981;50:103–131. doi: 10.1146/annurev.bi.50.070181.000535. [DOI] [PubMed] [Google Scholar]
- 30.Cleland WW. Use of isotope effects to elucidate enzyme mechanisms. CRC Crit Rev Biochem. 1982;13:385–428. doi: 10.3109/10409238209108715. [DOI] [PubMed] [Google Scholar]
- 31.Cook PF. Mechanism from isotope effects. Isotopes Environ Health Stud. 1998;34:3–17. doi: 10.1080/10256019808036353. [DOI] [PubMed] [Google Scholar]
- 32.Northrop DB. On the meaning of Km and V/K in enzyme kinetics. J Chem Edu. 1998;75:1153–1157. [Google Scholar]
- 33.Silva RG, Hirschi JS, Ghanem M, Murkin AS, Schramm VL. Arsenate and Phosphate as Nucleophiles at the Transition States of Human Purine Nucleoside Phosphorylase. Biochemistry. 2011;50:2701–2709. doi: 10.1021/bi200279s. [DOI] [PMC free article] [PubMed] [Google Scholar]
- 34.Cleland WW. The use of isotope effects to determine transition-state structure for enzymic reactions. Methods Enzymol. 1982;87:625–641. doi: 10.1016/s0076-6879(82)87033-x. [DOI] [PubMed] [Google Scholar]
- 35.Schramm VL. Enzymatic transition-state analysis and transition-state analogs. Methods Enzymol. 1999;308:301–355. doi: 10.1016/s0076-6879(99)08015-5. [DOI] [PubMed] [Google Scholar]
- 36.Hermes JD, Roeske CA, O’Leary MH, Cleland WW. Use of multiple isotope effects to determine enzyme mechanisms and intrinsic isotope effects. Malic enzyme and glucose-6-phosphate dehydrogenase. Biochemistry. 1982;21:5106–5114. doi: 10.1021/bi00263a040. [DOI] [PubMed] [Google Scholar]
- 37.Guthrie RD, Jencks WP. Iupac Recommendations for the Representation of Reaction-Mechanisms. Acc Chem Res. 1989;22:343–349. [Google Scholar]
- 38.Berti PJ, Tanaka KSE. Transition State Analysis Using Multiple Kinetic Isotope Effects: Mechanisms of Enzymatic and Non-enzymatic Glycoside Hydrolysis and Transfer. Adv Phys Org Chem. 2002;37:239–314. [Google Scholar]
- 39.Berti PJ, McCann JA. Toward a detailed understanding of base excision repair enzymes: transition state and mechanistic analyses of N-glycoside hydrolysis and N-glycoside transfer. Chem Rev. 2006;106:506–555. doi: 10.1021/cr040461t. [DOI] [PubMed] [Google Scholar]
- 40.Paul D, O’Leary SE, Rajashankar K, Bu W, Toms A, Settembre EC, Sanders JM, Begley TP, Ealick SE. Glycal formation in crystals of uridine phosphorylase. Biochemistry. 2010;49:3499–3509. doi: 10.1021/bi902073b. [DOI] [PMC free article] [PubMed] [Google Scholar]
- 41.Cleland WW. The use of pH studies to determine chemical mechanisms of enzyme-catalyzed reactions. Methods Enzymol. 1982;87:390–405. doi: 10.1016/s0076-6879(82)87024-9. [DOI] [PubMed] [Google Scholar]
- 42.Dawson RMC, Elliott DC, Elliott WH, Jones KM. Data for biochemical research. Oxford University Press; New York: 1986. [Google Scholar]
- 43.Schwartz PA, Vetticatt MJ, Schramm VL. Transition state analysis of the arsenolytic depyrimidination of thymidine by human thymidine phosphorylase. Biochemistry. 2011;50:1412–1420. doi: 10.1021/bi101900b. [DOI] [PMC free article] [PubMed] [Google Scholar]
- 44.Miracco EJ, Mueller EG. The Products of 5-Fluorouridine by the Action of the Pseudouridine Synthase TruB Disfavor One Mechanism and Suggest Another. J Am Chem Soc. 2011;133:11826–11829. doi: 10.1021/ja201179f. [DOI] [PMC free article] [PubMed] [Google Scholar]
- 45.Zhang Y, Schramm VL. Pyrophosphate interactions at the transition states of Plasmodium falciparum and human orotate phosphoribosyltransferases. J Am Chem Soc. 2010;132:8787–8794. doi: 10.1021/ja102849w. [DOI] [PMC free article] [PubMed] [Google Scholar]
- 46.Houk KN, Gustafson SM, Black KA. Theoretical secondary kinetic isotope effects and the interpretation of transition state geometries. I. The Cope rearrangement. J Am Chem Soc. 1992;114:8565–8572. [Google Scholar]
- 47.Schwartz PA, Vetticatt MJ, Schramm VL. Transition state analysis of thymidine hydrolysis by human thymidine phosphorylase. J Am Chem Soc. 2010;132:13425–13433. doi: 10.1021/ja105041j. [DOI] [PMC free article] [PubMed] [Google Scholar]
- 48.Tran TH, Christoffersen S, Allan PW, Parker WB, Piskur J, Serra I, Terreni M, Ealick SE. The Crystal Structure of Streptococcus pyogenes Uridine Phosphorylase Reveals a Distinct Subfamily of Nucleoside Phosphorylases. Biochemistry. 2011;50:6549–6558. doi: 10.1021/bi200707z. [DOI] [PMC free article] [PubMed] [Google Scholar]
Associated Data
This section collects any data citations, data availability statements, or supplementary materials included in this article.


