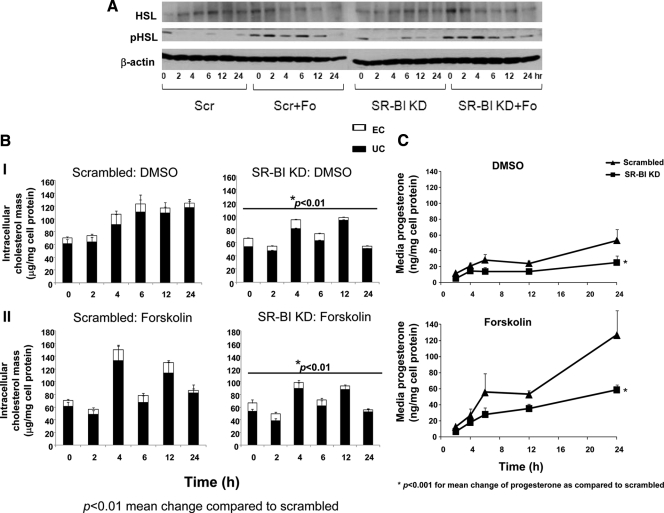
Figure 3.
Total and pHSL expression in SR-BI KD cells. HGL5 cells were transfected with scrambled or SR-BI siRNA oligonucleotides for 72 h, and then transfected cells were incubated with DMSO or Fo (10 μm) for an additional 0–24 h. Cell lysates were harvested at each time point, and then total HSL and pHSL were measured by Western blotting using specific monoclonal antibodies. The blot is representative of three independent experiments. B, Intracellular cholesterol mass in SR-BI KD cells under basal and Fo-stimulated conditions. Scrambled (Scr) and SR-BI KD cells were incubated with DMSO or Fo (10 μm) for 0–24 h. At each time point, intracellular lipids were extracted using hexane:isopropanol, then quantified by gas chromatography using stigmasterol as an internal standard, and normalized to milligram of cell protein. The data represent the mean ± se of three independent experiments, with each experiment performed using triplicate wells. *, P < 0.01 of the mean change of total cholesterol mass compared with scrambled cells. Cells designated 0 h for DMSO or Fo were cells after transfection and served as the baseline condition for the treatment phase. Error bars not visualized are contained with the symbol. C, Time course of progesterone secretion in SR-BI KD cells. Scrambled and SR-BI KD cells were incubated with DMSO or Fo (10 μm) for 2–24 h. Media progesterone levels were measured by RIA. The data represent the mean ± se of three independent experiments, with each experiment performed using triplicate wells. Error bars not visualized are contained with the symbol. *, P < 0.001 for the mean progesterone change over 2–24 h compared with scrambled cells.

