

Abstract
Influenza antigenic cartography projects influenza antigens into a two or three dimensional map based on immunological datasets, such as hemagglutination inhibition and microneutralization assays. A robust antigenic cartography can facilitate influenza vaccine strain selection since the antigenic map can simplify data interpretation through intuitive antigenic map. However, antigenic cartography construction is not trivial due to the challenging features embedded in the immunological data, such as data incompleteness, high noises, and low reactors. To overcome these challenges, we developed a computational method, temporal Matrix Completion-Multidimensional Scaling (MC-MDS), by adapting the low rank MC concept from the movie recommendation system in Netflix and the MDS method from geographic cartography construction. The application on H3N2 and 2009 pandemic H1N1 influenza A viruses demonstrates that temporal MC-MDS is effective and efficient in constructing influenza antigenic cartography. The web sever is available at http://sysbio.cvm.msstate.edu/AntigenMap.
Keywords: Antigenic cartography, influenza, Matrix Completion, Multidimensional Scaling, temporal model
Introduction
As a segmented, negative stranded RNA virus, influenza virus is notorious for rapid mutations and reassortments. The mutations on the surface glycoproteins (HA and NA) of influenza viruses are called antigenic drifts, and these antigenic drift events allow the virus to evade the accumulating immunity from previous infection or vaccination and lead to seasonal influenza epidemics. A reassortment event with a novel influenza antigen may result in antigenic shift and cause influenza pandemic. For instance, the 2009 H1N1 pandemic virus is a reassortant with a swine origin HA antigen.
Vaccination is the primary option for reducing the effect of influenza, and identification of the right vaccine strains is the key to development of an effective vaccination program. The antigenicity of an optimal vaccine strain should match that of the epidemic strain. In influenza surveillance program, the influenza antigenic variants are generally identified by the immunological tests, such as hemagglutination inhibition (HI) assay, microneutralization (MN) assay, or ELISA. These immunological assays measure the antigenic diversity between influenza viruses by comparing the reaction titers among the test antigens and reference antisera. However, data interpretation of the data from these assays is not trivial due to the embedded challenges such as data incompleteness, high noises, and low reactors.
By mimicking geographic cartography, influenza antigenic cartography projects influenza antigens into a two or three dimensional map using immunological datasets.1 Antigenic cartography can simplify the data interpretation, and thus, facilitate influenza antigenic variant identification. Recently, we developed a novel computational method, temporal Matrix Completion-Multidimensional Scaling (MC-MDS), in antigenic cartography construction.2 In this paper, we described the details of temporal MC-MDS, especially the original concepts introduced in this method, and how they can achieve the robustness in antigenic cartography construction.
Methods
Our method included two integrative steps: it first reconstructs the HI matrices using low rank MC method, and then generates antigenic cartography using MDS with a temporal regularization. The MC concept was adapted from the movie recommendation system in Netflix and the cartography concept from geographic cartography.
MC and Netflix
In 2006, Netflix, an online DVD and Blu-ray Disc rental-by-mail and video streaming company, held a 3-year Netflix Prize contest (http://www.netflixprize.com/) on computational methods for improving its recommendation system.3 In its recommendation system, Netflix collected the rating data from the individuals. Based on his or her renting history and the ratings in the systems (e.g., from evaluators and other renters), Netflix recommendation system suggests certain movies to a renter. Apparently, no individuals would be feasible to provide ratings for all of the movies, as it will take hundreds of years for a single person to rate over 50 000 movies available from Netflix. Thus, the resulting rating data is an incomplete matrix, and it can be as sparse as less as 1%.4 The challenge in Netflix recommendation system is a classic MC problem.4–8 As the inspiration of Netflix Prize contest, many efficient low rank MC algorithms were developed, for instance, Opt-Space,7 SVT,5 CF,9 BellKor,10 PF,11 and FWLS.12 Eventually, the team BellKor’s Pragmatic Chaos won this contest. Their methods combines nonlinear probe blending and linear quiz blending to come up with a predictor BigChaos.13
Matrix completion estimates the unobserved values based on the observed values. The users can refill the missing data without repeating the experiments. Furthermore, MC will help reduce the noises in the data, for instance, those biases by different individuals performing experiments.
In influenza antigenic characterization, HI assay is a commonly used assay for antigenic analysis, since HI assay is relatively economic and easy to perform. However, HI is labor intensive, and it is almost impossible for any individual lab to complete the HI assays for all pairs of antigens and antisera during influenza surveillance. In addition, both testing antigens and the reference antisera are dynamic. For instance, in seasonal influenza surveillance, generally only contemporary antisera are used in experiments. Thus, we will have to integrate multiple HI tables in order to evaluate the overall antigenic changes for influenza vaccine strain selection. The resulting HI tables will be incomplete, and the observed entries in the integrated HI data can be as less as 3%. The completion of this matrix can be formulated as a typical MC.
Briefly, given the combination of HI matrix with m antigens and n antisera, the HI matrix can be represented as Mm×n = (mij)m×n, where mij denotes the HI values from the reaction between testing antigen i and antiserum j. The low rank MC assumes that both antigen and antiserum can be embedded into a low rank space. To be specific, the low rank MC method is to seek matrix Um×r, Vn×r and a diagonal matrix Σr×r, where M = Um×rΣr×r(Vn×r)T. In order to achieve this goal, the optimization formulation has been employed, which can be represent as following,
| (1) |
where E denotes the observed entries in HI matrix and g(X) is a regularization function. The Eqn (1) is the standard format of a low rank MC formulation.
MDS and geographic cartography construction
The geographic cartography is a common technique to display the cities and their geographic distances in a map. This cartography can be generated using MDS based on a geographic distance matrix. Figure 1(A) shows the antigenic cartography generated using a distance matrix with seven cities, and Figure 1(B) is a map for comparison.
Figure 1.

Comparison of the map and geographic cartography generated solely based on seven cities. (A) The cartography constructed by using Multidimensional Scaling; (B) the geographic map of this area generated using ArcGIS 9.3 (Esri company, Redlands CA, USA).
As an analog of geographic cartography, the influenza antigenic cartography maps the influenza antigens into a two or three dimensional map based on the distance matrix generated using immunological data. This incomplete matrix can be filled through MC algorithm discussed in section MC and Netflix.
Low reactors, non-random date incompleteness, and temporal model
Generally, three types of data are present in a combined HI matrix: high reactor, low reactor, and missing values. Among these three data types, high reactors are the most reliable data points. The low reactors are those values present in the HI matrix as “equal to or less than a threshold θ”, where θ can be 5, 10, 20, or 40. Low reactors have similar values in the affinity dataset but could be from different binding settings. These low reactors are present due to the detection limits of biotechnology, and they are not reliable. Both these missing values and low reactors make it very difficult to analyze and interpret antigenic correlations amongst tested antigens and reference antigens. To our best knowledge, none of the existing MC method can handle the threshold values.
In addition, the non-random incompleteness of influenza immunological datasets generates an additional challenge in traditional MC methods, which are based on the assumption that the observed values are randomly distributed among the matrix. In a typical combined antigenic HI data, most of the off-diagonal entries are missing values or low reactor values.1
In order to overcome the above issues, we incorporated a regularization function into the Eqn (1),
| (2) |
where if and otherwise.
This indicator function is only valid for those entries with low reactor values. An alternating gradient decent method is applied to solve the optimization problem in Eqn (2). In addition, a temporal MDS method is proposed to project the antigens into a 2 or 3 dimensional map.
| (3) |
where Dij is the average distance between virus I and virus j, ti is the isolation year of virus i, dij is the distance between virus i and virus j in cartography, daci is the distance between virus a and center of group i, and dcicj is the distance between the centers of group I and group j. All the parameters are tuned by cross validation. We named this method as temporal MC-MDS.
Results
By applying temporal MC-MDS method in an H3N2 data-set,2 which includes 4215 (19·56%) observed entries from the reactions among 273 H3N2 testing antigens and 79 reference antisera, 937 of 4215 observed values (22·2%) are low reactors. Figure 2(A) is a three-dimensional influenza antigenic map based on this data by using MC-MDS method. The reported 11 clusters (HK68, EN72, VI75, TX77, BK79, SI87, BE89, BE92, WU95, SY97, and FU02) were displayed in the core of a spiral S-shape, and BK79 and BE92 are located at the turning point of this S-shape. However, the antigenic distances between some viruses are incorrect. For example, the distance between HK68 and FU02 in the projection is 7·1223 units, which is close to the distance between HK68 and BK79 (6·5113 units). The main reason leading to those inaccurate distances is the unique distribution of HI datasets described in section 2.3. In comparison, with the temporal model, not only the viruses in 11 clusters have been clearly separated, but also the antigenic distances between each cluster are proportional to their isolation time interval. In this updated cartography (Figure 2B), the antigenic distance between HK68 and FU02 is 15·0633 units, where the distance between HK68 and FU02 is 6·3984 units. This result suggested that the temporal information is critical for antigenic cartography construction for immunological datasets spanning a long time period. The HI data from seasonal influenza surveillance belong to this category.
Figure 2.
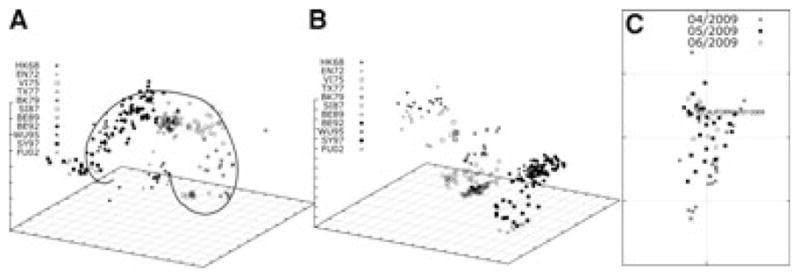
Antigenic cartography with and without temporal model. (A) The three dimensional antigenic cartography for A/H3N2 seasonal influenza virus (1968–2002) without temporal model, and the antigenic clusters were defined in Ref. [2]; (B) the three dimensional antigenic cartography for A/H3N2 seasonal influenza virus (1968–2002) with temporal model; (C) the two dimensional antigenic cartography for 2009 A/H1N1 pandemic influenza without temporal model, and these viruses were labeled in shape by the corresponding month for them to be detected. One grid is corresponding to a twofold change in hemagglutination inhibition experiment.
For seasonal influenza virus/pandemic influenza viruses within a short time span, the temporal model is probably not necessary, as there is lack of long-term immunological pressure present in the population. Figure 2(C) is an antigenic cartography generated using a HI dataset with 2009 H1N1 influenza viruses spanning from April of 2009 to June of 2009. This map demonstrates that there is lack of antigenic drifts during the first wave of this pandemic influenza as all of these viruses are mixed altogether.
Our limited studies on H5 and H7 avian influenza viruses suggested the temporal model is not needed for avian influenza viruses. However, extensive studies are required to investigate whether there is any special data structure present in this type of data.
Conclusion
In this study, we described in details the concepts and applications of new computational method, temporal MC-MDS for influenza antigenic cartography construction. We formulate the influenza cartography as two integrative steps: low rank MC problem from the concept of Netflix movie recommendation system and MDS from geographic cartography construction. In order to handle two additional challenges, including low reactor and non random distribution of antigenic data, a temporal model is incorporated into MC-MDS as temporal MC-MDS. Our applications demonstrated that temporal MC-MDS is effective in constructing influenza antigenic cartography.
Acknowledgments
We are grateful to Liping Long for her assistance in map generation. This project was supported by NIH NIAID 1RC1AI086830. CZ is supported partially by Canadian NSERC postdoc fellowship.
References
- 1.Cai Z, Zhang T, Wan XF. A computational framework for influenza antigenic cartography. PLoS Comput Biol. 2010;6:e1000949. doi: 10.1371/journal.pcbi.1000949. [DOI] [PMC free article] [PubMed] [Google Scholar]
- 2.Smith D, Lapedes A, Jong J, et al. Mapping the antigenic and genetic evolution of influenza virus. Science. 2004;35:371–376. doi: 10.1126/science.1097211. [DOI] [PubMed] [Google Scholar]
- 3.ACM SIGKDD and Netflix. Proc of KDD Cup and Workshop. 2007. [Google Scholar]
- 4.Koren Y, Bell R, Volinsky C. Matrix factorization techniques for recommender systems. Computer. 2009;42:8. [Google Scholar]
- 5.Candes E, Rect . Technical Report. 2008. Exact matrix completion via convex optimization. [Google Scholar]
- 6.Cai J, Candes E, Shen Z. Technical Report. 2008. A singular value thresholding algorithm for matrix completion. [Google Scholar]
- 7.Keshavan R, Oh S, Montanari A. Technical Report. 2009. Matrix completion from a few entries. [Google Scholar]
- 8.Oliveira G. Matrices with prescribed entries and eigenvalues. Proc Amer Math Soc. 1973;37:380–386. [Google Scholar]
- 9.Jahrer M, Töscher A, Legenstein R. Combining predictions for accurate recommender systems. Proc of 16th KDD. 2010;10:693–702. [Google Scholar]
- 10.Koren Y. Technical Report. 2009. The BellKor solution to the Netflix Grand. Prize. [Google Scholar]
- 11.Piotte M, Chabbert M. Technical Report. 2009. The Pragmatic theory solution to the Netix Grand Prize. [Google Scholar]
- 12.Sill J, Takacs G, Mackey L, et al. Technical Report. 2009. Feature-weighted linear stacking. [Google Scholar]
- 13.Oscher AT, Jahrer M, Bell RM. Technical Report. 2009. The BigChaos solution to the Netix Grand Prize. [Google Scholar]