Abstract
Background
Atherosclerotic plaque in the descending thoracic aorta (dAo) is related to altered wall shear stress (WSS) for normal patients. Resection with end-to-end anastomosis (RWEA) is the gold standard for coarctation of the aorta (CoA) repair, but may lead to altered WSS indices that contribute to morbidity.
Methods
Computational fluid dynamics (CFD) models were created from imaging and blood pressure data for control subjects and age- and gender-matched CoA patients treated by RWEA (4 male, 2 female, 15±8 years). CFD analysis incorporated downstream vascular resistance and compliance to generate blood flow velocity, time-averaged WSS (TAWSS) and oscillatory shear index (OSI) results. These indices were quantified longitudinally and circumferentially in the dAo, and several visualization methods were used to highlight regions of potential hemodynamic susceptibility.
Results
The total dAo area exposed to subnormal TAWSS and OSI was similar between groups, but several statistically significant local differences were revealed. Control subjects experienced left-handed rotating patterns of TAWSS and OSI down the dAo. TAWSS was elevated in CoA patients near the site of residual narrowings and OSI was elevated distally, particularly along the left dAo wall. Differences in WSS indices between groups were negligible more than 5 dAo diameters distal to the aortic arch.
Conclusions
Localized differences in WSS indices within the dAo of CoA patients treated by RWEA suggest that plaque may form in unique locations influenced by the surgical repair. These regions can be visualized in familiar and intuitive ways allowing clinicians to track their contribution to morbidity in longitudinal studies.
Introduction
Deleterious hemodynamic alterations influence the onset and progression of atherosclerosis(1), but the ramifications of associated flow disturbances in vessels such as the thoracic aorta where complete blockage is unlikely have not yet been fully elucidated. Clinical findings such as aortic root dilation are associated with altered hemodynamics, and more detailed knowledge is important in order to completely understand thoracic diseases including coarctation of the aorta (CoA). Recently, 4D imaging sequences have been developed and implemented for this purpose and offer intriguing results(2, 3). For example, in a study of healthy young adults(3) areas of low time-averaged wall shear stress (WSS) and elevated oscillatory shear index (OSI) were found in a rotating pattern progressing down the descending aorta (dAo). A study of ten middle-aged adults with pre-existing plaques revealed similar WSS patterns that correlated with areas of atherosclerotic plaque(4). Computational fluid dynamics (CFD) enables detailed spatiotemporal quantification of hemodynamics based on MRI and blood pressure (BP) data. Thus CFD may be used in concert with imaging to determine sites of atherosclerotic susceptibility based on regional and local hemodynamic alterations in longitudinal studies.
CoA patients often suffer from resting or exercise-induced hypertension, early onset coronary artery disease and reduced life expectancy(5). Previous studies have hinted that long-term morbidity in native CoA patients may result from adverse changes in the conduit (i.e. blood flow) and cushioning (ie. aortic capacitance) function of the thoracic aorta(6), but much of this morbidity remains even after surgical or interventional treatment. These findings suggest that preoperative hemodynamics may cause lasting complications, or that treatments may establish suboptimal long-term blood flow distributions. The use of CFD in patients with native or treated CoA(7, 8) has only recently been demonstrated and much remains to be understood. The objective of the current investigation was to characterize normal velocity patterns and indices of WSS in the thoracic aorta of control subjects and contrast these findings with those from a group of age and gender-matched CoA patients treated using resection with end-to-end anastomosis, the gold standard surgical treatment for this condition. Our approach was to quantify these results using a level of detail that has not yet been reported in the literature. Furthermore, we proposed visualization techniques that may improve the translation of this quantitative information to clinicians and researchers in an informative and intuitive fashion.
Methods
Magnetic Resonance Imaging (MRI) and CFD model construction
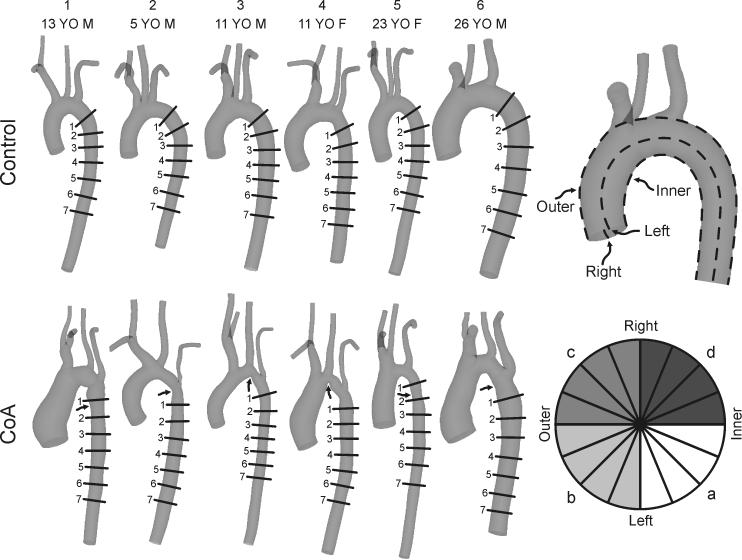
MRI was performed for six patients (4 male, 2 female, 15±8, range 5-26 years) previously treated for CoA by resection with end-to-end or extended end-to-end anastomosis as well as for six age and gender-matched control subjects. Scans were conducted after IRB approval as part of clinically ordered imaging sessions (CoA) or ongoing research scans (control). Prior to protocol enrollment, verbal and written information was provided and informed consent or assent was obtained from participants or their parents/guardians. Gadolinium-enhanced magnetic resonance angiography (MRA) and phase contrast MRI (PC-MRI) were used to delineate vascular morphology(9, 10) and calculate time-resolved volumetric blood flow(9) as described elsewhere(7). Upper and lower extremity BPs were measured after each study using an automated sphygmometer cuff with participants in the supine position. BP data was unavailable for two control subjects, but normal values based on age and gender were obtained from literature(11). MRA data was processed for gradient nonlinearities(12) before CFD models were created (Figure 1) using the SimVascular software package (https://simtk.org)(10) and discretized using MeshSim (Simmetrix, Clifton Park, NY).
Figure 1.
Schematic illustration of the orthogonal locations along the descending thoracic aorta where circumferential TAWSS and OSI plots were quantified in each of the six control subjects (top row) and ageand gender-matched coarctation patients treated by resection with end-to-end anastomosis (bottom row). The relative size of models shown has been adjusted to appreciate differences between groups and individual patients. Arrows identify the location of residual narrowing for each CoA patient. The top right image shows the convention used to define luminal surfaces by their outer or inner curvatures, and anatomic left or right sides. The bottom right image provides a key for the division of circumferential TAWSS and OSI plots into 16 equal sectors, where a = anatomic inner left curvature, b = anatomic outer left curvature, c = anatomic outer right curvature, d = anatomic inner right curvature.
Specification of boundary conditions
Ascending aorta (AscAo) PC-MRI waveforms were mapped to the inlet face of corresponding CFD models using a temporally varying parabolic flow profile. Flow waveforms obtained from the innominate (IA), right and left carotid (RCA,LCA) and subclavian arteries (LSA) and dAo were used with measured BP data to prescribe outflow boundary conditions as discussed below. PC-MRI data was unavailable for three control subjects. Resting cardiac output for these patients was determined from BSA and an assumed normal cardiac index of 3.5 L/min/m2. The resting inflow waveform contour was obtained by ensemble averaging PC-MRI waveforms measured in healthy children(13) and scaling to BSA(14), while flow to branches was estimated from a known relationship between their diameter and AscAo flow(15).
To replicate the physiologic effect of arterial networks distal to CFD model branches, three-element Windkessel model(16) outlet boundary conditions were imposed using a coupled-multidomain method(17, 18). This method provides a simple and intuitive representation of the arterial tree beyond model outlets and can be described by three parameters with physiologic meaning: characteristic (i.e. regional) resistance (Rc), arterial capacitance (C) and distal resistance (Rd). The total arterial capacitance (TAC) for each patient was determined from inflow and BP measurements assuming a characteristic-to-total resistance ratio of 6%(19). The TAC was then distributed among outlets according to their blood flow distributions(20). Once the capacitance terms for each branch were assigned, the terminal resistance (Rt) was calculated from mean BP and flow and distributed between the characteristic and distal resistance parameters by adjusting Rc:Rt ratios (6-10%) to replicate measured BP using the pulse pressure method(21, 22).
CFD simulations
Simulations were performed using a novel stabilized finite element method to solve equations for the conservation of mass (continuity) and balance of momentum of an incompressible fluid (Navier-Stokes)(18). Meshes contained ~3 million tetrahedral elements and localized refinement was performed using an adaptive technique(23, 24) to deposit more elements in regions prone to flow disruption(24). Simulations were run for 4-6 cardiac cycles until the flow rate and BP fields yielded periodic solutions.
Results for blood flow velocity, BP and WSS were visualized using SimVascular and ParaView (Kitware, Inc., Clifton Park, New York)(14). WSS results were analyzed by examining time-averaged WSS (TAWSS) and OSI values as previously described (14). Mean TAWSS and OSI values in the dAo at the level of the diaphragm across all control subjects were considered to determine threshold values for quantifying areas of potentially low TAWSS (<15 dyn/cm2) or high OSI (>0.15). This region was used as it is unlikely to be impacted by diseases of the thoracic aorta. Values for WSS indices were also extracted longitudinally along the inner and outer curvatures of the thoracic aorta as well as along its anatomic right, and left sides (Figure 1, top right). A previous study demonstrated that indices of WSS are influenced by aortic valve morphology in the AscAo, but this impact is minimal beyond the transverse arch (TA)(25). Therefore, circumferential values were similarly extracted distal to the LSA at fixed intervals (multiples of the dAo outlet diameter). Circumferential results at each location were divided into 16 sectors of equal size and values within each sector were averaged (Figure 1, bottom right). The spatial locations where circumferential values were obtained for each CFD model are depicted in Figure 1. Data are expressed as mean ± standard error of the mean (SEM). Values were compared between groups using student's t-test and a P-value <0.05 was considered statistically significant.
Results
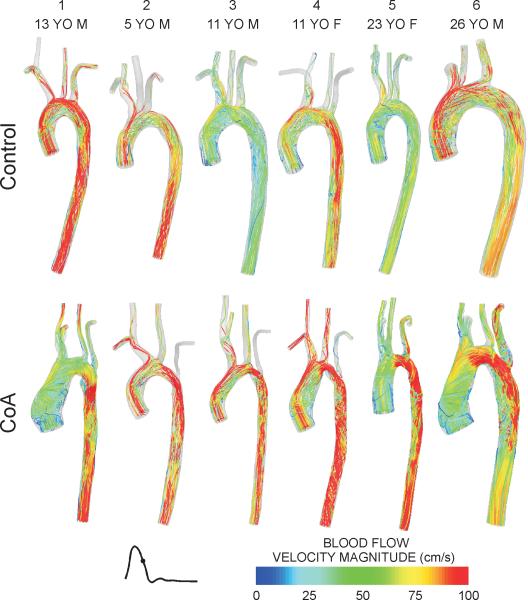
During early systole, velocity streamlines for control subjects are fully attached to the vessel wall with values of 40-80 cm/s in the center of the AscAo. Once entering the TA, velocity profiles become skewed toward the inner wall and reveal smooth laminar flow from the aorta to the head and neck vessels (supplement Fig S1). CoA patients also have skewing of velocity toward the inner wall during early systole, but regions of elevated velocity (>100 cm/sec) were observed in the TA and in areas of residual narrowing near the coarctation repair for patients 2-6. Several CoA patients also exhibited vortices near the TA and/or in the vicinity of the end-toend correction. Streamlines for control and CoA patients during mid-to-late systole shown in Figure 2 are consistent with the second of three time points illustrated by Kilner et al. in their description of blood flow patterns in the thoracic aorta(26). In most control subjects, CFD results show skewing of velocity along the outer curvature and the development of right-handed helical flow with elevated velocity (>100 cm/s) near the center of the arch. The dAo contains primarily forward-directed velocity with the development of left-handed rotation as it progresses distally (Figure 2, top row). Conversely, residual or recurrent narrowings within the TA or coarctation regions of CoA patients caused acceleration of blood that frequently impinged on the posterior wall of the dAo and led to more erratic downstream flow patterns before becoming longitudinally-oriented in some patients (e.g. 5 and 6). At end systole, velocity streamlines primarily show swirling and rotational flow throughout the aorta of both control subjects and CoA patients (supplement Fig S2).
Figure 2.
Blood flow velocity streamlines during mid-to-late systole for the six control subjects (top row) and age- and gender-matched coarctation patients treated by resection with end-to-end anastomosis (bottom row). Related images of blood flow velocity streamlines during early and late systole can be found in the online data supplement.
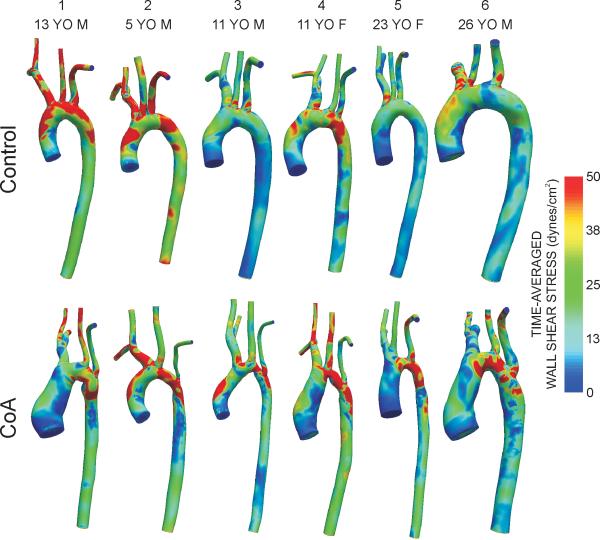
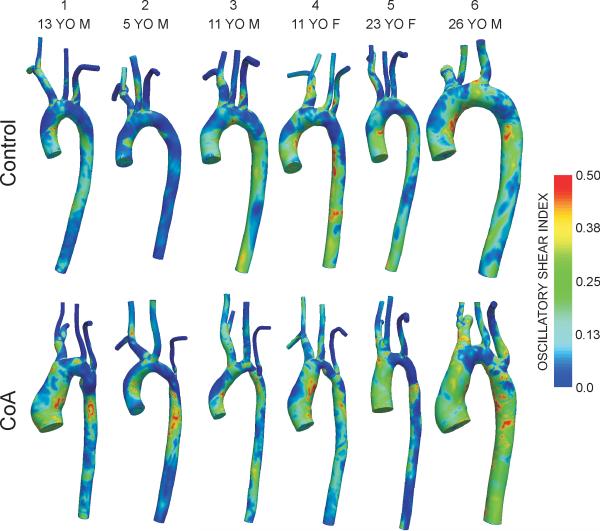
Figures 3 and 4 show spatial distributions of TAWSS and OSI, respectively. In control patients, elevated TAWSS (>50 dyn/cm2) was generally observed just distal to the ostium of the head and neck vessels and lower TAWSS (<15 dyn/cm2) was localized on the inner luminal surface of the thoracic aorta. Regions near the repair site for CoA patients had higher TAWSS values followed by low TAWSS values downstream within the dAo. Areas of OSI >0.15 reflective of flow separation were confined to the inner luminal surface of the dAo for control subjects, particularly near the region of the ductal ampulla where right-handed helical flow is known to transition into left-handed, longitudinally-directed flow(26). Conversely, sites of potentially deleterious high OSI are observed slightly downstream of the surgical repair sites for CoA.
Figure 3.
Distributions of time-averaged wall shear stress for the six control subjects (top row) and age- and gender-matched coarctation patients treated by resection with end-to-end anastomosis (bottom row).
Figure 4.
Distributions of oscillatory shear index for the six control subjects (top row) and age- and gender-matched coarctation patients treated by resection with end-to-end anastomosis (bottom row).
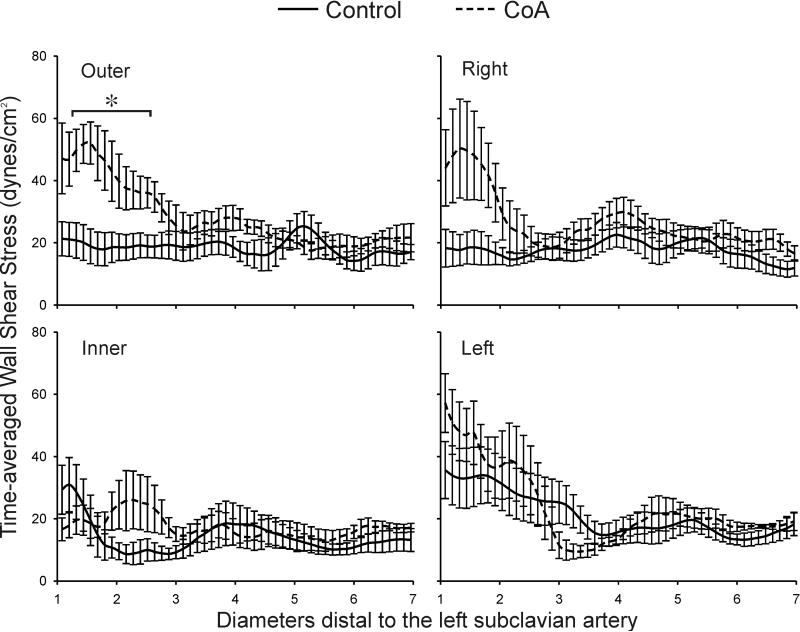
Differences in the total area of the dAo exposed to low TAWSS or elevated OSI in the dAo were not statistically significantly between groups (TAWSS: control=54±17% vs CoA=36±9%; OSI: control=30±7% vs CoA=29±12%). However, longitudinal plots of TAWSS and OSI 1 to 7 diameters downstream of the LSA in Figures 5 and 6 reveal several regional differences. In control subjects, TAWSS was ~35 dyn/cm2 along the inner and left luminal surfaces 1-2 dAo diameters distal to the LSA before decreasing to what appears to be a preferential TAWSS value of 15-20 dyn/cm2 in the dAo. For treated CoA patients, longitudinal distributions of TAWSS were significantly elevated along the outer luminal surface 1-2.5 dAo diameters distal to the LSA (eg. 1.5 dAo diameters beyond the LSA - CoA=52.1±6.8 vs control=18.9±5.6 dyn/cm2). TAWSS values were also generally elevated in CoA patients, regardless of lumen surface (e.g. left, outer, etc), near two dAo diameters distal to the LSA, which corresponds to sites of residual or recurrent narrowing. TAWSS values for both control and CoA patients oscillated near the preferential value mentioned above beyond three dAo diameters downstream of the LSA, but longitudinal differences were not statistically different between groups.
Figure 5.
Ensemble-averaged longitudinal TAWSS plots comparing the six control subjects (solid lines) and age- and gender-matched coarctation patients treated by resection with end-to-end anastomosis (dashed lines) along the outer, anatomic right, anatomic left, and inner curvatures. * Statistically different from control subjects (P < 0.05). Data are expressed as mean ± SEM.
Figure 6.
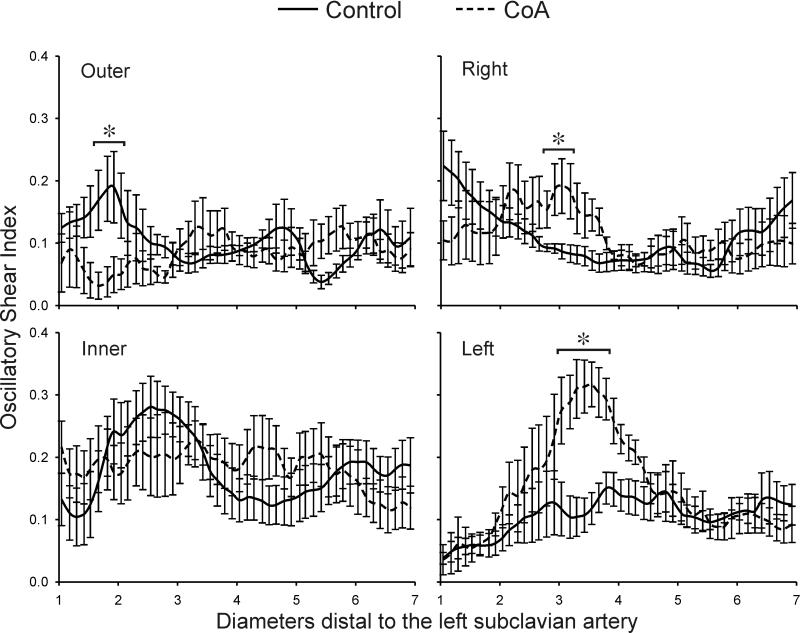
Ensemble-averaged longitudinal OSI plots comparing the six control subjects (solid lines) and ageand gender-matched coarctation patients treated by resection with end-to-end anastomosis (dashed lines) along the outer, anatomic right, anatomic left, and inner curvatures. * Statistically different from control subjects (P < 0.05). Data are expressed as mean ± SEM.
There was a significant reduction in OSI values along the outer surface for CoA patients 1.5-2 dAo diameters distal to the LSA as compared to control patients (Figure 6). Conversely, OSI was significantly increased in the vicinity distal to residual or recurrent narrowings (3-4 dAo diameters) along the right and left luminal surface relative to control patients. OSI was also elevated along the inner surface of both CoA and control patients at this location. In general, patterns of OSI between the inner and outer luminal surfaces had opposing behaviors down the length of the dAo. This was also true for the left and right surfaces; when one side was subject to elevated OSI, the opposite side was experiencing a lower value.
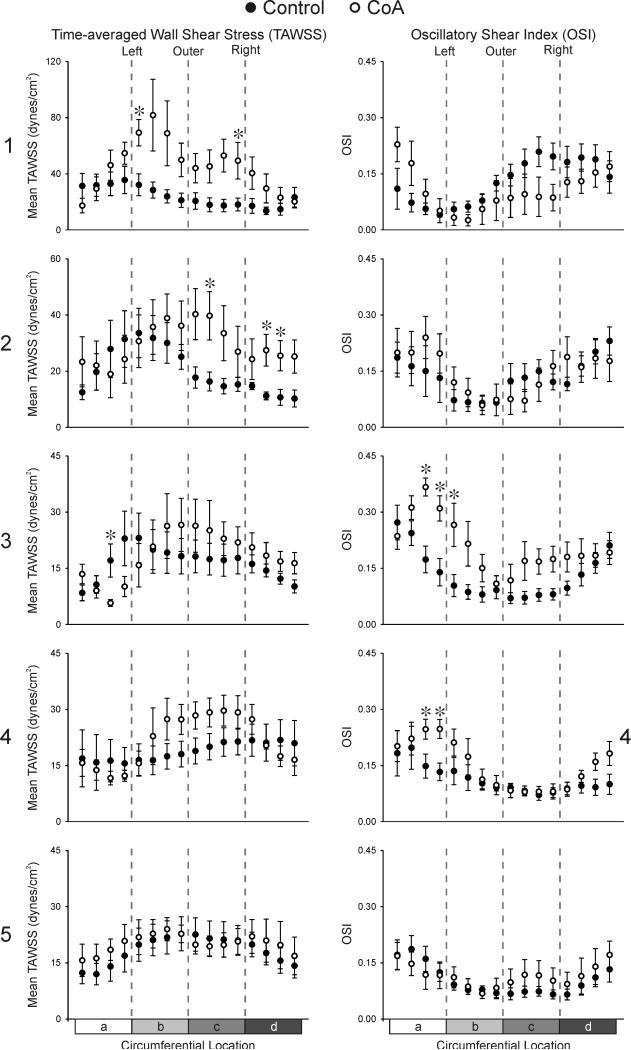
Circumferential distributions of TAWSS and OSI 1-5 diameters distal to the LSA for each experimental group are shown in Figure 7. Consistent with WSS results quantified longitudinally, CoA patients experienced significantly elevated TAWSS at several locations along the outer right and left curvature one dAo diameter distal to the LSA relative to control values. TAWSS remained significantly elevated for CoA patients two dAo diameters beyond the LSA on the outer and inner portions of the anatomic right surface. There were no differences in OSI between groups 1-2 dAo diameters distal to the LSA. Conversely, OSI was statistically elevated along the anatomic left surface for CoA patients 3-4 dAo diameters distal to the LSA. Control subjects demonstrated a shift in the location of their maximum TAWSS values from the inner left (sectors 2-4) to outer left curvature (sectors 4-8) from one to two dAo diameters distal to the LSA. Similarly, maximum OSI values shifted from the outer curvature (sectors 10-12) to the anatomic right curvature (sectors 15-16) at these locations. This shift in WSS indices occurred in a counter-clockwise manner, consistent with the left-handed helical flow quantified in this region as mentioned above, and continued 3 and 4 dAo diameters distal to the LSA. Distributions of TAWSS and OSI five dAo diameters distal to the LSA were similar to those at 4 diameters and there were no differences between groups for either index. Beyond 5 dAo diameters the impact of upstream narrowings in CoA patients had stabilized and changes in WSS indices at these further downstream locations were modest.
Figure 7.
Ensemble-averaged circumferential TAWSS (left column) and OSI (right column) plots comparing the six control subjects (solid circles) and age- and gender-matched coarctation patients treated by resection with end-to-end anastomosis (hollow circles) 1, 2, 3, 4, and 5 diameters distal to the LSA. a = anatomic inner left curvature, b = anatomic outer left curvature, c = anatomic outer right curvature, d = anatomic inner right curvature. * Statistically different from control subjects (P < 0.05). Data are expressed as mean ± SEM. Note the difference in scale for TAWSS 1 and 2 diameters distal to the LSA.
Discussion
The objective of the current investigation was to use patient-specific CFD modeling to elucidate patterns of velocity, TAWSS and OSI in the thoracic aorta of young control subjects and compare these to corresponding post-operative age- and gender-matched CoA patients treated by resection with end-to-end anastomosis. To our knowledge, this is the first study to characterize detailed patterns of WSS and OSI in the thoracic aorta for a cohort of control or CoA patients using CFD. While studies to date have provided important information, they have been limited to a single healthy patient, did not consider flow over the entire cardiac cycle and excluded the impact of the downstream vasculature resulting in potentially nonphysiologic flow or BP distributions.
The primary finding of the current investigation is that the overall area of the dAo subjected to potentially adverse indices of WSS does not seem to differ significantly for CoA patients treated by resection with end-toend anastomosis, but localized differences in the indices as compared to control subjects suggest plaque formation may occur in unique locations that are influenced by the surgical repair. The mechanisms mediating plaque deposition in response to altered indices of WSS are still being elucidated in the human thoracic aorta, but coarctations induced in experimental animal models caused altered WSS and vascular biomechanics responsible for elevated NADPH oxidase and antioxidant enzyme expression which increased reactive oxygen species (ROS)(27). ROS and endothelial dysfunction commonly observed in CoA patients despite treatment(28) are known to be involved in the pathogenesis of atherosclerosis and are associated with concomitant alterations in WSS indices in other vascular beds(29).
The current CFD results are consistent with velocity streamlines presented in recent imaging papers using 4D sequences with control subjects and a sampling of treated CoA patients(2, 30). For example, systolic velocity streamlines presented here for the 13 yo male are strikingly similar to those included in a 2008 report by Hope et al.(30) while the velocity patterns for the collective groups of patients shared trends observed by the same investigators in a report of a larger, more heterogeneous population of CoA patients(2). Similarities between this imaging study and the current CFD investigation include marked alterations in velocity distributions throughout the dAo during systole and vortical flow in the vicinity of treatment. Differences in velocity between control and CoA patients in the current investigation are particularly interesting as Kilner et al. highlighted the continuity and smooth delivery of blood from the TA to arteries of the head and neck in control subjects as a result of axially-oriented flow becoming right-handed helical flow during systole(26). These flow patterns are thought to create elevated local pressure that may influence flow distributions to branch vessels under normal conditions. Interestingly CoA patients are prone to cerebrovascular events and it is possible that alterations in upstream hemodynamics shown here could be related to this finding.
Previous imaging studies quantifying TAWSS in the thoracic aorta of control subjects reported findings consistent with those revealed by our CFD analysis when correcting for flow distributions to intercostal arteries and differences in viscosity values used in the calculation of TAWSS. The helical flow patterns seen in the current study were also observed by Wentzel et al.(4) in their study of WSS in the human thoracic aorta using PC-MRI. A recent CFD study using MRI data from a single patient and steady representation of average flow over the cardiac cycle as input to the model demonstrated that aortic arch torsion, as compared to a straight dAo segment, is important for improved oxygen flux to the arterial wall(31). Interestingly, the authors’ index for swirling or helical flow peaked near the proximal portion of the dAo, depended on dAo taper, and was reduced to zero beyond sites corresponding to ~5 dAo diameters distal to the LSA in the current study. A previous study by Frydrychowicz et al. also used 3D MRI to investigate blood flow patterns in the thoracic aorta of surgically repaired coarctation patients(3). However, WSS values included in this previous report were determined from velocity values obtained during imaging and the proximity of measured near-wall velocity vectors to the luminal surface have a large impact on the reported values. Results from the current investigation suggest that the inner curvature of the luminal surface within the TA may be most susceptible to adverse indices of WSS (TAWSS and OSI) in control subjects and that this region of susceptibility proceeds in a left-handed manner from 1 to 5 diameters distal to the LSA until both indices are relatively uniform along the circumference of the vessel. Regions of elevated velocity in locations of residual narrowing corresponded to significantly higher TAWSS in the CoA patient group at 1 and 2 diameters distal to the LSA. This difference was followed by regions of flow separation at 3 and 4 diameters downstream.
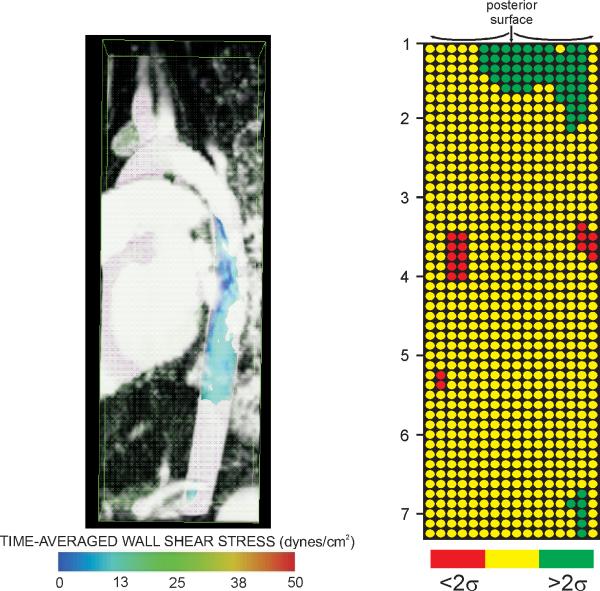
CFD offers great promise for the field of congenital cardiac surgery and intervention. If specific physiological and structural outcomes are related to adverse hemodynamics, restoring more favorable patterns that improve local blood flow velocities and indices of WSS could be used to design optimal surgical reconstructions and may facilitate prediction or insight into patient outcomes. This approach has been successfully applied to other congenital heart defects, specifically malformations resulting in a single functioning ventricle. CFD simulations of the Fontan procedure has led to several technical modifications demonstrated to be hemodynamically superior to previous surgical techniques. Figure 8 offers examples of how results from the current investigation can be conveyed within a clinical environment to track regions of hemodynamic susceptibility in longitudinal studies. For example, values of TAWSS below a defined threshold (15 dyn/cm2) for the 5 yo male treated for CoA were isolated and expressed within a Visualization ToolKit (vtk) file for simultaneous viewing with the MRA data (Figure 8, left). Numerous pediatric centers, including the two involved in the current investigation, frequently present patient history with corresponding catheterization and imaging data for scheduled procedures during weekly clinical conferences. Using the methods presented here, subnormal TAWSS values (or other hemodynamic indices) at spatially localized regions of the vasculature can be simultaneously viewed with morphologic imaging data to determine how these regions of potentially adverse hemodynamics change over time and coincide with disease. Imaging data is routinely used in longitudinal studies of vascular pathology and isolating regions of potential concern from CFD could provide additional clinically useful information. As a second example, TAWSS values for this patient were also displayed similar to gene chip results for each of the 16 sectors and longitudinal locations distal to the LSA discussed above (Figure 8, right). TAWSS values two standard deviations greater or smaller than values at spatially equivalent locations determined from the collective group of control subjects are expressed as green and red circles, respectively. Presenting results in this way allows for rapid detection of values beyond some statistical limit (in this case two standard deviations). The template to which CoA patients are compared will obviously be improved as additional patients are studied and could also be isolated for patients within subcategories such as age, gender or treatment approach. Future studies using these or other methods will ultimately determine the impact and extent that any altered local indices has on outcomes for patients with CoA.
Figure 8.
Examples of how results from the current investigation can be conveyed within a clinical environment to track regions of hemodynamic susceptibility in longitudinal studies. Values of TAWSS below a preferential threshold can be viewed simultaneously with morphologic imaging data such as that from magnetic resonance angiography as shown in the image on the left. Hemodynamic indices such as TAWSS can also be further averaged over smaller circumferential and longitudinal locations and displayed similar to gene chip results. The image on the right indicates which of the 16 sectors and longitudinal locations distal to the LSA from the simulation of a 5 yo male treated for CoA by resection with end-to-end anastomosis contain TAWSS values two standard deviations above (green circles) or below (red circles) values at spatially equivalent locations determined from the collective group of control subjects.
The current results should be interpreted with the constraints of several potential limitations. Temporal changes in the AscAo inflow velocity profile due to valve morphology were not incorporated into the CFD models. Consequently indices of WSS were only quantified in the dAo where the influence of aortic valve morphology is modest(25). Sample sizes for each group were small due to the scarcity and heterogeneity of CoA patients at a given institution. Thus, findings reported here should be verified for additional CoA patients over an expanded age range. CoA patients and controls were not matched for other factors such as lipid and inflammatory status. A constant viscosity was used for all patients. Although the global shear rate in the thoracic aorta is well within the Newtonian region of the shear thinning curve for whole blood, regions within the CFD models containing low shear rates may be within the portion of the curve where a non-Newtonian fluid assumption would provide more realistic local WSS results. Simulations were performed using a rigid wall assumption since detailed material properties were not available. We have previously shown that cyclic strain may be reduced in treated CoA as compared to control patients(7). Therefore, incorporating vessel compliance(32) could provide more realistic values for indices of WSS when compared to those presented here. While the total dAo area exposed to subnormal TAWSS was not statistically different between groups, the percentage of the dAo exposed to low TAWSS was larger for control patients due to the contribution of the higher values surrounding the coarctation region of treated CoA patients.
In summary, results from the current investigation confirm and extend those from previous imaging reports by quantifying and characterizing the impact of altered blood flow patterns on indices of WSS thought to contribute to long-term morbidity for cohorts of control patients and those undergoing the most common surgical treatment for CoA.
Supplementary Material
Acknowledgments
The authors gratefully acknowledge Mary Krolikowski RN, MSN and Drs. Nathan Wilson, Mary Draney and Hyun Jin Kim for technical assistance.
Sources of funding: This work was supported by a Dean's Postdoctoral Fellowship (to JFL), the Vera Moulton Wall Center for Pulmonary Vascular Disease at the Stanford University School of Medicine, and awards from the NSF (Grant No. 0205741 to CAT) and NIH (R15HL096096-01 to JFL).
Footnotes
Disclosures that pose a conflict of interest in connection with the current article: None
Author Contributions
John F. LaDisa, Jr. PhD - concept/design, methodological developments, data collection, data analysis/interpretation, drafting article, funding, approval of article
Ronak J. Dholakia MS - data collection, data analysis/interpretation, statistical analysis, approval of article
C. Alberto Figueroa PhD - concept/design, technical and methodological developments, data analysis/interpretation, critical revision of article, approval of article
Irene E. Vignon-Clementel PhD - technical and methodological developments, data analysis/interpretation, approval of article
Frandics P. Chan MD, PhD - technical and methodological developments, data collection, approval of article
Margaret M. Samyn MD, FACC - data collection, critical revision of article, approval of article
Joseph R. Cava MD, PhD - data collection, approval of article
Charles A. Taylor PhD - concept/design, technical and methodological developments, data analysis/interpretation, funding, approval of article
Jeffrey A. Feinstein MD, MPH - concept/design, technical and methodological developments, data analysis/interpretation, critical revision of article, funding, approval of article
References
- 1.Ku DN, Giddens DP, Zarins CK, Glagov S. Pulsatile flow and atherosclerosis in the human carotid bifurcation. Positive correlation between plaque location and low oscillating shear stress. Arteriosclerosis. 1985;5(3):293–302. doi: 10.1161/01.atv.5.3.293. [DOI] [PubMed] [Google Scholar]
- 2.Hope MD, Meadows AK, Hope TA, Ordovas KG, Saloner D, Reddy GP, et al. Clinical evaluation of aortic coarctation with 4D flow MR imaging. J Magn Reson Imaging. 2010 Mar;31(3):711–8. doi: 10.1002/jmri.22083. [DOI] [PubMed] [Google Scholar]
- 3.Frydrychowicz A, Stalder AF, Russe MF, Bock J, Bauer S, Harloff A, et al. Three-dimensional analysis of segmental wall shear stress in the aorta by flow-sensitive four-dimensional-MRI. J Magn Reson Imaging. 2009 Jul;30(1):77–84. doi: 10.1002/jmri.21790. [DOI] [PubMed] [Google Scholar]
- 4.Wentzel JJ, Corti R, Fayad ZA, Wisdom P, Macaluso F, Winkelman MO, et al. Does shear stress modulate both plaque progression and regression in the thoracic aorta? Human study using serial magnetic resonance imaging. J Am Coll Cardiol. 2005 Mar 15;45(6):846–54. doi: 10.1016/j.jacc.2004.12.026. [DOI] [PubMed] [Google Scholar]
- 5.Bouchart F, Dubar A, Tabley A, Litzler PY, Haas-Hubscher C, Redonnet M, et al. Coarctation of the aorta in adults: surgical results and long-term follow-up. Ann Thorac Surg. 2000;70(5):1483–8. doi: 10.1016/s0003-4975(00)01999-8. [DOI] [PubMed] [Google Scholar]
- 6.O'Rourke MF, Cartmill TB. Influence of aortic coarctation on pulsatle hemodynamics in the proximal aorta. Circulation. 1971;44(2):281–92. doi: 10.1161/01.cir.44.2.281. [DOI] [PubMed] [Google Scholar]
- 7.LaDisa JF, Jr., Figueroa CA, Vignon-Clementel IE, Kim HJ, Xiao N, Ellwein LM, et al. Patient-specific computational fluid dynamics simulations of aortic coarctation for improved physiologic understanding and treatment optimization. J. Biomech. Eng. doi:10.1115/1.4004996. [Epub ahead of print] [Google Scholar]
- 8.LaDisa JF, Jr., Taylor CA, Feinstein JA. Aortic Coarctation: Recent Developments in Experimental and Computational Methods to Assess Treatments for This Simple Condition. Prog Pediatr Cardiol. 2010 Dec 1;30(1):45–9. doi: 10.1016/j.ppedcard.2010.09.006. [DOI] [PMC free article] [PubMed] [Google Scholar]
- 9.Les AS, Shadden SC, Figueroa CA, Park JM, Tedesco MM, Herfkens RJ, et al. Quantification of hemodynamics in abdominal aortic aneurysms during rest and exercise using magnetic resonance imaging and computational fluid dynamics. Ann Biomed Eng. 2010 Apr;38(4):1288–313. doi: 10.1007/s10439-010-9949-x. [DOI] [PMC free article] [PubMed] [Google Scholar]
- 10.Wilson N, Wang K, Dutton R, Taylor CA. A software framework for creating patient specific geometric models from medical imaging data for simulation based medical planning of vascular surgery. Lect Notes Comput Sci. 2001;2208:449–56. [Google Scholar]
- 11.Drizd T, Dannenberg AL, Engel A. Blood pressure levels in persons 18-74 years of age in 1976-80, and trends in blood pressure from 1960 to 1980 in the United States. Vital Health Stat 11. 1986 Jul;(234):1–68. [PubMed] [Google Scholar]
- 12.Draney MT, Alley MA, Tang BT, Wilson NM, Herfkens RJ, Taylor CA, editors. Importance of 3D nonlinear gradient corrections for quantitative analysis of 3D MR angiographic data. International Society for Magnetic Resonance in Medicine; Honolulu, HI: 2002. [Google Scholar]
- 13.Cheng CP, Herfkens RJ, Lightner AL, Taylor CA, Feinstein JA. Blood flow conditions in the proximal pulmonary arteries and vena cavae in healthy children during upright seated rest and cycling exercise, quantified with MRI. Am J Physiol Heart Circ Physiol. 2004;287(2):H921–6. doi: 10.1152/ajpheart.00022.2004. [DOI] [PubMed] [Google Scholar]
- 14.Tang BT, Cheng CP, Draney MT, Wilson NM, Tsao PS, Herfkens RJ, et al. Abdominal aortic hemodynamics in young healthy adults at rest and during lower limb exercise: quantification using image-based computer modeling. Am J Physiol Heart Circ Physiol. 2006 Aug;291(2):H668–76. doi: 10.1152/ajpheart.01301.2005. [DOI] [PubMed] [Google Scholar]
- 15.Zamir M, Sinclair P, Wonnacott TH. Relation between diameter and flow in major branches of the arch of the aorta. J Biomech. 1992 Nov;25(11):1303–10. doi: 10.1016/0021-9290(92)90285-9. [DOI] [PubMed] [Google Scholar]
- 16.Westerhof N, Stergiopulos N, Noble MIM. Snapshots of hemodynamics an aid for clinical research and graduate education. Springer; New York: 2005. [Google Scholar]
- 17.Vignon-Clementel IE, Figueroa CA, Jansen KE, Taylor CA. Outflow boundary conditions for 3D simulations of non-periodic blood flow and pressure fields in deformable arteries. Comput Methods Biomech Biomed Engin. 2010;13(5):625–40. doi: 10.1080/10255840903413565. [DOI] [PubMed] [Google Scholar]
- 18.Vignon-Clementel IE, Figueroa CA, Jansen KE, Taylor CA. Outflow boundary conditions for three-dimensional finite element modeling of blood flow and pressure in arteries. Comput Methods Appl Mech Eng. 2006;195:3776–96. [Google Scholar]
- 19.Laskey WK, Parker HG, Ferrari VA, Kussmaul WG, Noordergraaf A. Estimation of total systemic arterial compliance in humans. J Appl Physiol. 1990 Jul;69(1):112–9. doi: 10.1152/jappl.1990.69.1.112. [DOI] [PubMed] [Google Scholar]
- 20.Stergiopulos N, Young DF, Rogge TR. Computer simulation of arterial flow with applications to arterial and aortic stenoses. J Biomech. 1992 Dec;25(12):1477–88. doi: 10.1016/0021-9290(92)90060-e. [DOI] [PubMed] [Google Scholar]
- 21.O'Rourke MF, Safar ME. Relationship between aortic stiffening and microvascular disease in brain and kidney: cause and logic of therapy. Hypertension. 2005 Jul;46(1):200–4. doi: 10.1161/01.HYP.0000168052.00426.65. [DOI] [PubMed] [Google Scholar]
- 22.Stergiopulos N, Segers P, Westerhof N. Use of pulse pressure method for estimating total arterial compliance in vivo. Am J Physiol Heart Circ Physiol. 1999;276(45):H424–8. doi: 10.1152/ajpheart.1999.276.2.H424. [DOI] [PubMed] [Google Scholar]
- 23.Sahni O, Muller J, Jansen KE, Shephard MS, Taylor CA. Efficient anisotropic adaptive discretization of the cardiovascular system. Comput Methods Biomech Biomed Engin. 2006;195:5634–55. [Google Scholar]
- 24.Muller J, Sahni O, Li X, Jansen KE, Shephard MS, Taylor CA. Anisotropic adaptive finite element method for modelling blood flow. Comput Methods Biomech Biomed Engin. 2005 Oct;8(5):295–305. doi: 10.1080/10255840500264742. [DOI] [PubMed] [Google Scholar]
- 25.Wendell DC, Samyn MM, Cava JR, Ellwein LM, Krolikowski MM, Gandy KL, et al. Incorporating aortic valve morphology into computational fluid dynamics simulations: specific application to patients after treatment for aortic coarctation. 2010. submitted.
- 26.Kilner PJ, Yang GZ, Mohiaddin RH, Firmin DN, Longmore DB. Helical and retrograde secondary flow patterns in the aortic arch studied by three-directional magnetic resonance velocity mapping. Circulation. 1993 Nov;88(5 Pt 1):2235–47. doi: 10.1161/01.cir.88.5.2235. [DOI] [PubMed] [Google Scholar]
- 27.Sindhu RK, Roberts CK, Ehdaie A, Zhan CD, Vaziri ND. Effects of aortic coarctation on aortic antioxidant enzymes and NADPH oxidase protein expression. Life Sci. 2005 Jan 7;76(8):945–53. doi: 10.1016/j.lfs.2004.10.014. [DOI] [PubMed] [Google Scholar]
- 28.Mizia-Stec K, Trojnarska O, Szczepaniak-Chichel L, Gabriel M, Bartczak A, Cieplucha A, et al. Asymmetric dimethylarginine and vascular indices of atherosclerosis in patients after coarctation of aorta repair. Int J Cardiol. 2011 Feb 17; doi: 10.1016/j.ijcard.2011.01.037. doi:10.1016/j.ijcard.2011.01.037. [DOI] [PubMed] [Google Scholar]
- 29.Gross ER, LaDisa JF, Jr., Weihrauch D, Olson LE, Kress TT, Hettrick DA, et al. Reactive oxygen species modulate coronary wall shear stress and endothelial function during hyperglycemia. Am J Physiol - Heart. 2003 May;284(5):H1552–9. doi: 10.1152/ajpheart.01013.2002. [DOI] [PubMed] [Google Scholar]
- 30.Hope MD, Meadows AK, Hope TA, Ordovas KG, Reddy GP, Alley MT, et al. Images in cardiovascular medicine. Evaluation of bicuspid aortic valve and aortic coarctation with 4D flow magnetic resonance imaging. Circulation. 2008 May 27;117(21):2818–9. doi: 10.1161/CIRCULATIONAHA.107.760124. [DOI] [PubMed] [Google Scholar]
- 31.Liu X, Fan Y, Deng X. Effect of spiral flow on the transport of oxygen in the aorta: a numerical study. Ann Biomed Eng. 2010 Mar;38(3):917–26. doi: 10.1007/s10439-009-9878-8. [DOI] [PubMed] [Google Scholar]
- 32.Figueroa CA, Vignon-Clementel IE, Jansen KE, Hughes TJR, Taylor CA. A coupled momentum method for modeling blood flow in three-dimensional deformable arteries. Comput Methods Appl Mech Eng. 2006;195:5685–706. [Google Scholar]
Associated Data
This section collects any data citations, data availability statements, or supplementary materials included in this article.


