

Abstract
Recent studies have shown that nanoscale and submicron topographic cues modulate a menu of fundamental cell behaviors, and the use of topographic cues is an expanding area of study in tissue engineering. We used topographically-patterned substrates containing anisotropically-ordered ridges and grooves to investigate the effects of topographic cues on mesenchymal stem cell morphology, proliferation, and osteogenic differentiation. We found that human mesenchymal stem cells cultured on 1400 or 4000 nm pitches showed greater elongation and alignment relative to 400 nm pitch or planar control. Cells cultured on 400 nm pitch demonstrated significant increases in RUNX2 and BGLAP expression relative to cells cultured on 1400 or 4000 nm pitch or planar control. 400 nm pitch enhanced extracellular calcium deposition. Cells cultured in osteoinductive medium revealed combinatory effects of topography and chemical cues on 400 nm pitch as well as up-regulation of expression of ID1, a target of the BMP pathway. Our data demonstrate that a specific size scale of topographic cue promotes osteogenic differentiation with or without osteogenic agents. These data demonstrate that the integration of topographic cues may be useful for the fabrication of orthopedic implants.
Keywords: mesenchymal stem cells, nanotopographic ridges and grooves, osteogenic differentiation, osteoinductive agents, Bone Morphogenetic Protein (BMP)
1. Introduction
In the United States alone, the annual costs of orthopedic-related injuries are estimated to be between $17–20 billion annually [1]. Many of these costs are associated with complications following adverse events such as skeletal fracture due to traumatic injury or idiopathic or pharmacologically-induced osteoporosis. The frequency of such events is predicted to increase as the population ages [2]. High morbidity and mortality in conjunction with increasing healthcare costs are associated with such fractures [3], resulting in a critical need to enhance skeletal repair.
Bone marrow-derived MSCs [4], as well as adipose-derived MSCs, demonstrate the capacity for adipogenic, osteogenic, and chondrocytic differentiation [5] in response to a variety of stimuli such as exogenous growth factor (e.g., BMP [6]) and biophysical conditions (i.e., micromass pellet versus monolayer expansion [7, 8]). Cell-based therapies involving autologous or allogeneic MSCs have been investigated as options in cases involving orthopedic complications [9]. The success of tissue engineering in skeletal repair is a function of the scaffold, cells, and exogenous signals that are used [10]. Traditionally, osteoinductive agents such as BMP-2 or BMP-7 have been used for promoting stem cells to differentiate along the osteogenic lineage [6], but potential adverse effects and high costs of such agents create a need for novel methods to promote osteogenic differentiation.
Recent findings underscore that submicron and nanoscale topography can control fundamental cell behaviors including proliferation [11, 12], migration [11, 12], and differentiation [13, 14]. It is important to choose an appropriate topographically-patterned substrate to achieve desired cell responses because cell responses vary depending on cell type, topographic feature size and geometry, and substrate compliance [11, 15–17]. Two types of geometries, namely nanopits and nanotubes, have been previously investigated in terms of osteogenic differentiation. Nanopits of randomly placed 50 nm holes separated by 250 nm (i.e. 300 nm pitch) as well as nanotubes (100 nm diameter) enhance osteogenic differentiation of hMSCs [18, 19]. However, responses to other commonly-used geometries [20], including submicron and nanoscale ridges and grooves [16], remain unknown. In addition, the previous investigations of effective feature size were performed on surfaces with feature sizes smaller than 300 nm [18, 19, 21], and further analysis of additional biologically-relevant feature sizes is needed to determine the optimal length scale of topography to promote osteogenic differentiation. Therefore, we focused on surfaces with feature sizes in the range of nanomicron to submicron, as they are biologically relevant but not extensively investigated.
Our hypothesis is that topographic cues in the form of anisotropically ordered ridges and grooves, mimicking biophysical cues provided by collagen fibers, will enhance osteogenic differentiation of MSCs. To optimize the osteogenic differentiation, the effects of feature scale employing dimension values that span the biologically relevant size range of the collagen fibrils (10–300 nm) and fibers (up to several microns) [22] were investigated. Topographic features of ridges and grooves ranging from 200 to 2000 nm (400 to 4000 nm in pitch) were used to identify the ideal length scale for promoting osteogenic differentiation [11, 23]. Osteoinductive effectors were also employed to determine if there was a synergistic or additive effect between soluble signaling molecules and topographic cues..
2. Materials and Methods
2.1. Fabrication of micro- and nanoscale surfaces
Patterned silicon surfaces utilized as master stamps were prepared at the Center for Nanotechnology (University of Wisconsin) as previously described [24, 25]. The grooves on each substrate were 300nm in depth and 400, 1400, or 4000 nm pitch. The ratio of width of a ridge to a groove was 1:1 (Fig 1A). Planar surfaces were used as controls. Polydimethylsiloxane (PDMS) stamps were generated as previously described [11, 16] and were used as templates for replication of the patterns in NOA81 polyurethane (Norland Optical Adhesives, Cranbury, NJ)
Fig 1. Influence of topographic surfaces on cell morphology.
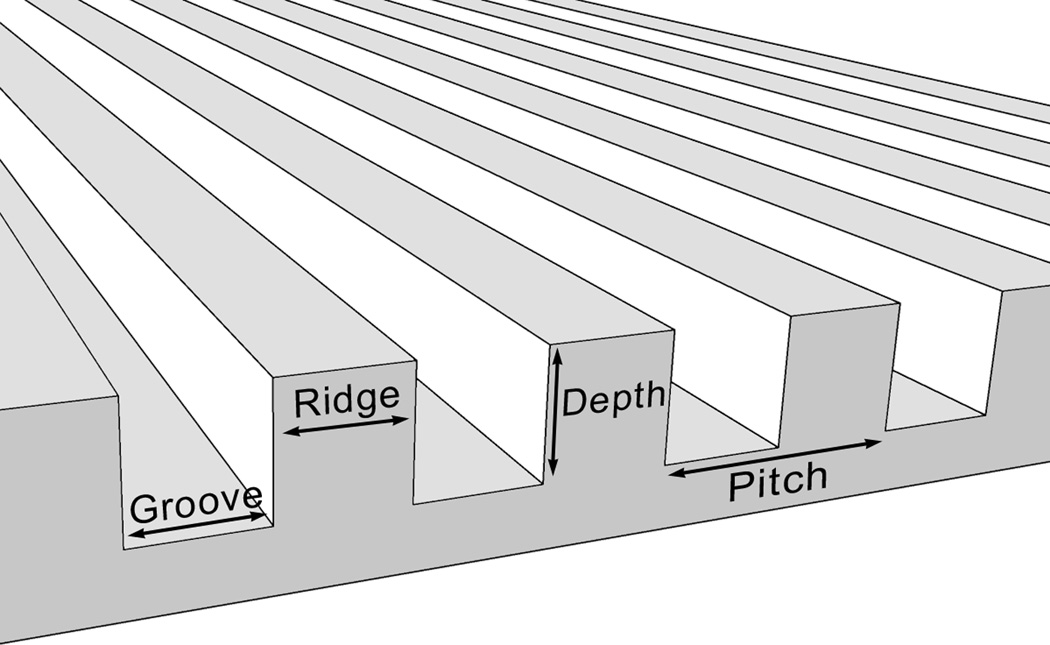
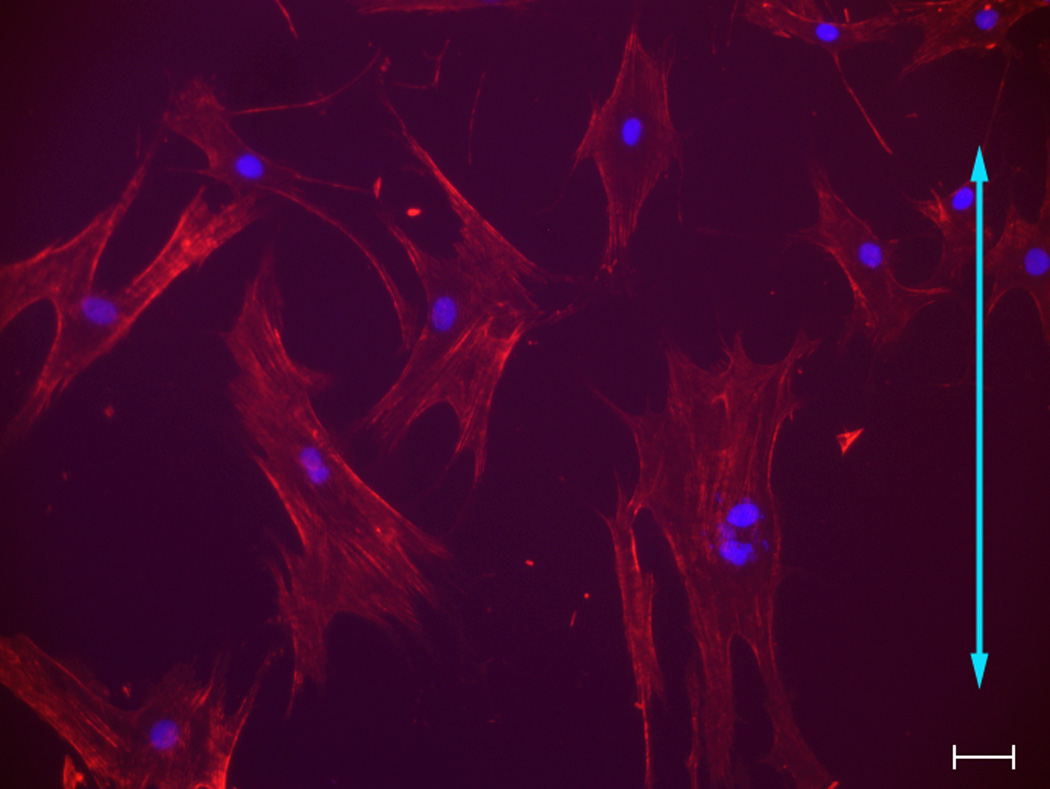
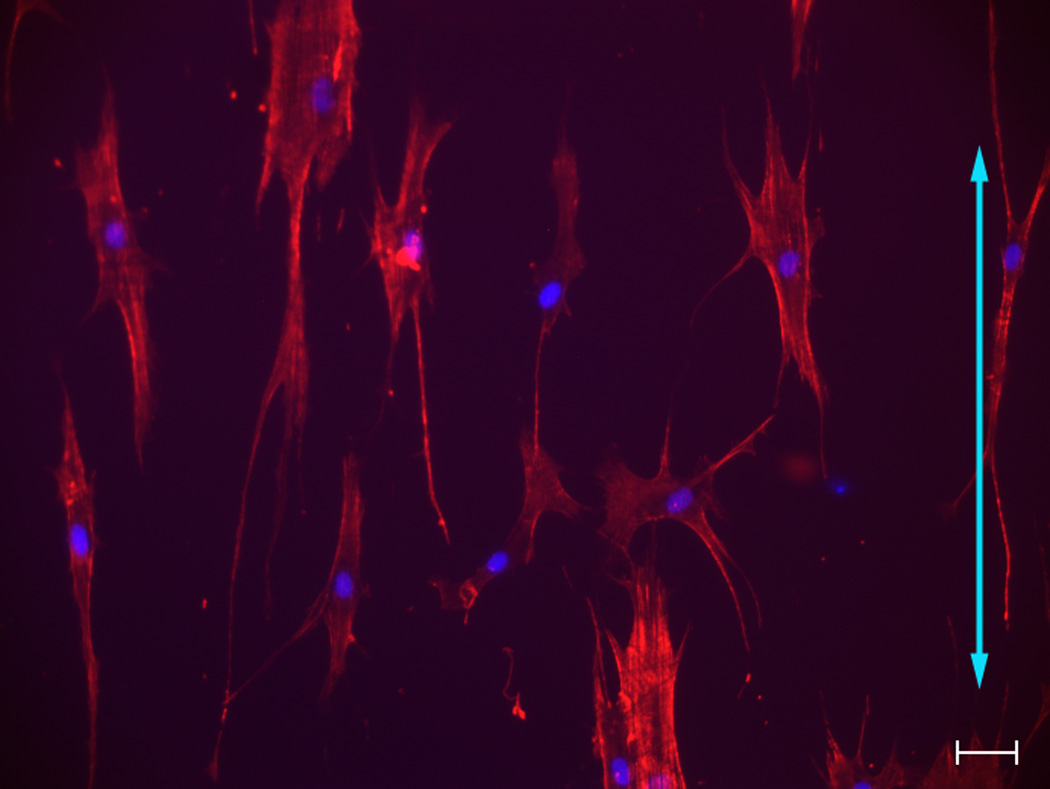
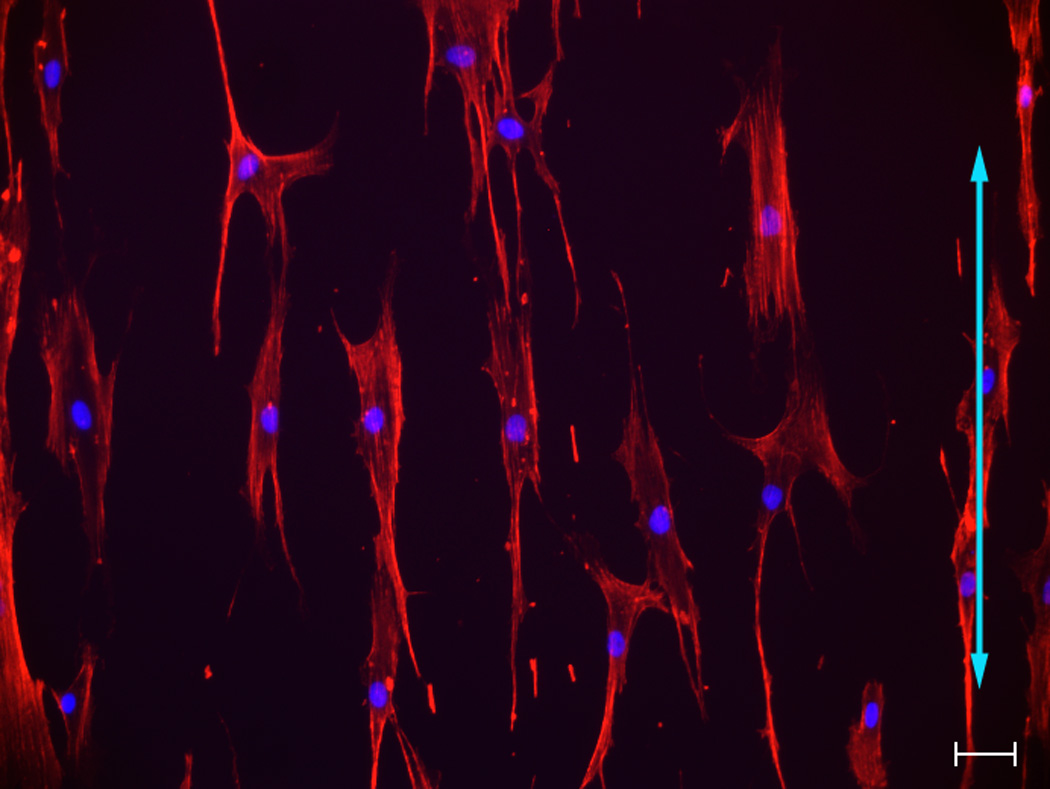
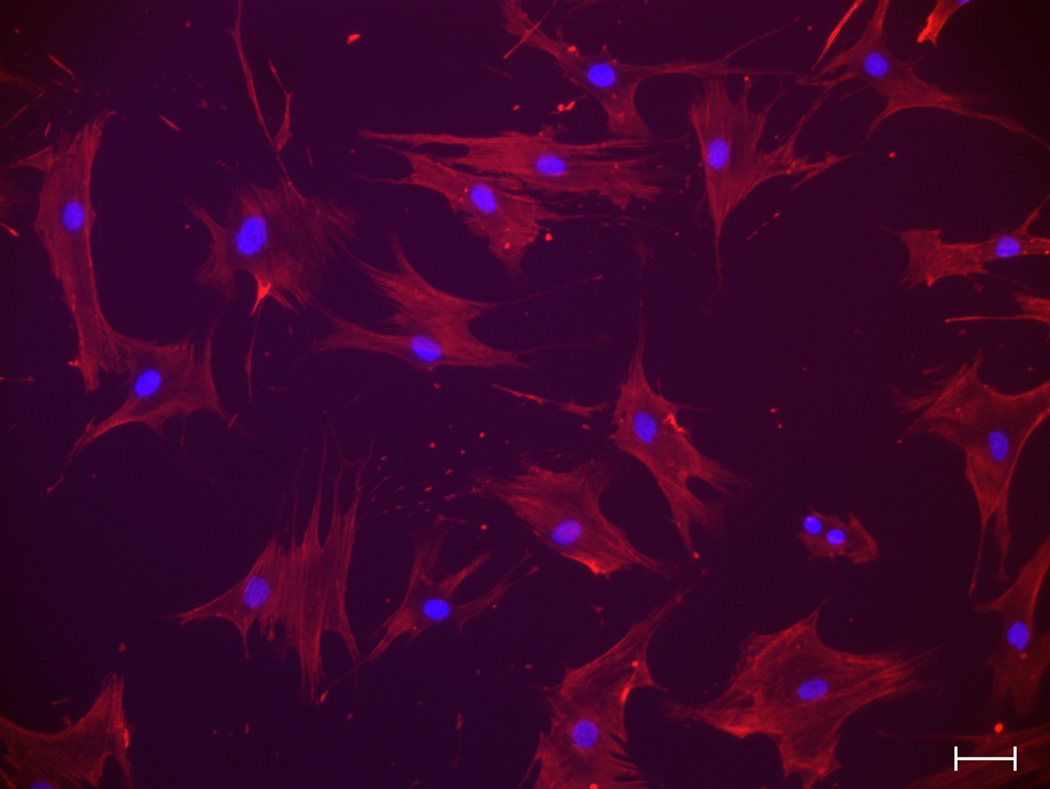
Pitch is defined as the sum of the width of a ridge and a groove as shown on the schematic diagram of a topographic surface (A). The depth for all the topographic surfaces was 300 nm. Representative images of hMSCs were taken with a Zeiss Axiovert 200 M inverted microscope on 400 nm pitch (B), 1400 nm pitch (C), 4000 nm pitch (D) and planar control (E). hMSCs on 400 nm and planar surfaces showed a more rounded and flattened morphology while hMSCs on 1400 and 4000 nm pitch showed an elongated morphology. Each picture was taken at 10 X magnification. Double-headed arrows represent direction of the underlying topography of ridges and grooves. Scale bar: 50 µm.
2.2. Cell culture
Human MSCs were purchased from Lonza (Walkersville, MD); these cells were a priori found positive for MSC markers CD105, CD16, CD29, and CD44, and were negative for markers of hematopoietic lineage, including CD34 and CD45. Cells were maintained in growth medium consisting of Minimum Essential Medium, α-modification (Invitrogen, Carlsbad, CA), supplemented with 10% fetal bovine serum (Invitrogen, Carlsbad, CA) and 1% penicillin/streptomycin (Invitrogen, Carlsbad, CA). Cells were seeded onto the patterned or planar polymeric substrates at 2,000 cells/cm2 and the medium was changed twice weekly. Additionally, hMSCs were grown in osteogenic medium (growth medium supplemented with 5 mM β–glycerolphosphoric acid (VWR International, Randnor, PA) and 50 µg/ml L-ascorbic acid (Waco, Japan). Medium was changed twice weekly. Cells of passage 5–9 were used in the experiments.
2.3. Analysis of cell morphology, area, elongation and alignment
hMSCs were plated at a density of 2,000 cells/cm2; 24 hours later, hMSCs were fixed with 3.7% paraformaldehyde in 1x phosphate-buffered saline (PBS, pH 7.2) for 20 min. Fixed cells were treated with 0.1% Triton X-100 solution for 5 min, followed by 20 min treatment with SuperBlock Blocking Buffer (Themo Scientific, Rockford, IL), and rinsed with PBS. Alexa Flour® 568 phalloidin (Invitrogen, Carlsbad, CA) 10 µg/ml in 10% SuperBlock was added to the plates, and incubated for an hour at room temperature. Plates were rinsed with PBS, and counterstained with DAPI (BioGenex, San Ramon, CA) for 5 min, and imaged at a Zeiss Axiovert 200 M inverted microscope with a motorized stage, a 10X/0.4 NA lens, AxioCam HRm or AxioCam b/w (Carl Zeiss Inc., North America).
Inclusion criteria for the cell area, elongation and alignment factor assays were based on cells that were adherent with no discernable cleavage furrows and had no cell-cell contact with other cells. The perimeters of each cell were traced using AxioVison Release 4.6 (Carl Zeiss Inc., North America). A total of 120–160 cells for a given surface from 2 dishes were analyzed, and the experiment was repeated twice more with cells from later passages. The “Auto Measure” function was used to measure the total area of each traced cell and the aspect ratio (the ratio of the major axis divided by the minor axis of each cell based on a fitted ellipse model) and the specific angle of orientation of cells in relation to the ridges and grooves. Cells were considered aligned to underlying topography of ridges and grooves when this angle was within 10 degrees of being parallel to the ridges. The 95% confidence interval of the aspect ratio of hMSCs on planar surfaces was calculated to determine the base range of the aspect ratio of hMSCs. Cells were considered elongated if it was more than 2.429, the upper bound of the confidence interval.
2.4. Cell adhesion and proliferation assay
hMSCs were plated at a density of 2,000 cells/cm2; 24 hours later, hMSCs were fixed for 15 min in 5% formaldehyde in PBS, followed by 0.1% Triton X-100 solution for 5 min. Nuclei were then stained with DAPI for 5 min, and imaged at a Zeiss Axiovert 200 M inverted microscope with a motorized stage, a 10X/0.4 NA lens, AxioCam HRmor AxioCam b/w. Then, 25 random images were taken from each patterned or unpatterned surface, and total cell number was estimated from 5 randomly-selected images using ImageJ version 1.42q with the cell counter plug-in (NIH, Bethesda, MD). The remaining cultures were allowed to grow in normal or osteogenic medium for 7 days, after which they were fixed and imaged in the same manner. Proliferation rate was calculated by dividing total cell number after 7 days of culture by cell number determined 3 hours after initial seeding.
2.5. Alizarin red S stain and quantification
Cells were grown on patterned and planar surfaces. On days 7, 14 and 21, cells were washed with pre-warmed PBS (37 °C) and fixed for 15 min with 5% formaldehyde solution. After fixing, cells were washed with filtered de-ionized water and incubated with 0.5% Alizarin red S (ARS: Sigma-Aldrich, St. Louis, MO) solution for 30 min. The ARS solution was removed and cells were washed with filtered de-ionized water until the rinse solution was clear. Imaging and quantitative assays were performed after surfaces were air-dried. Following imaging, calcium deposition was quantified as previously described [26]. Briefly, ARS-stained hMSCs were incubated with 10% cetylpyridinium chloride in 10mM sodium phosphate solution, pH 7.0, for an hour. Next, 200µl of each sample were then loaded into a 96-well plate in triplicate and absorbances were determined at 562nm wavelength and compared to standards of known concentration of ARS. Because 1 mole of ARS binds to 2 moles of calcium [27], moles of calcium deposited per sample were extrapolated. Following quantification of ARS, total cell number of hMSCs on each surface was measured to normalize the amount of calcium deposition by permeabilizing the cells with 0.1% Triton X-100, staining with DAPI. Total cell number was measured as described in section 2.3.
2.6. mRNA expression profiles
Total RNA was collected from hMSCs at 3, 7, 10 and 14 days. RNA was isolated with RNeasy Mini Kit (Qiagen, San Jose, CA). Total RNA was reverse-transcribed with QuantiTect Reverse Transcription Kit (Qiagen, San Jose, CA), and qPCR was performed using QuantiFast Probe PCR Kit (Qiagen, San Jose, CA) on a Mastercycler® realplex2 (Eppendorf, Hauppauge, NY). Proprietary primer and probe sets for BGLAP (Osteocalcin, Hs01587814-g1), RUNX2 (runt-related transcription factor 2, Hs00231692-m1) and TBP (TATA-binding protein, 4333769F) were purchased from Applied Biosystems (Carlsbad, CA). Amplification conditions were 95 °C for 3 minutes, followed by 40 cycles at 95 °C for 3 seconds and 60 °C for 30 seconds. ΔCt was calculated relative to the loading control (TBP) for each sample; ΔΔCt was calculated by normalizing ΔCt of target conditions to that of control conditions (e.g. planar surface at the same time point). Relative expression was subsequently calculated using the formula 2−ΔΔCt [28].
2.7. Statistics
All data were analyzed using GraphPad Prism 4 (GraphPad Software, La Jolla, CA) and/or PASW Statistics 17.0 (SPSS Inc, Chicago, IL). When variability was determined to be significant (p < 0.05) using analysis of variance (ANOVA), the Tukey’s multiple comparison test was conducted as the post hoc test. Significance was established when * = p < 0.05, ** = p < 0.01, or *** = p < 0.001.
3. Results
3.1. Effect of topographic cues on fundamental cell behaviors
3.1.1. Cell Morphology, Area, Elongation and Alignment
hMSCs on 400 nm pitch exhibited a flattened morphology (Fig 1B) as well as the largest average cell area among all surfaces (Fig 2A). In contrast, the number of elongated hMSCs on 1400 and 4000 nm pitch was significantly higher compared to 400 nm pitch and planar surfaces (Fig 1C/D and 2B). On 1400 and 4000 nm pitch, the number of aligned hMSCs to the underlying topography was significantly higher compared to 400 nm pitch and planar surfaces (Fig 2C). The results were similar with all passages.
Fig 2. Influence of topographic surfaces on area, elongation, alignment and cell adhesion.


Average cell area (A), cell elongation (B) and alignment as measured by adjusted angle to the underlying ridges and grooves (C) were measured after 24 hours seeding. hMSCs on the 400 nm pitch were the largest among all surfaces and significantly larger than hMSCs on 1400 nm pitch (A). hMSCs on 1400 and 4000 nm pitch were significantly more elongated than cells seeded on 400 nm pitch and planar surfaces (B). The number of aligned hMSCs on 1400 and 4000 nm pitch was significantly higher than that on 400 nm and planar surfaces (C). The number of hMSCs 3 hours after seeding was counted, and significantly fewer cells were found on 400 nm pitch compared to planar surfaces (D). Data trends also showed fewer cells attached to the 1400 and 4000 nm pitches compared to planar surfaces (D). All data are presented as the mean ± SEM.
3.1.2. Cell Attachment
400 nm pitch significantly decreased cell adhesion compared to planar surfaces (Fig 2D). There were trends, although not statistically significant, for similar results with 1400 and 4000 nm pitch compared to planar surfaces.
3.1.3 Cell Proliferation
The percent increase in cell number was calculated by comparing the cell number 3 hours post-seeding to total cell number after 7 days of culture. There was no statistical difference of the proliferation rate between cells cultured on patterned and planar surfaces (Fig 3A). Total cell number on day 7, 14 and 21 was also calculated, and the number of cells on planar surfaces was consistently higher than that on patterned surfaces on all days (Fig 3B), perhaps due to differential attachment of the seeded cells.
Fig 3. Influence of topographic surfaces upon hMSC proliferation.


The lowest proliferation rate was found on 400 nm pitch although there was no significant difference of the proliferation rate between all surfaces (A). The cell number of hMSCs over three weeks was also measured, and hMSCs on planar surfaces showed consistently higher cell number than topographic surfaces (B). All data are presented as the mean ± SEM.
3.2. Enhanced osteogenic differentiation on topographically-patterned substrates
After 3 days of culture, expression of RUNX2, a master control gene of osteogenic differentiation [5], was significantly higher on 400 nm pitch compared to 4000 nm pitch and planar surfaces (Fig 4A). This persisted through 14 days of culture (Fig 4A). There was no statistically significant influence of 1400 or 4000nm pitch topographies on RUNX2 expression compared to planar controls. We also examined expression of osteocalcin (BGLAP), a marker of mature osteoblasts. At each time point examined, there was a significant stimulatory effect of topography upon BGLAP expression compared to planar controls (Fig 4B).
Fig 4. Gene expression and Ca deposition analyses of hMSCs cultured on topographic surfaces and planar control.


Expression of two osteogenic markers, RUNX2 (A) and BGLAP (B), was measured by quantitative PCR at day 3, 7, 10 and 14. The expression of Runx2 or BGLAP was first normalized to the expression of endogenous control TBP (TATA-binding protein), and then normalized to the Runx2 or BGLAP expression of the planar control at each day. The hMSCs on 400 nm pitch expressed significantly higher RUNX2 than planar surfaces at day 3 and 14 (A). hMSCs on patterned surfaces expressed consistently higher BGLAP than cells on planar surfaces (B). Normalized calcium deposition of hMSCs on topographic surfaces and planar control at day 7, 14 and 21 (C). The total calcium depositions were measured and normalized to the cell number on each surface. hMSCs on 400 nm pitch showed significantly higher normalized calcium deposition compared to planar or 4000 nm pitch surfaces at day 7 and 14. All data are presented as the mean ± SEM.
The influence of topographic cues on extracellular calcium deposition was also examined. As the total cell number on topographic surfaces was different between topographic surfaces and planar surfaces (Fig 3B), calcium deposition was normalized to cell number. Normalized calcium deposition on 400 nm pitch was significantly higher than planar surfaces at days 7 and 14 (Fig 4C). There were no differences in normalized calcium deposition among any surfaces at day 21.
3.3. Regulation of upstream signaling pathways in non-osteoinductive growth medium
To investigate how nanotopography affects the osteogenic differentiation, we examined RNA expression of target genes of BMP (ID1) or Wnt signaling (TCF3 and AXIN2). In non-osteoinductive medium, RNA expression of the three genes (ID1, TCF3 and AXIN2) was not significantly different among all surfaces (Fig 5A–C).
Fig 5. Gene expression analysis of BMP and Wnt signaling pathways in hMSCs on topographic surfaces and planar control at day 3.


Expression of ID1, a downstream gene of the BMP pathway (A), and TCF3 (B) and AXIN2 (C), downstream genes of the Wnt signaling pathway, was measured by quantitative PCR. The expression of each gene was first normalized to the expression of endogenous control TBP, and then normalized to the planar control. No significant increase in BMP or Wnt signaling pathways was noted in hMSCs under growth medium condition. All data are presented as the mean ± SEM.
3.4 Combinatory effects of osteoinductive medium and topographic cues on fundamental cell behaviors and osteogenic differentiation
We next examined whether there were additive effects of traditional osteoinductive treatment and nanotopography. The percent increase in cell number was calculated by comparing the cell number after 3 hours to the cell number (Fig 2A) after the seven day time point in osteoinductive medium (Fig 6A). Data trends in this medium showed lower proliferation rates on 400 nm and 4000 nm pitch compared to planar surfaces. Then, we measured the total cell number of hMSCs in osteogenic medium on day 7, 14 and 21. The hMSCs on topographic surfaces consistently showed lower cell number compared to planar surfaces (Fig 6B).
Fig 6. Influence of nanograting topography upon hMSC proliferation in osteogenic medium.


In osteogenic medium condition, proliferation rate (A) and the total cell number on each surface (B) were investigated. Decreased proliferation rates of hMSCs were noted on 400 and 4000 nm pitches compared with planar control although this did not reach statistical significance (A). The cell number of hMSCs over three weeks was also measured. Similar to hMSCs in normal growth medium, hMSCs on planar surfaces in osteogenic meida showed consistently higher cell number than topographic surfaces (B). All data are presented as the mean ± SEM.
The expression of osteogenic gene markers and calcium deposition in osteo-inductive culture was determined. Expression of RUNX2 was only significantly enhanced on the 400 nm pitch as compared to planar surfaces at days 3 (Fig 7A). Expression of BGLAP was significantly increased on the topographically-patterned substrates compared to planar surfaces at multiple time points. Significantly higher BGLAP expression was detected on 400 nm pitch surfaces at days 3, 10 and 14, on 1400 nm pitch surfaces at days 10 and 14, and on 4000 nm pitch surfaces at days 3 compared to planar surfaces (Fig 7B). Similar to non-osteoinductive growth medium, normalized calcium deposition was significantly increased on 400 nm pitch surfaces at days 7 compared to planar controls (Fig 7C).
Fig 7. Gene expression and Ca deposition analyses of hMSCs cultured in osteogenic medium on topographic surfaces and planar control.


In osteogenic medium condition, expression of two osteogenic marker genes, Runx2 (A) and BGLAP (B), was measured by quantitative PCR at day 3, 7, 10 and 14. The expression of Runx2 or BGLAP was first normalized to the expression of endogenous control TBP, and then normalized to the Runx2 or BGLAP expression of the planar control at each day. Similar to the growth medium condition, the expression of RUNX2 in hMSCs on 400 nm pitch was significantly higher than planar surfaces at day 3 (A). hMSCs on patterned surfaces expressed consistently higher BGLAP than cells on planar surfaces (B). Normalized calcium deposition of hMSCs in osteogenic medium on topographic surfaces and planar control at day 7, 14 and 21 (C). The total calcium depositions were measured and normalized to the cell number on each surface. hMSCs on the 400 nm pitch showed significantly higher normalized calcium deposition compared to planar and other patterned surfaces only at day 7. All data are presented as the mean ± SEM.
In osteogenic medium, expression of ID1 on 400 nm pitch surfaces was significantly greater than expression on planar controls, while expression of TCF3 and AXIN2 did not significantly differ among all surfaces (Fig 8A–C).
Fig 8. Gene expression analysis of BMP and Wnt signaling pathways in osteogenic medium on topographic surfaces and planar control at day 3.


In osteogenic medium condition, expression of ID1, a downstream gene of the BMP pathway (A), and TCF3 (B) and AXIN2 (C), downstream genes of Wnt signaling pathway, were measured by quantitative PCR. The expression of each gene was first normalized to the expression of endogenous control TBP, and then normalized to its expression of planar control. hMSCs on the 400 nm pitch expressed significantly higher ID1 than cells on planar surfaces (A) although no other significant difference was noted in the expression of TCF3 (B) and AXIN2 (C). All data are presented as the mean ± SEM.
4. Discussion
In this study, we demonstrated that a specific size scale of topographic ridges and grooves promotes the osteogenic differentiation of hMSCs. Other substratum geometries, such as nanopits and nanotubes have been previously shown to stimulate osteogenic differentiation [18, 19]. In this study, hMSCs were seeded on topographic ridges and grooves ranging from 400 nm to 4,000 nm pitch. The 400 nm pitch (200 nm wide ridges + 200 nm wide grooves) resulted in the highest expression levels of two important osteogenic marker genes and bone mineral formation. Given the results that tubes with a 100 nm diameter and nanopits of 300 nm pitch enhanced osteogenic differentiation of hMSCs [18, 19], 100 nm to 400 nm may be the optimal length scale for promoting osteogenic differentiation in hMSCs. Within bone, type I collagen is the most abundant ECM protein, and is composed of parallel array of collagen fibrils 10–300 nm in size [22, 29], suggesting that the most potent osteogenic differentiation in this study may have resulted from topographic cues that mimic in situ orientation and composition of collagen in bone.
Our results differ from previous studies where topographic ridges and grooves were shown to induce neuronal markers [30], In that study, ridges and grooves with 700 nm pitch induced a number of neuronal markers. With that study, different culture medium and a different coating material were used. The seeding density also differed. Each of these factors may have cued the MSC into a different cell path than the osteogenic one observed in our studies.
Similar to the study conducted in rabbit corneal keratocytes, fibroblasts and myofibroblasts [12], hMSCs on 1400 nm and 4000 nm pitch patterned substrates significantly elongated and aligned to the underlying topography compared to planar surfaces. In contrast, hMSCs on 400 nm pitch and planar surfaces showed a more rounded and flattened morphology although hMSCs on 400 nm pitch were significantly aligned to the underlying topography. These data demonstrate that ridges and grooves as low as 400 nm pitch modify alignment and/or morphology of hMSCs. It is known that changes in cell morphology affect gene expression profiles and cell differentiation [31–33]. In particular, hMSCs differentiate into osteoblasts when allowed to spread and flatten, whereas restricting the surface area upon which to grow promotes adipogenic differentiation of hMSCs [4]. Greatest average cell area was found in hMSCs cultured on 400 nm pitch (Fig 2B). Combined, this suggests that osteogenic differentiation occurs when cell area increases.
The process of bone repair and regeneration is complex, and several molecules, including Wnt and bone morphogenetic proteins (BMPs), were identified as pivotal factors in osteogenic differentiation [5, 6, 34, 35]. However, the precise mechanisms and interaction between different molecular processes remain unknown [34]. There have been very few investigations regarding the association between topographic cues and molecular signaling pathways, particularly for osteogenic differentiation [36, 37]. In order to determine the relationship between topographic cues and the Wnt and or BMP signaling pathways, three downstream genes, ID1, TCF3 and AXIN2 were analyzed. ID1 is a target gene induced by BMPs [38, 39], while TCF3 is induced by Wnt signaling and plays an important role in stem cell differentiation [40]. AXIN2 is induced by beta-catenin/Wnt signaling, where it functions to dampen Wnt signaling in a negative feedback manner [41]. In this study, TCF3 and AXIN2, downstream genes of Wnt pathway, were not significantly affected by topographic cues. On the other hand, ID1 was significantly up-regulated on 400 nm pitch patterned substrates in osteogenic medium, and a similar trend of ID1 up-regulation was found in non-osteinductive medium. The results demonstrate that biomimetic topographic cues enhance the BMP pathway particularly in the presence of osteogenic medium. This finding is important because the combinatory treatment of topographical and biochemical induction may be applicable for patients of orthopedic procedures at high-risk for the development of complications.
The combination of soluble biochemical cues provided by osteoinductive medium and topographical cues provided by 400 nm pitch substratum topography significantly enhanced expression of RUNX2 and BGLAP and showed the highest normalized calcium deposition. The results demonstrate that topographical cues can be combined with traditional osteoinductive treatments to achieve an additive effect for osteogenic differentiation. Similarly, ID1 was significantly up-regulated only on 400 nm pitch in osteogenic medium suggesting that topographic cues may reinforce a canonical signaling pathway in the presence of osteoinductive agents. Assessment of osteogenic differentiation over two to three weeks demonstrated that the effects of topographic cues persisted for at least for two weeks. Expression of the BGLAP and normalized calcium deposition on topography with 400 nm pitch were consistently higher than that on planar controls. These results showed the advantage of employing topographically modified implants over traditional osteoinductive agents as topographic cues last longer than osteoinductive agents that have mean residence time of less than 8 days [42, 43].
In summary, our data showed that topographic cues, especially in the smaller biomimetic size scale (400 nm pitch), are feasible ways to improve osteogenic differentiation in hMSCs. We identified optimal length scale for osteogenic differentiation and combinatory effects of topography and osteoinductive agents will provide insight on the wide variety of treatment options for orthopedic complications.
5. Conclusion
Our data show that topographic cues promote osotegenic differentiation in hMSCs in a size scale-dependent manner. We investigated the effects of topographic cues on proliferation, two essential osteogenic genes, canonical signaling pathways and calcium deposition with and without osteoinductive agents. We found that 400 nm pitch surfaces are ideal for osteogenic differentiation in hMSCs regardless of culture conditions. These studies provide the optimal size scale for the substratum in the development of orthopedic implants to enhance bone formation. Furthermore, these studies imply combinatory use of topographic cues and traditional soluble osteoinductive agents would be beneficial.
ACKNOWLEDGEMENTS
The authors would like to thank Dr. Nihar M. Shah and Brittany L. Wood for the fabrication of patterned substrates. This work was supported by an unrestricted grant from Research to Prevent Blindness and Award Number R03AR057547 from the National Institute of Arthritis and Musculoskeletal and Skin Diseases (DCG).
Footnotes
Publisher's Disclaimer: This is a PDF file of an unedited manuscript that has been accepted for publication. As a service to our customers we are providing this early version of the manuscript. The manuscript will undergo copyediting, typesetting, and review of the resulting proof before it is published in its final citable form. Please note that during the production process errors may be discovered which could affect the content, and all legal disclaimers that apply to the journal pertain.
References
- 1.Becker DJ, Kilgore ML, Morrisey MA. The societal burden of osteoporosis. Curr Rheumatol Rep. 2010;12:186–191. doi: 10.1007/s11926-010-0097-y. [DOI] [PubMed] [Google Scholar]
- 2.Lewiecki EM. Management of osteoporosis. Clin Mol Allergy. 2004;2:9. doi: 10.1186/1476-7961-2-9. [DOI] [PMC free article] [PubMed] [Google Scholar]
- 3.White AP, Hashimoto R, Norvell DC, Vaccaro AR. Morbidity and mortality related to odontoid fracture surgery in the elderly population. Spine. 2010;35:S146–S157. doi: 10.1097/BRS.0b013e3181d830a4. [DOI] [PubMed] [Google Scholar]
- 4.McBeath R, Pirone DM, Nelson CM, Bhadriraju K, Chen CS. Cell shape, cytoskeletal tension, and RhoA regulate stem cell lineage commitment. Dev Cell. 2004;6:483–495. doi: 10.1016/s1534-5807(04)00075-9. [DOI] [PubMed] [Google Scholar]
- 5.Augello A, De Bari C. The regulation of differentiation in mesenchymal stem cells. Hum Gene Ther. 2010;21:1226–1238. doi: 10.1089/hum.2010.173. [DOI] [PubMed] [Google Scholar]
- 6.Satija NK, Gurudutta GU, Sharma S, Afrin F, Gupta P, Verma YK, et al. Mesenchymal stem cells: molecular targets for tissue engineering. Stem Cells Dev. 2007;16:7–23. doi: 10.1089/scd.2006.9998. [DOI] [PubMed] [Google Scholar]
- 7.Handschel JG, Depprich RA, Kubler NR, Wiesmann HP, Ommerborn M, Meyer U. Prospects of micromass culture technology in tissue engineering. Head Face Med. 2007;3:4. doi: 10.1186/1746-160X-3-4. [DOI] [PMC free article] [PubMed] [Google Scholar]
- 8.Wang WG, Lou SQ, Ju XD, Xia K, Xia JH. In vitro chondrogenesis of human bone marrow-derived mesenchymal progenitor cells in monolayer culture: activation by transfection with TGF-beta2. Tissue Cell. 2003;35:69–77. doi: 10.1016/s0040-8166(02)00106-4. [DOI] [PubMed] [Google Scholar]
- 9.Undale AH, Westendorf JJ, Yaszemski MJ, Khosla S. Mesenchymal stem cells for bone repair and metabolic bone diseases. Mayo Clin Proc. 2009;84:893–902. doi: 10.4065/84.10.893. [DOI] [PMC free article] [PubMed] [Google Scholar]
- 10.Schroeder JE, Mosheiff R. Tissue engineering approaches for bone repair: Concepts and evidence. Injury. 2011;42:609–613. doi: 10.1016/j.injury.2011.03.029. [DOI] [PubMed] [Google Scholar]
- 11.Liliensiek SJ, Wood JA, Yong J, Auerbach R, Nealey PF, Murphy CJ. Modulation of human vascular endothelial cell behaviors by nanotopographic cues. Biomaterials. 2010;31:5418–5426. doi: 10.1016/j.biomaterials.2010.03.045. [DOI] [PMC free article] [PubMed] [Google Scholar]
- 12.Pot SA, Liliensiek SJ, Myrna KE, Bentley E, Jester JV, Nealey PF, et al. Nanoscale topography-induced modulation of fundamental cell behaviors of rabbit corneal keratocytes, fibroblasts, and myofibroblasts. Invest Ophthalmol Vis Sci. 2010;51:1373–1381. doi: 10.1167/iovs.09-4074. [DOI] [PMC free article] [PubMed] [Google Scholar]
- 13.McFarlin KJ, Nealey PF, Murphy CJ. Nanoscale through substratum topographic cues modulate human embryonic stem cell self-renewal. J Biomim Biomater Tissue Eng. 2009;2:15–26. [Google Scholar]
- 14.McNamara LE, McMurray RJ, Biggs MJ, Kantawong F, Oreffo RO, Dalby MJ. Nanotopographical control of stem cell differentiation. J Tissue Eng. 2010;2010:120623. doi: 10.4061/2010/120623. [DOI] [PMC free article] [PubMed] [Google Scholar]
- 15.Engler AJ, Sen S, Sweeney HL, Discher DE. Matrix elasticity directs stem cell lineage specification. Cell. 2006;126:677–689. doi: 10.1016/j.cell.2006.06.044. [DOI] [PubMed] [Google Scholar]
- 16.Liliensiek SJ, Campbell S, Nealey PF, Murphy CJ. The scale of substratum topographic features modulates proliferation of corneal epithelial cells and corneal fibroblasts. J Biomed Mater Res A. 2006;79:185–192. doi: 10.1002/jbm.a.30744. [DOI] [PMC free article] [PubMed] [Google Scholar]
- 17.Flemming RG, Murphy CJ, Abrams GA, Goodman SL, Nealey PF. Effects of synthetic micro- and nano-structured surfaces on cell behavior. Biomaterials. 1999;20:573–588. doi: 10.1016/s0142-9612(98)00209-9. [DOI] [PubMed] [Google Scholar]
- 18.Dalby MJ, Gadegaard N, Tare R, Andar A, Riehle MO, Herzyk P, et al. The control of human mesenchymal cell differentiation using nanoscale symmetry and disorder. Nat Mater. 2007;6:997–1003. doi: 10.1038/nmat2013. [DOI] [PubMed] [Google Scholar]
- 19.Oh S, Brammer KS, Li YS, Teng D, Engler AJ, Chien S, et al. Stem cell fate dictated solely by altered nanotube dimension. Proc Natl Acad Sci U S A. 2009;106:2130–2135. doi: 10.1073/pnas.0813200106. [DOI] [PMC free article] [PubMed] [Google Scholar]
- 20.Bettinger CJ, Langer R, Borenstein JT. Engineering substrate topography at the micro- and nanoscale to control cell function. Angew Chem Int Ed Engl. 2009;48:5406–5415. doi: 10.1002/anie.200805179. [DOI] [PMC free article] [PubMed] [Google Scholar]
- 21.Lim JY, Loiselle AE, Lee JS, Zhang Y, Salvi JD, Donahue HJ. Optimizing the osteogenic potential of adult stem cells for skeletal regeneration. J Orthop Res. 2011 doi: 10.1002/jor.21441. [DOI] [PMC free article] [PubMed] [Google Scholar]
- 22.Mwenifumbo S, Stevens MM. ECM interactions with cells from the macro- to nanoscale. In: Gonsalves K, Halberstadt C, Laurencin CT, Nair L, editors. Biomedical Nanostructures. New York: John Wiley & Sons; 2008. pp. 223–260. [Google Scholar]
- 23.Loesberg WA, te Riet J, van Delft FC, Schon P, Figdor CG, Speller S, et al. The threshold at which substrate nanogroove dimensions may influence fibroblast alignment and adhesion. Biomaterials. 2007;28:3944–3951. doi: 10.1016/j.biomaterials.2007.05.030. [DOI] [PubMed] [Google Scholar]
- 24.Teixeira AI, Abrams GA, Bertics PJ, Murphy CJ, Nealey PF. Epithelial contact guidance on well-defined micro- and nanostructured substrates. J Cell Sci. 2003;116:1881–1892. doi: 10.1242/jcs.00383. [DOI] [PMC free article] [PubMed] [Google Scholar]
- 25.Karuri NW, Liliensiek S, Teixeira AI, Abrams G, Campbell S, Nealey PF, et al. Biological length scale topography enhances cell-substratum adhesion of human corneal epithelial cells. J Cell Sci. 2004;117:3153–3164. doi: 10.1242/jcs.01146. [DOI] [PMC free article] [PubMed] [Google Scholar]
- 26.Stanford CM, Jacobson PA, Eanes ED, Lembke LA, Midura RJ. Rapidly forming apatitic mineral in an osteoblastic cell line (UMR 106-01 BSP) J Biol Chem. 1995;270:9420–9428. doi: 10.1074/jbc.270.16.9420. [DOI] [PubMed] [Google Scholar]
- 27.Puchtler H, Meloan SN, Terry MS. On the history and mechanism of alizarin and alizarin red S stains for calcium. J Histochem Cytochem. 1969;17:110–124. doi: 10.1177/17.2.110. [DOI] [PubMed] [Google Scholar]
- 28.Livak KJ, Schmittgen TD. Analysis of relative gene expression data using real-time quantitative PCR and the 2(-Delta Delta C(T)) method. Methods. 2001;25:402–428. doi: 10.1006/meth.2001.1262. [DOI] [PubMed] [Google Scholar]
- 29.Martin RB, Burr DB, Sharkey NA. Material properties of cortical bone. In: Martin RB, Burr DB, Sharkey NA, editors. Skeletal tissue mechanics. New York: Springer; 1998. pp. 143–165. [Google Scholar]
- 30.Yim EK, Pang SW, Leong KW. Synthetic nanostructures inducing differentiation of human mesenchymal stem cells into neuronal lineage. Exp Cell Res. 2007;313:1820–1829. doi: 10.1016/j.yexcr.2007.02.031. [DOI] [PMC free article] [PubMed] [Google Scholar]
- 31.Itano N, Okamoto S, Zhang D, Lipton SA, Ruoslahti E. Cell spreading controls endoplasmic and nuclear calcium: a physical gene regulation pathway from the cell surface to the nucleus. Proc Natl Acad Sci U S A. 2003;100:5181–5186. doi: 10.1073/pnas.0531397100. [DOI] [PMC free article] [PubMed] [Google Scholar]
- 32.Thomas CH, Collier JH, Sfeir CS, Healy KE. Engineering gene expression and protein synthesis by modulation of nuclear shape. Proc Natl Acad Sci U S A. 2002;99:1972–1977. doi: 10.1073/pnas.032668799. [DOI] [PMC free article] [PubMed] [Google Scholar]
- 33.Ho JH, Ma WH, Su Y, Tseng KC, Kuo TK, Lee OK. Thymosin beta-4 directs cell fate determination of human mesenchymal stem cells through biophysical effects. J Orthop Res. 2010;28:131–138. doi: 10.1002/jor.20956. [DOI] [PubMed] [Google Scholar]
- 34.Deschaseaux F, Sensebe L, Heymann D. Mechanisms of bone repair and regeneration. Trends Mol Med. 2009;15:417–429. doi: 10.1016/j.molmed.2009.07.002. [DOI] [PubMed] [Google Scholar]
- 35.Otto F, Lubbert M, Stock M. Upstream and downstream targets of RUNX proteins. J Cell Biochem. 2003;89:9–18. doi: 10.1002/jcb.10491. [DOI] [PubMed] [Google Scholar]
- 36.Vlacic-Zischke J, Hamlet SM, Friis T, Tonetti MS, Ivanovski S. The influence of surface microroughness and hydrophilicity of titanium on the up-regulation of TGFbeta/BMP signalling in osteoblasts. Biomaterials. 2011;32:665–671. doi: 10.1016/j.biomaterials.2010.09.025. [DOI] [PubMed] [Google Scholar]
- 37.Galli C, Passeri G, Ravanetti F, Elezi E, Pedrazzoni M, Macaluso GM. Rough surface topography enhances the activation of Wnt/beta-catenin signaling in mesenchymal cells. J Biomed Mater Res A. 2010;95:682–690. doi: 10.1002/jbm.a.32887. [DOI] [PubMed] [Google Scholar]
- 38.Miyazono K, Miyazawa K. Id: a target of BMP signaling. Sci STKE. 2002;151:pe40. doi: 10.1126/stke.2002.151.pe40. [DOI] [PubMed] [Google Scholar]
- 39.Peng Y, Kang Q, Luo Q, Jiang W, Si W, Liu BA, et al. Inhibitor of DNA binding/differentiation helix-loop-helix proteins mediate bone morphogenetic protein-induced osteoblast differentiation of mesenchymal stem cells. J Biol Chem. 2004;279:32941–32949. doi: 10.1074/jbc.M403344200. [DOI] [PubMed] [Google Scholar]
- 40.Hikasa H, Ezan J, Itoh K, Li X, Klymkowsky MW, Sokol SY. Regulation of TCF3 by Wnt-dependent phosphorylation during vertebrate axis specification. Dev Cell. 2010;19:521–532. doi: 10.1016/j.devcel.2010.09.005. [DOI] [PMC free article] [PubMed] [Google Scholar]
- 41.Minear S, Leucht P, Jiang J, Liu B, Zeng A, Fuerer C, et al. Wnt proteins promote bone regeneration. Sci Transl Med. 2010;2:29ra30. doi: 10.1126/scitranslmed.3000231. [DOI] [PubMed] [Google Scholar]
- 42.Valentin-Opran A, Wozney J, Csimma C, Lilly L, Riedel GE. Clinical evaluation of recombinant human bone morphogenetic protein-2. Clin Orthop Relat Res. 2002;395:110–120. doi: 10.1097/00003086-200202000-00011. [DOI] [PubMed] [Google Scholar]
- 43.Kasahara E, Kashiba M, Jikumaru M, Kuratsune D, Orita K, Yamate Y, et al. Dynamic aspects of ascorbic acid metabolism in the circulation: analysis by ascorbate oxidase with a prolonged in vivo half-life. Biochem J. 2009;421:293–299. doi: 10.1042/BJ20090286. [DOI] [PubMed] [Google Scholar]