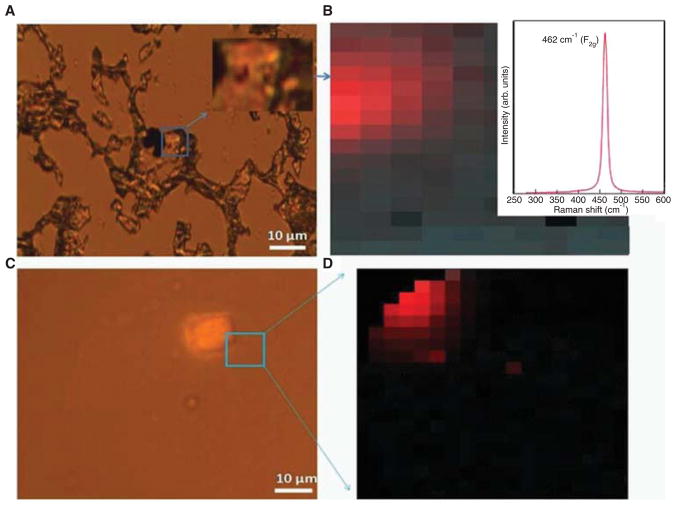
Figure 2.
Raman spectroscopy of CeO2 nanoparticles in mouse lung tissue. (A) An optical image of a CeO2-instilled C57BL/6 mouse lung section showing black colored CeO2 at the surface. (B) The corresponding Raman image of the mouse lung section shown in (A). The red colored region is a map of the characteristic Raman peak (shown in the inset ~ 464 cm−1) for CeO2 nanoparticles. (C) Optical image of CeO2 instilled mouse lung section showing CeO2 embedded at ~ 4 μm depth. (D) The corresponding Raman map of the 464 cm−1 peak for the section shown in (C).

