

Abstract
A number of functional magnetic resonance imaging (fMRI) studies reported the existence of default mode network (DMN) and its disruption due to the presence of a disease such as Alzheimer's disease (AD). In this investigation, first, we used the independent component analysis (ICA) technique to confirm the DMN difference between patients with AD and normal control (NC) reported in previous studies. Consistent with the previous studies, the decreased resting‐state functional connectivity of DMN in AD was identified in posterior cingulated cortex (PCC), medial prefrontal cortex (MPFC), inferior parietal cortex (IPC), inferior temporal cortex (ITC), and hippocampus (HC). Moreover, we introduced Bayesian network (BN) to study the effective connectivity of DMN and the difference between AD and NC. When compared the DMN effective connectivity in AD with the one in NC using a nonparametric random permutation test, we found that connections from left HC to left IPC, left ITC to right HC, right HC to left IPC, to MPFC and to PCC were all lost. In addition, in AD group, the connection directions between right HC and left HC, between left HC and left ITC, and between right IPC and right ITC were opposite to those in NC group. The connections of right HC to other regions, except left HC, within the BN were all statistically in‐distinguishable from 0, suggesting an increased right hippocampal pathological and functional burden in AD. The altered effective connectivity in patients with AD may reveal more characteristics of the disease and may serve as a potential biomarker. Hum Brain Mapp, 2011. © 2011 Wiley‐Liss, Inc.
Keywords: biomarker, effective connectivity, functional connectivity, resting state, fMRI
INTRODUCTION
The existence of the default mode network (DMN) in the human brain was evidenced firstly via positron emission tomography (PET) and then primarily via functional magnetic resonance imaging (fMRI) [Buckner et al.,2008; Raichle et al.,2001]. Viewed as an integrated system, DMN consisted of a specific set of brain regions and was initially characterized as persistent task‐independent decreased neural activity during goal‐oriented tasks [Greicius et al.,2003; Raichle and Snyder,2007; Raichle et al.,2001]. DMN was then observed in the absence of any intentionally introduced cognitive task. A number of studies were conducted attempting to understand the DMN's components [Damoiseaux et al.,2006; Fox et al.,2005; Fransson,2005; Greicius et al.,2003,2004; Mazoyer et al.,2001; Raichle et al.,2001; Vincent et al.,2006], function [Gilbert et al.,2007; Hahn et al.,2007; Raichle et al.,2001; Svoboda et al.,2006], its relevance to diseases [Bluhm et al.,2007; Celone et al.,2006; Cherkassky et al.,2006; Greicius et al.,2004; Lustig et al.,2003; Rombouts et al.,2005; Sorg et al.,2007; Wang et al.,2006], and its interaction with other resting‐state networks [Demirci et al.,2009; Liao et al.,2010; Margulies et al.,2007; Stevens et al.,2009]. By comparing the consistent fMRI signal increases during passive task states to a wide range of active cognitive tasks [Mazoyer et al.,2001; Raichle et al.,2001; Vincent et al.,2006] or exploring the intrinsic activity of the resting‐state data [Damoiseaux et al.,2006; Fox et al.,2005; Fransson,2005; Greicius et al.,2003,2004], a number of studies consistently identified the DMN core brain regions such as medial prefrontal cortex (MPFC), posterior cingulate cortex (PCC), inferior parietal cortex (IPC), inferior temporal cortex (ITC), and (para)hippocampal formation [Buckner et al.,2008]. The specific anatomic locations of these regions together with their task‐induced deactivations suggested possible roles that DMN played, such as monitoring the external environment [Ghatan et al.,1995; Gilbert et al.,2007; Hahn et al.,2007; Raichle et al.,2001] and supporting internal mentation [Kelley et al.,2002; Mitchell et al.,2006; Raichle et al.,2001].
DMN findings above were primarily investigated in normal healthy subjects. DMN alterations in neurodegenerative disorders have also been investigated. Using fMRI for example, Greicius et al. [2004] revealed the link between clinical symptoms and disruption of DMN due to Alzheimer's disease (AD) [Greicius et al.,2004].
AD is one of the most common neurodegenerative disorders. It is clinically characterized by progressive cognitive decline and neuropsychiatric symptoms [Blennow et al.,2006]. Using PET and single‐photon emission computerized tomography, reduced activity in PCC, parietal, temporal, and prefrontal cortices has been observed consistently [Johnson et al.,1998; Matsuda,2001; Minoshima et al.,1997]. It is believed that decreased PCC activity in AD reflected decreased connectivity with medial temporal lobe (MTL) structures, such as the hippocampus (HC), which is among the first regions targeted by AD pathology [Aupee et al.,2001; Della‐Maggiore et al.,2000; McIntosh et al.,1996]. Using fMRI and independent component analysis (ICA) to study the DMN difference between AD and normal control (NC), Greicius et al. [2004] found that resting‐state activity in PCC and HC was decreased in AD compared to healthy aging. These AD‐associated changes suggest a potential role of DMN imaging as a noninvasive biomarker of AD [Greicius et al.,2004]. In another study, using correlation analysis with bilateral anterior HC as the seed region, Wang et al. [2006] found that functional connectivity between the right HC and a set of regions such as the MPFC, right ITC, right precuneus, right superior, and middle temporal cortex (S/MTC), and PCC was disrupted in AD [Wang et al.,2006]. This disrupted correlated hippocampal connectivity is consistent with the finding of decreased hippocampal activity associated with suppression of the DMN in AD demonstrated by ICA techniques [Celone et al.,2006; Greicius et al.,2004]. Again, these findings were suggestive that the dysfunction may contribute to deficits of cognition characteristic of AD and may serve as a biomarker for diagnosis and monitoring of AD progression.
To use the functional connectivity as a potential biomarker, we note that its association with the disease severity measures such as Mini Mental State Examination (MMSE) or Clinical Dementia Rate (CDR) should be also assessed in addition to its ability to differentiate patients with AD from healthy elderly subjects, and eventually from other dementias. As stated below, this association investigation will be part of this study.
The functional connectivity for DMN as depicted by ICA, correlative analysis and other reported analytical techniques, is one of two connectivity types. In the analysis of neuroimaging time‐series, functional connectivity is defined as the temporal correlations between spatially remote neurophysiological events [Friston et al.,1993]. Yet, the functional connectivity does not provide any direct insight into how these correlations are mediated. The second type of connectivity is the so‐called effective connectivity. This refers to the influence one neuronal system exerts over another [Friston,1994]. Although DMN functional connectivity differences have been well investigated between AD and NC, the effective connectivity is yet to be explored. Of course, real causal relationship cannot simply be claimed out of effective connectivity analysis.
Traditional effective connectivity analysis approaches include structural equation modeling (SEM) [McIntosh and Gonzalez‐Lima,1994], dynamic causal modeling (DCM) [Friston et al.,2003], and Granger causality mapping (GCM) [Goebel et al.,2003]. The SEM requires specification of brain regions and especially the a priori relationships among them based on anatomical data, and it uses the covariance matrix among brain regions to characterize the behavior of a neural system. The DCM models temporal interactions at the neuronal level, and it describes the dynamic and nonlinear characteristic of neural systems using bilinear differential equations, combined with a hemodynamic forward model. The GCM uses a vector autoregressive model to analyze the functional interactions among regions, which is a pair‐wise connectivity analysis rather than a global representation of a neural system. In general, both SEM and DCM are hypothesis‐driven approaches, which need prior connectivity models to begin with [Zheng and Rajapakse,2006]. As such, they provide more theoretically powerful inference. On the other hand, however, much stronger assumptions are needed.
Investigating silent word reading and counting Stroop task, Zheng et al. [2006] recently proposed to use the Bayesian network (BN) learning approach, a data‐driven method, to characterize effective connectivity patterns among brain regions in fMRI studies. BN can learn the global effective connectivity pattern, rather than pair‐wise connectivity [Zheng and Rajapakse,2006].
In fact, the BN learning approach has had wide applications for general complex systems before its recent introduction to fMRI studies. As a tool of uncertainty reasoning, it was developed by combing the probability statistics and graph theory and originated in the mid‐1980s addressing the issue of uncertainty in the fields of artificial intelligence and machine learning [Olmsted,1983; Shachter and Kenley,1989]. This approach needs no assumption of any prior models and can provide a global representation of a system automatically learned from data in a completely exploratory manner [Zheng and Rajapakse,2006]. A BN model is a directed acyclic graph that encodes a joint probability distribution over a set of random variables, represented as nodes of the acyclic graph. Arcs between nodes signify the directional dependence relations among these random variables, and the absence of arcs refers to conditional independencies. The dependencies are qualified by the conditional probability of each node given its parent nodes in the network. Compared to other effective connectivity approaches, BN is relatively novel in the neuroimaging study of AD. Exploring the global effective connectivity pattern without any prior assumption, we hope the application of BN would provide us with more information specific to AD.
In this study, we used Group ICA to isolate the DMN map for each of the two groups and examined the disrupted functional connectivity in the network of AD patients as well as its association with clinical measures MMSE and CDR. We used the linear Gaussian BN [Geiger and Heckerman,1994; Heckerman,1995; Li et al.,2009; Shachter and Kenley,1989] to construct the effective connectivity patterns of the DMN in the groups of NC and AD, respectively. Nodes in the network are the core DMN brain regions, which determined by ICA in the current study. In addition to the BN effective connectivity investigation, we are interested in examining its difference between AD and NC. For this, we introduced statistical inference procedure, random permutation test. With the difference explored, BN may ultimately reveal a connectivity profile specific to clinical AD facilitating its use as an imaging marker for AD.
MATERIALS AND METHODS
Participants
Fifteen AD patients [6 males and 9 females, ages between 53 and 79 years (mean ± SD: 64.0 ± 8.3 years old), right‐handed, mean MMSE: 12, range, 0–20] and 16 elderly NCs [7 males and 9 females, ages between 47 and 79 years (65.1 ± 9.2 years old), right‐handed, mean MMSE: 29, range, 27–30] were scanned during the resting state condition. Subjects were instructed simply to keep their eyes closed and not to think of anything in particular. Sedation was not used for any patients, and significant movement was found on none of them. Handedness was determined by the Edinburgh Inventory [Oldfield,1971]. All participants were recruited and scanned at Tiantan Hospital, Beijing, China. The diagnosis of AD fulfilled the International Statistical Classification of Diseases and Related Health Problems 10th Revision (ICD‐10) criteria for dementia. The AD patients were free of other diseases, and the healthy controls were free of any known medical, neurological, and psychiatric disorders. Before this study, none of the patients had been on any medications for the cognitive impairments of AD and other classes of psychotherapy. Five of the 15 patients had a CDR score of 1 and 6 had CDR 2. The remaining four patients had CDR 3. We consider those patients with a CDR score of 1 to be mild, those with a CDR 2 to be moderate and 3 to be severe dementia [Morris,1993]. The purpose of the study was explained to the participants and/or caregivers. All participants gave written informed consent approved by a local institutional review board before the experiment. The MR scans were read clinically, and no patient included in this study was with evidence of a stroke or other focal pathology.
Data Acquisition
MRI scanning was performed on 3‐Tesla Siemens whole‐body MRI system at Tiantan Hospital in Beijing, China. Gradient echo‐planar imaging was used to acquire 20 axial slices (6‐mm thickness, 0‐mm gap, field of view, 256 × 256 mm2; matrix size, 64 × 64; repeat time, 2,000 ms; echo time, 30 ms; flip angle, 85°; 250 repetitions per time series). A high‐resolution T1‐weighted 3D MRI sequence with the following parameters was also acquired: 1‐mm thickness; 0‐mm gap; repeat time, 2,100 ms; echo time, 3.25 ms and flip angle, 10°.
Data Preprocessing
For each participant, the original first five‐time functional images were discarded to allow for equilibration of the magnetic field. All of the preprocessing steps were performed using SPM2 (http://www.fil.ion.ucl.ac.uk/spm). They included within‐subject interscan realignment to correct possible patient movement, between‐subject spatial normalization to a standard brain template in the Montreal Neurological Institute coordinate space and smoothing by a Gaussian filter with a full width at half maximum of 8 mm. Following this, the linear trend with regards to time was removed by linear regression.
Functional Connectivity Analysis
The preprocessed data of all participants were entered into the Group ICA program in the fMRI Toolbox (GIFT, http://www.icatb.sourceforge.net/), which included twice principle component analysis (PCA) reduction, ICA separation, and back‐reconstruction [Calhoun et al.,2001b]. The optimal number of principal components 59 for AD and 55 for NC, respectively, were estimated based on the minimum description length. In the first round of PCA, the data for each individual subject were dimension‐reduced to the optimal number temporally. After concatenation across subjects within groups, the dimensions were again reduced to the optimal numbers via the second round of PCA. Then the data were separated by ICA using the Extended Infomax algorithm [Lee et al.,1999]. After ICA separation, the mean ICs and the corresponding mean time courses over all the subjects were used for the back‐reconstruction of the ICs and the time courses for each individual subject [Calhoun et al.,2001b].
The independent component that best matched the DMN as previously reported was selected in each group. To do this, a DMN template was developed based on a dataset of regions reported previously [Greicius et al.,2004]. Each region in the template was a sphere with a radius of 5 mm (varying size of the sphere had no effect for the component identification). To determine the DMN among a number of independent components for a subject, the average intensity over voxels within each of the spheres minus that over voxels outside all spheres was for each component. Finally, the component that had the best‐fit was designated as DMN for this subject. After the conversion of the intensity values in each IC spatial map to Z‐scores, one sample t‐test (false discovery rate, FDR; P = 0.05) was then performed to determine the DMN for each of the two groups [Calhoun et al.,2001a]. Between group DMN differences was determined by two sample t‐tests (FDR, P = 0.05).
Defining the Regions of Interest
On the basis of the functional connectivity findings, we identified several core brain regions for a separate examination of their correlations with MMSE, the disease severity measure. Moreover, the effective connectivity among these regions was investigated by constructing the BN models separately for AD and NC groups. The BN‐based effective connectivity group difference was then assessed using the random permutation testing.
We first identified eight ROIs from the DMN functional connectivity map for NC and AD separately, which were used as the nodes of the BN models. Each of the eight ROIs was the intersection of the corresponding region defined by Anatomical Automatic Labeling atlas toolbox [Mazoyer et al.,2001] and the within group one sample t‐test map with a cut‐off threshold at P = 0.05 FDR. The list of ROIs is shown in Tables I and II. For each ROI, resting‐state time series were extracted by averaging the intensities over all voxels within the ROI at each time point for each individual. Time series of all the subjects within each group were then averaged to generate a single time series at each ROI for each group. Because there was no survived voxels at FDR P = 0.05 for left and right HC in the AD group, these two regions were defined with more lenient threshold of P = 0.1, uncorrected.
Table I.
Regions in the DMN map of NC group (one sample t‐test, FDR, P = 0.05, BA: Brodmann area)
| Brain region | BA | T value | Talairach coordinate | Volume | ||
|---|---|---|---|---|---|---|
| x | y | z | ||||
| Posterior cingulate cortex (PCC) | 23 | 17.42 | 3 | −51 | 17 | 1184 |
| Left inferior parietal cortex (lIPC) | 40 | 12.55 | −48 | −57 | 31 | 344 |
| Medial prefrontal cortex (MPFC) | 10 | 12.03 | 3 | 45 | 12 | 953 |
| Right inferior parietal cortex (rIPC) | 40 | 12.03 | 53 | −57 | 29 | 411 |
| Right inferior temporal cortex (rITC) | 21 | 8.54 | 62 | −7 | −16 | 251 |
| Left inferior temporal cortex (lITC) | 21 | 7.92 | −59 | −12 | −13 | 486 |
| Left hippocampus (lHC) | 36 | 4.44 | −30 | −33 | −5 | 135 |
| Right hippocampus (rHC) | 28 | 4.75 | 24 | −22 | −9 | 110 |
Table II.
Regions in DMN map of AD group (one sample t‐test, FDR, P = 0.05)
| Brain region | BA | T value | Talairach coordinate | Volume | ||
|---|---|---|---|---|---|---|
| x | y | z | ||||
| Posterior cingulate cortex (PCC) | 31 | 7.56 | 50 | −59 | 36 | 861 |
| Right inferior temporal cortex (rITC) | 20 | 4.63 | 65 | −35 | −5 | 52 |
| Right inferior parietal cortex (rIPC) | 40 | 7.34 | 9 | −51 | 21 | 340 |
| Left inferior parietal cortex (lIPC) | 40 | 6.97 | −48 | −56 | 40 | 279 |
| Medial prefrontal cortex (MPFC) | 9 | 4.75 | −9 | 42 | 24 | 255 |
| Left inferior temporal cortex (lITC) | 20 | 4.29 | −59 | −21 | −16 | 109 |
Correlating the Disease Severity With the Functional Connectivity Measures From the Core Brain Regions
The average Z‐score and the volume of the core brain regions defined over the IC map for each subject represented the intensity and the spatial extent of resting activity. They were extracted for all subjects and used to investigate their relationship with the disease severity measures, MMSE and CDR, with the use of linear regression analysis.
Effective Connectivity Analysis
For completeness, we briefly described the BN learning procedure here. For more comprehensive, detailed discussion, please refer to Geiger and Heckerman [1994], Heckerman [1995], and Shachter and Kenley [1989]. A BN is simply a graphical representation of the joint probability distribution over a set of random variables X = {X
1, X
2, … X
n}, which are the nodes of the graph, G. In our study, n = 8, and X
i is the measurements from ROI i. Given the nodes, the graph is determined by θ representing the set of the conditional probability distribution at each of the nodes in the network. For each node (variable) X
i (i = 1, 2, … n), the ith entry of θ is
 , denoting the conditional distribution of X
i given its parent node pa(X
i). With the assertions of conditional dependencies and independencies encoded by the network, the joint probability distribution P
B (X
1, X
2, … X
n) is actually equal to
, denoting the conditional distribution of X
i given its parent node pa(X
i). With the assertions of conditional dependencies and independencies encoded by the network, the joint probability distribution P
B (X
1, X
2, … X
n) is actually equal to
| (1) |
The BN we used for the effective connectivity study is of linear Gaussian assuming the time series of ROIs are Gaussian distributed. That is, let node X
i has parent node
 , then its conditional distribution is
| (2) |
where
 , u
i, and σi are, respectively, the conditional mean and conditional variance of node X
i given its parents pa(X
i), respectively; b
p, connection weight coefficient from parent node X
p to node X
i; u
i, unconditional mean of node X
i; μp, unconditional mean of parent node X
p.
, u
i, and σi are, respectively, the conditional mean and conditional variance of node X
i given its parents pa(X
i), respectively; b
p, connection weight coefficient from parent node X
p to node X
i; u
i, unconditional mean of node X
i; μp, unconditional mean of parent node X
p.
Bayesian information criterion (BIC) [Schwarz,1978] based learning approach was adopted to search for the highest scored network in the space of possible network structures. Formula of BIC is given by
| (3) |
in which the first term
 is the maximized log‐likelihood of data D conditional on θ*, which measures the degree goodness of given θ*, the maximum likelihood (ML) estimation of parameters. The second term
 is a penalty on the learned network complexity. Parameter d is the number of independent parameters, and m is the number of data samples. The BIC‐based BN learn procedure is implemented in the collections of Matlab functions, Bayesian Net Toolbox (BNT, http://www.cs.ubc.ca/ murphyk/Software/BNT/bnt.html). BNT was used to learn the BN model in this investigation.
To simplify the structure of the learned BN model, we adopted the step‐wise regression to test the significance of the connection, because the linear Gaussian BN identified can also be viewed as a set of determined multivariate linear regression equations [Li et al.,2009; Shachter and Kenley,1989]. That is, for each node in the Gaussian BN, it can be considered as the linear regression equation of its parent nodes in this network, and the weight coefficients turn to regression coefficients. Thus, the statistical significance of the regression coefficients was tested using stepwise regression. And then for each regression equation, the powerless variables (parent nodes) were discarded step by step till all the remnant variables were significant (P < 0.05). Finally, the set of tested regression equations were in turn expressed in the form of graph, which was the conclusively refined BN, that is, the effective connectivity model of DMN [Li et al.,2009].
Effective Connectivity Comparisons Between NC and AD Groups
We were more interested in examining the effective connectivity difference between AD and NC groups. To do this, we adopted the randomized permutation test [Gentle et al.,2004; Hesterberg et al.,2005; Scarff et al.,2004]. See additional rational in our Discussion section for our preference to this approach. The randomized permutation test is a type of nonparametric statistical test. To use this method to test the group difference, the reference distribution is obtained by calculating all possible values of the test statistic under rearrangements of the group labels on the observed data points. In a separate study by our group [Li et al.,2010], we proposed two ways to permute the data and compared both with the parametric counterpart, the two‐sample independent t test. Factors like the number of permutation, the robustness of the method, and the signal noise as well as the difference of subjects within group were all considered and tested by using the synthetic data and real fMRI data. Accordingly, we adopted the optimal permutation method to examine the group difference in effective connectivity in this study. At each iteration of the test process, the subject‐group membership was randomly assigned for each subject. A BN model for each group was constructed, and the differences of the connection weight coefficients between the two groups were taken as the statistical measure. Statistics for the real two group samples were calculated. We ran a total of 1,000 permutations (we found the results of 1,000 permutations are compatible with the ones obtained with 5,000 permutations) and assessed the sample distributions for these statistics. Finally, probabilities of the connections in the BN model of NC group that were stronger than the ones in AD group as well as the probabilities of the connections in the model of AD group that were stronger than the ones in NC group were examined for each of connections present the BN model for AD, NC, or both. Thus, we have total of 15 comparisons for NC > AD and 12 comparisons for AD > NC. To correct for the possible inflated type‐I errors, multiple comparisons were corrected using Bonferroni at P = 0.05.
RESULTS
Functional Connectivity Result of the DMN
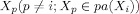
Figure 1 shows the group DMN results in the NC (left panel) and AD (right panel), respectively, detected by Group ICA followed by one sample t‐test with FDR P = 0.05. DMN in NC includes PCC/precuneus, MPFC, lITC, rITC, lHC, rHC, lIPC, and rIPC. DMN in AD mainly involves PCC, MPFC, lITC, rITC, lIPC, and rIPC.
Figure 1.
DMN of the NC and AD groups. Axial images show the network for the NC (left panel) and AD (right panel) groups, respectively. The white capital letters indicate the specific regions in the DMN. A: PCC, B: MPFC, C: lIPC, D: rIPC, E: lITC, F: rITC, G: lHC, H: rHC. T score bar is shown on the right (FDR, P = 0.05). [Color figure can be viewed in the online issue, which is available at wileyonlinelibrary.com.]
Difference in DMN Functional Connectivity Between the NC and AD Groups
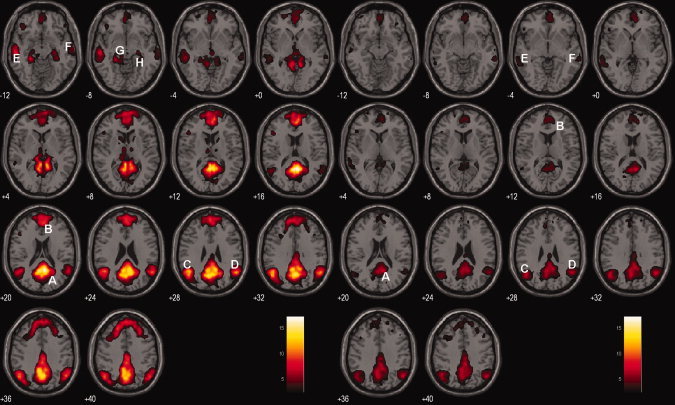
As shown in Figure 1, the resting‐state DMN in NC is more intensified in magnitude and more broadly distributed spatially than what seen in AD. To quantify the network group difference, we used voxel‐wise two sample t‐test. Figure 2 and Table III display the functional connectivity differences between the two groups. The following areas of the DMN demonstrated reduced activity in AD: PCC, MPFC, lIPC, lITC, and bilateral HC. There was no region in DMN, which was increased in AD compared to NC.
Figure 2.
Difference in the functional connectivity of DMN between the NC and AD groups (NC vs. AD). Two sample t‐test (FDR, P = 0.05). [Color figure can be viewed in the online issue, which is available at wileyonlinelibrary.com.]
Table III.
Regions of the DMN demonstrating reduced activity in AD group (two sample t‐test, FDR, P = 0.05)
| Brain region | BA | T value | Talairach coordinate | Volume | ||
|---|---|---|---|---|---|---|
| x | y | z | ||||
| Posterior cingulate cortex (PCC) | 29 | 8.42 | −3 | −43 | 10 | 452 |
| Medial prefrontal cortex (MPFC) | 10 | 6.27 | 3 | 44 | 13 | 173 |
| Left inferior parietal cortex (lIPC) | 40 | 5.64 | −50 | −51 | 28 | 55 |
| Left inferior temporal cortex (lITC) | 21 | 5.54 | −53 | −21 | −9 | 36 |
| Left hippocampus (lHC) | 36 | 3.77 | −33 | −19 | −16 | 28 |
| Right hippocampus (rHC) | 37 | 3.55 | 24 | −18 | −13 | 19 |
Relationship Between Functional Connectivity Measures and Disease Severity
The results of linear regression analysis showed the relationship between the disease severity and the functional connectivity measures obtained from the core regions used in the subsequent BN analysis. Significant MMSE correlations with the connectivity intensity were found at PCC (r = 0.55, P = 0.0355), rIPC (r = 0.55, P = 0.0342), and rITC (r = 0.52, P = 0.0494). Similarly, significant MMSE correlations with the connectivity extent were found at PCC (r = 0.56, P = 0.0303) and rITC (r = 0.52, P = 0.0476). We noted that no attempt was made to correct for the multiple comparisons over the number of these core regions, and no core region showed statistical correlation with CDR index.
Within‐Group DMN Effective Connectivity
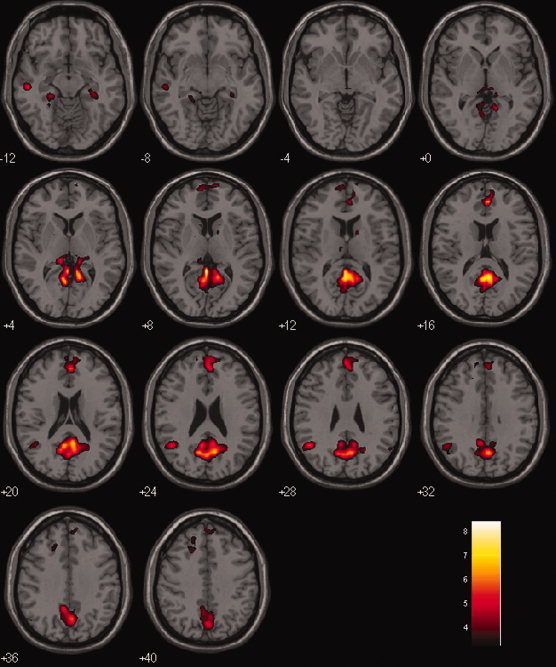
The two panels of Figure 3 display the effective connectivity models learned by the linear Gaussian BN, for the NC and AD groups, respectively. Connection directions and the corresponding weight coefficients of the BN models are given in Table IV.
Figure 3.
Effective connectivity models (BN models) of DMN in NC (left panel) and AD group (right panel). The color gradation (with the color bar) is proportional to the connection strength. Connections are tested with significance level P = 0.05. The asterisk (*) on connection indicates the connection in NC is significantly stronger than in AD while the cross (+) points out the opposite. The 3D coordinate system depicts the Talairach system where x‐axis is the left/right of the brain, y‐axis back/front of the brain, and the z‐axis bottom to the top of the brain. Each of the brain regions is plotted at its center in the figure. [Color figure can be viewed in the online issue, which is available at wileyonlinelibrary.com.]
Table IV.
List of connections and the corresponding weight coefficients in the BN models of NC group and AD group
| Connections | Weight Coefficients | ||
|---|---|---|---|
| NC | AD | ||
| I | lIPC → PCC | 0.90 | 0.68 |
| lIPC → rIPC | 0.94 | 0.27 | |
| lITC → lIPC | 0.62 | 0.98 | |
| lITC→ rITC | 0.91 | 0.51 | |
| II | lHC → lIPC* | 0.46 | |
| lITC→ rIPC | −0.75 | ||
| lITC → rHC* | 0.37 | ||
| rHC → lIPC* | −0.40 | ||
| rHC→ MPFC* | 0.40 | ||
| rHC → PCC* | 0.29 | ||
| rITC → lIPC | 0.36 | ||
| PCC → MPFC | 0.29 | ||
| III | lHC → PCC | 0.36 | |
| lIPC→ MPFC | 0.30 | ||
| PCC → rIPC | 0.63 | ||
| PCC → rITC | 0.26 | ||
| rITC → MPFC | 0.36 | ||
| IV | lHC → rHC* | 0.77 | |
| rHC → lHC+ | 0.29 | ||
| lITC → lHC* | 0.50 | ||
| lHC → lITC | 0.38 | ||
| rITC → rIPC | 0.60 | ||
| rIPC → rITC | 0.27 | ||
Note: Connections in rows of part I co‐exist in the two groups. Connections in rows of parts II and III are only present in NC or AD groups respectively. Connections in rows of part IV show connections with reversed directions in the two groups. All the connections listed in the table survived from the statistical testing (significance level: P < 0.05) during the stepwise regression analysis within group. The asterisk (*) on connection indicates the connection in NC is significantly stronger than in AD while the cross (+) points out the opposite determined from the permuatation test with multiple comparison Bonferroni, P = 0.05.
Connections that were observed both in NC and AD groups included lIPC → PCC, lIPC→ rIPC, lITC → lIPC, and lITC → rITC, all have larger weight coefficients in NC except lITC → lIPC.
Connections lHC → lIPC, lITC → rHC, lITC→ rIPC, rHC → lIPC, rHC → MPFC, rHC → PCC, rITC → lIPC, and PCC → MPFC are present only in the NC group, not in the AD group. Although connections lHC → PCC, lIPC → MPFC, PCC → rIPC, PCC → rITC, and rITC → MPFC are present only in the AD group.
Connections between lHC and rHC, lITC and lHC, rITC and rIPC are all present in the BN models of both groups but with reversed directionality.
Between‐Group DMN Effective Connectivity Difference
Randomized permutation test provided the probabilities of differences in connections between groups, as shown in Table V. Between‐group connection differences that are significant with Bonferroni correction are highlighted as bold fonts. The first two columns of Table V display the type‐I errors of the connections in NC stronger than the ones in AD (NC > AD), and the other two columns show the type‐I errors for the opposite direction (AD > NC). We found that connections lHC → lIPC, lHC → rHC, lITC → lHC, lITC → rHC, rHC → lIPC, rHC → MPFC, and rHC → PCC were greater in NC than the corresponding ones in AD (Bonferroni P = 0.05). In the opposite direction, we found that connection rHC → lHC was less strong in NC than in AD (Bonferroni P = 0.05).
Table V.
Results of comparison of the BN models in NC and AD groups derived from permutation test
| NC > AD | AD > NC | ||
|---|---|---|---|
| Connections in NC | Probabilities | Connections in AD | Probabilities |
| lHC → lIPC | 0 | lHC → lITC | 0.012 |
| lHC → rHC | 0 | lHC → PCC | 0.095 |
| lIPC → PCC | 0.260 | lIPC → MPFC | 0.071 |
| lIPC → rIPC | 0.066 | lIPC → PCC | 0.740 |
| lITC → lHC | 0 | lIPC → rIPC | 0.934 |
| lITC → lIPC | 0.879 | lITC → lIPC | 0.121 |
| lITC → rHC | 0 | lITC → rITC | 0.980 |
| lITC→ rIPC | 0.020 | PCC → rIPC | 0.008 |
| lITC → rITC | 0.020 | PCC → rITC | 0.016 |
| PCC → MPFC | 0.142 | rHC → lHC | 0 |
| rHC → lIPC | 0 | rIPC → rITC | 0.063 |
| rHC → MPFC | 0.001 | rITC → MPFC | 0.077 |
| rHC → PCC | 0.002 | ||
| rITC → lIPC | 0.109 | ||
| rITC → rIPC | 0.030 | ||
Note: The column “NC > AD” shows the type‐I error probabilities (in the column “probabilities”) of the connections in NC group that are stronger than the ones in AD group. And the column “AD > NC” shows the contrary case. Connections marked in bold represent the hypothesis “NC > AD” or “AD > NC” are reliable with multiple comparison Bonferroni, P = 0.05.
DISCUSSION
In this study, we first used Group ICA to detect functional DMN connectivity in the NC and AD groups, respectively. We then examined functional connectivity difference between AD and NC groups via two‐sample t‐test. Core regions in the network that showed significant reductions in AD include PCC, MPFC, IPC, ITC, and HC. Our DMN findings reconfirmed reports from several previous studies [Greicius et al.,2004; Wang et al.,2006]. Interestingly, the connectivity and spatial extents are associated with the disease severity (MMSE) in several DMN core regions such as PCC, rIPC, and rITC.
Furthermore, we used linear Gaussian BN to investigate the DMN effective connectivity in each group. In conjunction with BN, we used random permutation test to assess the effective connectivity group difference. Significant and multiple differences were uncovered in patterns of effective connectivity in brain regions that were known to be affected by AD.
About Methodology
Effective connections pointed to a specific brain region are indicative that activity of this region is statistically dependent on the activities of regions the connection originated from (parent regions). In other words, knowledge about the activity of this region can be learned based on the ones of its parents. The BN‐based effective connection structures allow us to examine the difference between AD and NC in a more meaningful way, raising the possibility to use BN as a means to help to understand/reconfirm the neuronal mechanism of AD and even eventually as a sensitive biomarker for AD.
As an effective connectivity tool, the BN approach simultaneously learns the structure of the effective connectivity and estimates the associated parameters. This is in contrast to other effective connectivity techniques such as SEM, DCM, and GCM. These techniques are often used to determine whether a previously known or hypothesized neural system model is valid other than to learn a suitable global model from the data. The structures of those models were derived independently or by anatomical constraints. Especially for resting‐state analysis, it is more difficult to make the prior models for the effective connectivity. The current result showed the BN can learn large or unexplored networks from resting‐state fMRI data without proper prior models or knowledge.
In this study, the functional and effective connectivity analyses were applied to the same dataset successively and referred to as ICA + BN procedure below. In other words, the core regions in the DMN were first identified from Group ICA and were subsequently used to constitute the nodes in the BN effective connectivity analysis. We noticed that our way of using ICA + BN procedure was not conceptually novel. Zheng and Rajapakse [2006] used BN to learn the effective connections in silent word reading and counting Stroop tasks. In another study, Rajapakse et al. [2007] used the dynamic BN (DBN), an extension of BN, to learn the effective connectivity in the same tasks [Rajapakse and Zhou,2007]. Nodes in these two studies were the activated brain regions identified from first performing SPM analysis over the same dataset (SPM + BN/DBN). Additionally, Kim et al. [2008] used DBN to examine the effective connectivity difference in schizophrenia during an auditory paradigm, and ICA was used to reduce the noise in all the fMRI data [Kim et al.,2008]. And the nodes in the DBN were also the regions showing significant activity from SPM analysis (ICA + SPM + DBN). Steven et al. [2009] and Liao et al. [2010] used “ICA + Granger causality analysis” to learn the interaction patterns between resting brain networks, the nodes of their Granger procedure were based on ICA over fMRI data from subjects included in their study [Liao et al.,2010; Stevens et al.,2009].
Despite the repeated use of the conceptually same procedures discussed above in a number of studies, the assessment of the reliability (or the statistical errors) of the nodes is an important issue. Possible solution includes the use of independent dataset for the node definition or proper statistical inference to address this error.
We note that our permutation test (discussed more below) was only for the constructed BN but not for the selection of the ICA‐based core regions. Although the within‐group one sample t‐test with the corrected P‐value (using FDR, P = 0.05) for the Group ICA procedure might be adequate for assessing the type‐I error in defining the core regions of the DMN for each group, we also examined post hoc defining the core regions irrespective the group membership, use of core regions reported previously, and the Group ICA analysis in a randomly partitioned training dataset (60% of the cases). In terms of the BN structures obtained from core regions defined by these different approaches, we note a number of connections common to all approaches were preserved. More interestingly and importantly, permutation results demonstrated that group differences between AD and NC can be detected using any of these different ROI definition approaches, but different levels of detecting sensitivity, as expected. With these additional analyses, we recommend the use of AD/NC specific core DMN regions for the effective connectivity analysis.
As mentioned earlier, we used the nonparametric randomized permutation test to examine the BN‐based effective connectivity patterns between NC and AD groups. The difference in connection weight coefficients between the two groups was taken as the test statistic. By calculating all the possible values of this statistic through regrouping the subjects, the sampling distribution of the test statistic can be obtained and used to examine the value of this statistic occurring by chance under the unpermuted group membership. This randomized permutation test is performed under the basic premise that all the tested groups are assumed to be possibly equivalent. As a distribution‐free testing method, permutation test is applicable regardless of whether or not its theoretical distribution is known.
We noticed that the permutation test addressed only the error sources related to the subject level (group membership) but not the measurement errors in the temporal fMRI time series extracted from each ROI. We believe that error source was accounted in the BN learning process (so the ML approach assuming the data is Gaussian) and it contributed to the uncertainty (type‐I error) of the group difference. In addition to being accounted for in the BN parameter estimation approach, other approach such as Bootstrap has also been suggested. The Bootstrap method, however, may have some unexpected side effects when the temporality of the data is lost out of the resampling. With these beliefs, we did not attempt to address this error source as part of our permutation test or using any other alternative.
We also note that the multiple comparison correction with regards to the permutation test is unnecessary for the omnibus hypothesis that the BN learned network in AD is the same as the one in NC [Nichols and Holmes,2001]. We also notice that the number of occurrences corresponding to the type‐I error threshold (P = 0.05) can be used in inference to the individual connection examination. To be confirmative and to show how strong the group difference is, we noted the connections that were significant even with correction by the very conservative Bonferroni procedure. Of course, all these considerations call for larger and careful planned future studies.
A potential implementation of the integrated ICA + BN procedure in practical use can be justified, for example, with the existence of a normative database for normal healthy controls. Thus, the normal DMN core regions are unchanged, and the patient group's core region will be constructed for new subjects. If this integrated procedure can be validated in additional future studies with adequate sensitivity and specificity, the concerns on the repeated use of the same dataset for first ICA and then BN can be lessened.
About Resting‐State Network
Our BN‐based effective connectivity findings can be briefly summarized as below: compared to NC, the connectivity changes in AD included (1) the loss of connections from lHC to lIPC, from lITC to rHC, from rHC to lIPC, MPFC and PCC and (2) connections from rHC to lHC, from lHC to lITC, and from rIPC to rITC all changed the directions. Overall, total number of connections in AD is lower than the one in the NC (15 in NC and 12 in AD), a reflection of disrupted connections, consistent with the functional connectivity findings.
The disrupted connection between PCC and HC is hypothesized to be the mechanism behind PCC hypometabolism and hypoperfusion in early AD [Greicius et al.,2004; Wang et al.,2006]. In our study, the direct and directional connection from rHC to PCC in NC are switched to lHC to PCC in AD group, the former connection being significant with Bonferroni P = 0.05, but not the latter. An indirect link from lHC to lIPC and then PCC in NC may be replaced in the AD group with a weaker lHC to lITC to lIPC to PCC. These alternations provided additional evidence of the disrupted connections between PCC and HC, or more generally between PCC and MTL [Greicius et al.,2004]. As indicated in Greicius et al. [2004], at the neuronal level, connectivity between these two regions has been demonstrated in animal studies [Lavenex et al.,2002; Morris et al.,1999; Suzuki and Amaral,1994; Vogt et al.,1992].
The most prominent change in connectivity is that the connections of the rHC to other regions, except lHC, within the BN were all statistically in‐distinguishable from 0. The rHC is typically a larger structure than the left in volumetric studies [Pedraza et al.,2004], with evidence that it atrophies faster than the lHC in AD [Barnes et al.,2005; Bigler et al.,2000; Hashimoto et al.,2001; Lehtovirta et al.,1995]. Together with our findings, this implies an increased right hippocampal pathological and functional burden in AD [Geroldi et al.,2000; Soininen et al.,1995]. Reduced connectivity between the HC and the PCC is hypothesized to explain the decreased metabolism in the PCC in early AD [Minoshima et al.,1997]. Our finding is consistent with Greicius et al. [2004]'s study showing decreased HC‐PCC connectivity and is also compatible with a disconnection hypothesis.
In addition, our findings indicate global reduction in connectivity between all nodes within the DMN, with notable loss of intrahemispheric connectivity. Importantly, there is also clear reorganization of MPFC and PCC connectivity with other regional of the DMN. These two midline regions are the most prominently activated regions within the DMN in healthy individuals [Andrews‐Hanna et al.,2007; Buckner et al.,2005,2008]. They represent a direct connection between frontal and posterior DMN networks, which appear to be lost in AD [Buckner and Vincent,2007; Buckner et al.,2005; Raichle and Snyder,2007]. This is consistent with observations of the PCC being a region of early and prominent amyloid pathology [Braak and Braak,1991; Buckner et al.,2005; Forsberg et al.,2008; Fripp et al.,2008; Klunk et al.,2004; Mintun et al.,2006; Pike et al.,2007] and its relationship to hippocampal function [Pike et al.,2007].
Our results showed the absence of IPC to MPFC in NC and the presence of this connection in AD group. In a previous study, decreased positive correlations between prefrontal and parietal regions were observed in AD patients. It is quite possible that our MPFC ROI excluded the prefrontal region in the voxel‐based analysis. On the other hand, however, our findings also support the use of frontal‐parietal connection difference between AD and NC as a biomarker [Wang et al.,2007]. As noted by the authors of the same study, there is a need to consider not only the positive inter‐regional correlations but also the negative one [Fox et al.,2005; Fransson,2005; Wang et al.,2007]. These patterns of change in the DMN may represent early biomarkers of change associated with AD pathology. It will be important to further explore the natural history of these patterns in earlier clinical disease and risk for AD to determine their value in prediction of impending dementia, prognosis, and for the development of preventative treatment strategies.
In addition to examining primarily the group differences based on the BN metrics, we also tested the association between disease severity measures (MMSE and CDR) and the functional connectivity measures represented by intensity and extent of core regions of the DMN in the AD subjects. Both connectivity intensities and/or connectivity extents were found positively correlated with MMSE in a number of these core brain regions (P < 0.05). MMSE is for assessing the ability in arithmetic, memory, and orientation of subjects in clinic [Folstein et al.,1975] and has been widely used in all major AD studies (such as AD Neuroimaging Initiative, ADNI) and for routine clinical diagnoses. Consistent with the memory deficit as the common landmark in early AD patients [Perry et al.,2000; Schmand et al.,2000] and the roles the PCC, rITC, and rIPC played in the memory process, results of this study suggested that these regions are correlated with the disease severity. Particularly, PCC is suggested to be involved in episodic memory function [Della‐Maggiore et al.,2000; Greicius et al.,2004; Maddock et al.,2001; Maguire and Mummery,1999], and it is the most common region showing early metabolic and perfusion abnormalities in AD [Greicius et al.,2004] or even before the onset of the disease [Reiman et al.,1996]. As the end of ventral visual stream [Tanaka,1996], rITC is considered to be the repository of long‐term memory processing [Miyashita,1993]. A previous correlation study of DMN has observed decreased activity in the region of rITC in AD [Wang et al.,2007]. In addition, the bilateral IPC is also frequently activated during working memory tasks in both humans and animals [Binder et al.,1999; Gusnard and Raichle,2001], and our results demonstrated the intensity of resting activity in rIPC was correlated with the MMSE score. Overall, the positive correlations in PCC, rITC, and rIPC with MMSE might be indicative that the AD patients with lower MMSE score were associated with more inhibited resting activity in intensity or extent.
In conclusion, besides confirming findings from previous study about the different functional connectivity in AD patients, our study finds significant differences between AD and NC in terms of the BN‐based effective connectivity with the use of random permutation test. In addition to its application to the study of AD, the approach used in this study could potentially be useful to establish image‐based markers in other neurodegenerative diseases such as Parkinson disease. We also expect that it might be used in the study of normal aging process serving as a potentially sensitive marker. Of course, additional studies are needed to confirm these potential broader applications, and it is also our interest to further investigate this approach and others to explore the full potential of the richness of the resting fMRI technique.
REFERENCES
- Andrews‐Hanna JR, Snyder AZ, Vincent JL, Lustig C, Head D, Raichle M, Buckner RL ( 2007): Disruption of large‐scale brain systems in advanced aging. Neuron 56: 924–935. [DOI] [PMC free article] [PubMed] [Google Scholar]
- Aupee AM, Desgranges B, Eustache F, Lalevee C, de la Sayette V, Viader F, Baron JC ( 2001): Voxel‐based mapping of brain hypometabolism in permanent amnesia with PET. NeuroImage 13: 1164–1173. [DOI] [PubMed] [Google Scholar]
- Barnes L, Wilson R, Bienias J, Schneider J, Evans D, Bennett D ( 2005): Sex differences in the clinical manifestations of Alzheimer disease pathology. Arch Gen Psychiatry 62: 685–691. [DOI] [PubMed] [Google Scholar]
- Bigler E, Lowry C, Anderson C, Johnson S, Terry J, Steed M ( 2000): Dementia, quantitative neuroimaging, and apolipoprotein E genotype. Am J Neuroradiol 21: 1857–1868. [PMC free article] [PubMed] [Google Scholar]
- Binder J, Frost J, Hammeke T, Bellgowan P, Rao S, Cox R ( 1999): Conceptual processing during the conscious resting state: A functional MRI study. J Cogn Neurosci 1: 80–93. [DOI] [PubMed] [Google Scholar]
- Blennow K, de Leon MJ, Zetterberg H ( 2006): Alzheimer's disease. Lancet 368: 387–403. [DOI] [PubMed] [Google Scholar]
- Bluhm RL, Miller J, Lanius RA, Osuch EA, Boksman K ( 2007): Spontaneous low‐frequency fluctuations in the BOLD signal in schizophrenic patients: Anomalies in the default network. Schizophr Bull 33: 1004–1012. [DOI] [PMC free article] [PubMed] [Google Scholar]
- Braak H, Braak E ( 1991): Neuropathological stageing of Alzheimer‐related changes. Acta Neuropathol (Berl) 82: 239–259. [DOI] [PubMed] [Google Scholar]
- Buckner RL, Vincent JL ( 2007): Unrest at rest: Default activity and spontaneous network correlations. NeuroImage 37: 1091–1096. [DOI] [PubMed] [Google Scholar]
- Buckner R, Snyder A, Shannon B, LaRossa G, Sachs R, Fotenos AF, Sheline YI, Klunk WE, Mathis CA, Morris JC, Mintun MA ( 2005): Molecular, structural, and functional characterization of Alzheimer's disease: Evidence for a relationship between default activity, amyloid, and memory. J Neurosci 25: 7709–7717. [DOI] [PMC free article] [PubMed] [Google Scholar]
- Buckner RL, Andrews‐Hanna JR, Schacter DL ( 2008): The brain's default network: Anatomy, function, and relevance to disease. Ann NY Acad Sci 1124: 1–38. [DOI] [PubMed] [Google Scholar]
- Calhoun VD, Adali T, McGinty VB, Pekar JJ, Watson TD, Pearlson GD ( 2001a) fMRI activation in a visual‐perception task: Network of areas detected using the general linear model and independent components analysis. NeuroImage 14: 1080–1088. [DOI] [PubMed] [Google Scholar]
- Calhoun VD, Adali T, Pearlson GD, Pekar JJ ( 2001b) A method for making group inferences from functional MRI data using independent component analysis. Hum Brain Mapp 14: 140–151. [DOI] [PMC free article] [PubMed] [Google Scholar]
- Celone KA, Calhoun VD, Dickerson BC, Atri A, Chua EF, Miller SL, DePeau K, Rentz DM, Selkoe DJ, Blacker D, et al.( 2006): Alterations in memory networks in mild cognitive impairment and Alzheimer's disease: An independent component analysis. J Neurosci 26: 10222–10231. [DOI] [PMC free article] [PubMed] [Google Scholar]
- Cherkassky VL, Kana RK, Keller TA, Just MA ( 2006): Functional connectivity in a baseline resting‐state network in autism. Neuroreport 17: 1687–1690. [DOI] [PubMed] [Google Scholar]
- Damoiseaux JS, Rombouts SARB, Barkhof F, Scheltens P, Stam CJ, Smith SM, Beckmann CF ( 2006): Consistent resting‐state networks across healthy subjects. Proc Natl Acad Sci 103: 13848–13853. [DOI] [PMC free article] [PubMed] [Google Scholar]
- Della‐Maggiore V, Sekuler AB, Grady CL, Bennett PJ, Sekuler R, McIntosh AR ( 2000): Corticolimbic interactions associated with performance on a short‐term memory task are modified by age. J Neurosci 20: 8410–8416. [DOI] [PMC free article] [PubMed] [Google Scholar]
- Demirci O, Stevens MC, Andreasen NC, Michael A, Liu J, White T, Pearlson GD, Clark VP, Calhoun VD ( 2009): Investigation of relationships between fMRI brain networks in the spectral domain using ICA and Granger causality reveals distinct differences between schizophrenia patients and healthy controls. NeuroImage 46: 419–431. [DOI] [PMC free article] [PubMed] [Google Scholar]
- Folstein MF, Folstein SE, McHugh PR ( 1975): “Mini‐mental state”: A practical method for grading the cognitive state of patients for the clinician. J Psychiatr Res 12: 189–198. [DOI] [PubMed] [Google Scholar]
- Forsberg A, Engler H, Almkvist O, Blomquist G, Hagman G, Wall A, Ringheim A, Langstrom B, Nordberg A ( 2008): PET imaging of amyloid deposition in patients with mild cognitive impairment. Neurobiol Aging 29: 1456–1465. [DOI] [PubMed] [Google Scholar]
- Fox MD, Snyder AZ, Vincent JL, Corbetta M, Van Essen DC, Raichle ME ( 2005): The human brain is intrinsically organized into dynamic, anticorrelated functional networks. Proc Natl Acad Sci 102: 9673–9678. [DOI] [PMC free article] [PubMed] [Google Scholar]
- Fransson P ( 2005): Spontaneous low‐frequency BOLD signal fluctuations: An fMRI investigation of the resting‐state default mode of brain function hypothesis. Hum Brain Mapp 26: 15–29. [DOI] [PMC free article] [PubMed] [Google Scholar]
- Fripp J, Bourgeat P, Acosta O, Raniga P, Modat M, Pike KE, Jones G, O'Keefe G, Masters CL, Ames D, Ellis KA, Maruff P, Currie J, Villemagne VL, Rowe CC, Salvado O, Ourselin S ( 2008): Appearance modeling of 11C PiB PET images: Characterizing amyloid deposition in Alzheimer's disease, mild cognitive impairment and healthy aging. NeuroImage 43: 430–439. [DOI] [PubMed] [Google Scholar]
- Friston KJ ( 1994): Functional and effective connectivity in neuroimaging: A synthesis. Hum Brain Mapp 2: 56–78. [Google Scholar]
- Friston KJ, Frith CD, Liddle PF, Frackowiak RS ( 1993): Functional connectivity: The principal‐component analysis of large (PET) data sets. J Cereb Blood Flow Metab 13: 5–14. [DOI] [PubMed] [Google Scholar]
- Friston KJ, Harrison L, Penny W ( 2003): Dynamic causal modelling. NeuroImage 19: 1273–1302. [DOI] [PubMed] [Google Scholar]
- Geiger D, Heckerman D ( 1994): Learning Gaussian networks. Technical Report MSR‐TR‐94–10.
- Gentle JE, Härdle W, Mori Y ( 2004): Handbook of Computational Statistics—Concepts and Methods. New York: Springer. [Google Scholar]
- Geroldi C, Laakso M, DeCarli C ( 2000): Apolipoprotein E genotype and hippocampal asymmetry in Alzheimer's disease: A volumetric MRI study. J Neurol Neurosurg Psychiatry 68: 93–96. [DOI] [PMC free article] [PubMed] [Google Scholar]
- Ghatan PH, Hsieh JC, Wirsen‐Meurling A, Wredling R, Eriksson L ( 1995): Brain activation induced by the perceptual maze test: A PET study of cognitive performance. NeuroImage 2: 112–124. [DOI] [PubMed] [Google Scholar]
- Gilbert SJ, Dumontheil I, Simons JS, Frith CD, Burgess PW ( 2007): Comment on “wandering minds: The default network and stimulus‐independent thought”. Science 317: 43b. [DOI] [PubMed] [Google Scholar]
- Goebel R, Roebroeck A, Kim D‐S, Formisano E ( 2003): Investigating directed cortical interactions in time‐resolved fMRI data using vector autoregressive modeling and Granger causality mapping. Magn Reson Imaging 21: 1251–1261. [DOI] [PubMed] [Google Scholar]
- Greicius MD, Krasnow B, Reiss AL, Menon V ( 2003): Functional connectivity in the resting brain: A network analysis of the default mode hypothesis. Proc Natl Acad Sci 100: 253–258. [DOI] [PMC free article] [PubMed] [Google Scholar]
- Greicius MD, Srivastava G, Reiss AL, Menon V ( 2004): Default‐mode network activity distinguishes Alzheimer's disease from healthy aging: Evidence from functional MRI. Proc Natl Acad Sci 101: 4637–4642. [DOI] [PMC free article] [PubMed] [Google Scholar]
- Gusnard DA, Raichle ME ( 2001): Searching for a baseline: Functional imaging and the resting human brain. Nat Rev Neurosci 2: 685–694. [DOI] [PubMed] [Google Scholar]
- Hahn B, Ross TJ, Stein EA ( 2007): Cingulate activation increases dynamically with response speed under stimulus unpredictability. Cereb Cortex 17: 1664–1671. [DOI] [PMC free article] [PubMed] [Google Scholar]
- Hashimoto M, Yasuda M, Tanimukai S ( 2001): Apolipoprotein E epsilon 4 and the pattern of regional brain atrophy in Alzheimer's disease. Neurology 57: 1461–1466. [DOI] [PubMed] [Google Scholar]
- Heckerman D ( 1995): A tutorial on learning with Bayesian networks. Technical Report MSR‐TR‐95–06.
- Hesterberg T, Moore DS, Monaghan S, Clipson A, Epstein R. 2005. Bootstrap Methods and Permutation Tests, 2nd ed. New York: W. H. Freeman. [Google Scholar]
- Johnson KA, Jones K, Holman BL, Becker JA, Spiers PA, Satlin A, Albert MS ( 1998): Preclinical prediction of Alzheimer's disease using SPECT. Neurology 50: 1563–1571. [DOI] [PubMed] [Google Scholar]
- Kelley WM, Macrae CN, Wyland CL, Caglar S, Inati S, Heatherton TF ( 2002): Finding the self? An event‐related fMRI study. J Cogn Neurosci 14: 785–794. [DOI] [PubMed] [Google Scholar]
- Kim D, Burge J, Lane T, Pearlson GD, Kiehl KA, Calhoun VD ( 2008): Hybrid ICA‐Bayesian network approach reveals distinct effective connectivity differences in schizophrenia. NeuroImage 42: 1560–1568. [DOI] [PMC free article] [PubMed] [Google Scholar]
- Klunk WE, Engler H, Nordberg A, Wang Y, Blomgvist G, Holt DP, Bergström M, Savitcheva I, Huang GF, Estrada S, Ausén B, Debnath ML, Barletta J, Price JC, Sandell J, Lopresti BJ, Wall A, Koivisto P, Antoni G, Mathis CA, Långström B ( 2004): Imaging brain amyloid in Alzheimer's disease with Pittsburgh Compound‐B. Ann Neurol 55: 306–319. [DOI] [PubMed] [Google Scholar]
- Lavenex P, Suzuki WA, Amaral DG ( 2002): Perirhinal and parahippocampal cortices of the macaque monkey: Projections to the neocortex. J Comp Neurol 447: 394–420. [DOI] [PubMed] [Google Scholar]
- Lee T‐W, Girolami M, Sejnowski TJ ( 1999): Independent component analysis using an extended infomax algorithm for mixed subgaussian and supergaussian sources. Neural Computation 11: 417–441. [DOI] [PubMed] [Google Scholar]
- Lehtovirta M, Laakso M, Soininen H ( 1995): Volumes of hippocampus, amygdala and frontal lobe in Alzheimer patients with different apolipoprotein E genotypes. Neuroscience 67: 65–72. [DOI] [PubMed] [Google Scholar]
- Li R, Chen K, Zhang N, Fleisher AS, Yao L, Wu X ( 2009): Effective connectivity analysis of default mode network based on the Bayesian network learning approach. Proc SPIE 7262: 72621W‐1–10. [Google Scholar]
- Li R, Chen K, Li J, Fleisher AS, Reiman EM, Yao L, Wu X ( 2010): Deriving difference between the Bayesian networks based patterns of the effective connectivity using permutation test in fMRI studies. Proceedings of the CME2010 Conference: 85–90, Gold Coast, Australia.
- Liao W, Mantini D, Zhang Z, Pan Z, Ding J, Gong Q, Yang Y, Chen H ( 2010): Evaluating the effective connectivity of resting state networks using conditional Granger causality. Biol Cybern 102: 57–69. [DOI] [PubMed] [Google Scholar]
- Lustig C, Snyder AZ, Bhakta M, O'Brien KC, McAvoy M, Raichle ME, Morris JC, Buckner RL ( 2003): Functional deactivations: Change with age and dementia of the Alzheimer type. Proc Natl Acad Sci 100: 14504–14509. [DOI] [PMC free article] [PubMed] [Google Scholar]
- Maddock R, Garrett A, Wu C, Buonocore M ( 2001): Autobiographical memory retrieval and posterior cingulate cortex activation in early Alzheimer's disease. NeuroImage 13( 6 Suppl 1, ): 705–705. [Google Scholar]
- Maguire E, Mummery C ( 1999): Differential modulation of a common memory retrieval network revealed by positron emission tomography. Hippocampus 9: 54–61. [DOI] [PubMed] [Google Scholar]
- Margulies DS, Kelly AMC, Uddin LQ, Biswal BB, Castellanos FX, Milham MP ( 2007): Mapping the functional connectivity of anterior cingulate cortex. NeuroImage 37: 579–588. [DOI] [PubMed] [Google Scholar]
- Matsuda H ( 2001): Cerebral blood flow and metabolic abnormalities in Alzheimer's disease. Ann Nucl Med 15: 85–92. [DOI] [PubMed] [Google Scholar]
- Mazoyer B, Zago L, Mellet E, Bricogne S, Etard O, Houde O, Crivello F, Joliot M, Petit L, Tzourio‐Mazoyer N ( 2001): Cortical networks for working memory and executive functions sustain the conscious resting state in man. Brain Res Bull 54: 287–298. [DOI] [PubMed] [Google Scholar]
- McIntosh AR, Gonzalez‐Lima F ( 1994): Structural equation modeling and its application to network analysis in functional brain imaging. Hum Brain Mapp 2: 2–22. [Google Scholar]
- McIntosh AR, Grady CL, Haxby JV, Ungerrleider LG, Horwitz B ( 1996): Changes in limbic and prefrontal functional interactions in a working memory task for faces. Cereb Cortex 6: 571–584. [DOI] [PubMed] [Google Scholar]
- Minoshima S, Giordani B, Berent S, Frey KA, Foster NL, Kuhl DE ( 1997): Metabolic reduction in the posterior cingulate cortex in very early Alzheimer s disease. Ann Neurol 42: 85–94. [DOI] [PubMed] [Google Scholar]
- Mintun MA, LaRossa GN, Sheline YI, Dence CS, Lee SY, Mach RH, Klunk WE, Mathis CA, DeKosky ST, Morris JC ( 2006): [11C]PIB in a nondemented population: Potential antecedent marker of Alzheimer disease. Neurology 67: 446–452. [DOI] [PubMed] [Google Scholar]
- Mitchell JP, Macrae CN, Banaji MR ( 2006): Dissociable medial prefrontal contributions to judgments of similar and dissimilar others. Neuron 50: 655–663. [DOI] [PubMed] [Google Scholar]
- Miyashita Y ( 1993): Inferior temporal cortex: Where visual perception meets memory. Annu Rev Neurosci 16: 245–263. [DOI] [PubMed] [Google Scholar]
- Morris JC ( 1993): The Clinical Dementia Rating (CDR): Current version and scoring rules. Neurology 43: 2412–2414. [DOI] [PubMed] [Google Scholar]
- Morris R, Petrides M, Pandya DN ( 1999): Architecture and connections of retrosplenial area 30 in the rhesus monkey (Macaca mulatta). Eur J Neurosci 11: 2506–2518. [DOI] [PubMed] [Google Scholar]
- Nichols TE, Holmes AP ( 2001): Nonparametric permutation tests for functional neuroimaging: A Primer with Examples. Hum Brain Mapp 15: 1–25. [DOI] [PMC free article] [PubMed] [Google Scholar]
- Oldfield RC ( 1971): The assessment and analysis of handedness: The Edinburgh inventory. Neuropsychologia 9: 97–113. [DOI] [PubMed] [Google Scholar]
- Olmsted SM ( 1983): On Representing and Solving Decision Problems. Ph.D. thesis, Department of Engineering‐Economic Systems, Stanford University, Stanford, CA.
- Pedraza O, Bowers D, Gilmore R ( 2004): Asymmetry of the hippocampus and amygdala in MRI volumetric measurements of normal adults. J Int Neuropsychol Soc 10: 664–678. [DOI] [PubMed] [Google Scholar]
- Perry R, Watson P, Hodges J ( 2000): The nature and staging of attention dysfunction in early (minimal and mild) Alzheimer's disease: Relationship to episodic and semantic memory impairment. Neuropsychologia 38: 252–271. [DOI] [PubMed] [Google Scholar]
- Pike KE, Savage G, Villemagne VL ( 2007): β‐Amyloid imaging and memory in non‐demented individuals: Evidence for preclinical Alzheimer's disease. Brain 130: 2837–2844. [DOI] [PubMed] [Google Scholar]
- Raichle ME, Snyder AZ ( 2007): A default mode of brain function: A brief history of an evolving idea. NeuroImage 37: 1083–1090. [DOI] [PubMed] [Google Scholar]
- Raichle ME, MacLeod AM, Snyder AZ, Powers WJ, Gusnard DA, Shulman GL ( 2001): A default mode of brain function. Proc Natl Acad Sci 98: 676–682. [DOI] [PMC free article] [PubMed] [Google Scholar]
- Rajapakse JC, Zhou J ( 2007): Learning effective brain connectivity with dynamic Bayesian networks. NeuroImage 37: 749–760. [DOI] [PubMed] [Google Scholar]
- Reiman EM, Caselli RJ, Yun LS, Chen K, Bandy D, Minoshima S, Thibodeau SN, Osborne D ( 1996): Preclinical evidence of Alzheimer's disease in persons homozygous for the epsilon 4 allele for apolipoprotein E. N Engl J Med 334: 752–758. [DOI] [PubMed] [Google Scholar]
- Rombouts SA, Barkhof F, Goekoop R, Stam CJ, Scheltens P ( 2005): Altered resting state networks in mild cognitive impairment and mild Alzheimer's disease: An fMRI study. Hum Brain Mapp 26: 231–239. [DOI] [PMC free article] [PubMed] [Google Scholar]
- Scarff CJ, Reynolds A, Goodyear BG, Ponton CW, Dort JC, Eggermont JJ ( 2004): Simultaneous 3‐T fMRI and high‐density recording of human auditory evoked potentials. NeuroImage 23: 1129–1142. [DOI] [PubMed] [Google Scholar]
- Schmand B, Walstra G, Lindeboom J, Teunisse S, Jonker C ( 2000): Early detection of Alzheimer's disease using the Cambridge Cognitive Examination (CAMCOG). Psychol Med 30: 619–627. [DOI] [PubMed] [Google Scholar]
- Schwarz G ( 1978): Estimate the dimension of a model. Automatica 14: 465–471. [Google Scholar]
- Shachter RD, Kenley CR ( 1989): Gaussian influence diagrams. Manage Sci 35: 527–550. [Google Scholar]
- Soininen H, Partanen K, Pitkänen A, Hallikainen M, Hänninen T, Helisalmi S, Mannermaa A, Ryynänen M, Koivisto K, Riekkinen P Sr ( 1995): Decreased hippocampal volume asymmetry on MRIs in nondemented elderly subjects carrying the apolipoprotein E epsilon 4 allele. Neurology 45: 391–392. [DOI] [PubMed] [Google Scholar]
- Sorg C, Riedl V, Muhlau M, Calhoun VD, Eichele T, Laer L, Drzezga A, Forstl H, Kurz A, Zimmer C, Wohlschläger, AM ( 2007): Selective changes of resting‐state networks in individuals at risk for Alzheimer's disease. Proc Natl Acad Sci 104: 18760–18765. [DOI] [PMC free article] [PubMed] [Google Scholar]
- Stevens MC, Pearlson GD, Calhoun VD ( 2009): Changes in the interaction of resting‐state neural networks from adolescence to adulthood. Hum Brain Mapp 30: 2356–2366. [DOI] [PMC free article] [PubMed] [Google Scholar]
- Suzuki WA, Amaral DG ( 1994): The perirhinal and parahippocampal cortices of the macaque monkey: Cortical afferents. J Comp Neurol 350: 497–533. [DOI] [PubMed] [Google Scholar]
- Svoboda E, McKinnon MC, Levine B ( 2006): The functional neuroanatomy of autobiographical memory: A meta‐analysis. Neuropsychologia 44: 2189–2208. [DOI] [PMC free article] [PubMed] [Google Scholar]
- Tanaka K ( 1996): Inferotemporal cortex and object vision. Annu Rev Neurosci 19: 109–139. [DOI] [PubMed] [Google Scholar]
- Vincent JL, Snyder AZ, Fox MD, Shannon BJ, Andrews JR, Raichle ME, Buckner RL ( 2006): Coherent spontaneous activity identifies a hippocampal‐parietal memory network. J Neurophysiol 96: 3517–3531. [DOI] [PubMed] [Google Scholar]
- Vogt BA, Finch DM, Olson CR ( 1992): Functional heterogeneity in cingulate cortex: The anterior executive and posterior evaluative regions. Cereb Cortex 2: 435–443. [DOI] [PubMed] [Google Scholar]
- Wang K, Liang M, Wang L, Tian L, Zhang X, Li K, Jiang T ( 2007): Altered functional connectivity in early Alzheimer's disease: A resting‐state fMRI study. Hum Brain Mapp 28: 967–978. [DOI] [PMC free article] [PubMed] [Google Scholar]
- Wang L, Zang Y, He Y, Liang M, Zhang X, Tian L, Wu T, Jiang T, Li K ( 2006): Changes in hippocampal connectivity in the early stages of Alzheimer's disease: Evidence from resting state fMRI. NeuroImage 31: 496–504. [DOI] [PubMed] [Google Scholar]
- Zheng X, Rajapakse JC ( 2006): Learning functional structure from fMR images. NeuroImage 31: 1601–1613. [DOI] [PubMed] [Google Scholar]