Abstract
Background
It has been demonstrated that dynamic electrochemistry can be used to correct blood glucose measurement results for potentially interfering conditions, such as humidity, hematocrit (HCT) variations, and ascorbic acid. The purpose of this laboratory investigation was to assess the potential influence of hematocrit variations on a variety of blood glucose meters applying different measurement technologies.
Methods
Venous heparinized whole blood was drawn, immediately aliquoted, and manipulated to contain three different blood glucose concentrations (80, 155, and 310 mg/dl) and five different hematocrit levels (25%, 37%, 45%, 52%, and 60%). After careful oxygenation to normal blood oxygen pressure, each of the resulting 15 different samples was measured 8 times with the following devices: BGStar, Contour, Accu-Chek Aviva, Accu-Chek Aviva Nano, Breeze 2, Precision Xceed, OneTouch Ultra 2, OneTouch Verio, FreeStyle Freedom Lite, Glucocard G+, GlucoMen LX, GlucoMen GM, and StatStrip [point-of-care (POC) device]. Cobas (Roche Diagnostics, glucose hexokinase method) served as laboratory plasma reference method. Stability to hematocrit influence was assumed when less than 10% bias occurred between the highest and lowest hematocrit levels when analyzing mean deviations for all three glucose concentrations.
Results
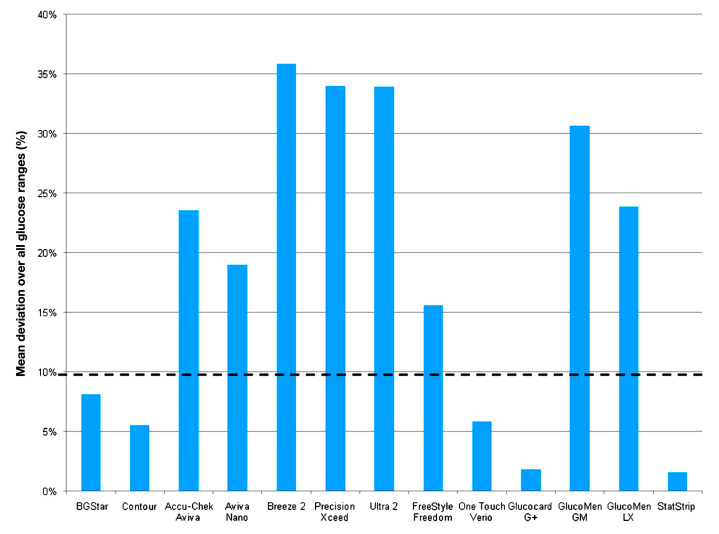
Besides the POC StatStrip device, which is known to measure and correct for hematocrit (resulting in <2% bias), four self-test meters also showed a stable performance in this investigation: dynamic electrochemistry, BGStar (8%), and static electrochemistry, Contour (6%), Glucocard G+ (2%), and OneTouch Verio (6%). The other meters failed this test: colorimetry, FreeStyle Freedom Lite (16%), and static electrochemistry, Accu-Chek Aviva (23%), Accu-Chek Aviva Nano (18%), Breeze 2 (36%), OneTouch Ultra 2 (34%), Precision Xceed (34%), GlucoMen LX (24%), and GlucoMen GM (31%).
Conclusions
As hematocrit variations occur in daily routine (e.g., because of smoking, exercise, hypermenorrhea, pregnancy, stay in mountains, and hemodialysis), our results may encourage use of meters with stable performance under these conditions. Dynamic electrochemistry as used in the BGStar device (sanofi-aventis) appears to be an effective technology to correct for potential hematocrit influence on the meter results.
Keywords: blood glucose measurement, dynamic electrochemistry, hematocrit, interference
Introduction
Performance of frequent blood glucose monitoring procedures is a daily routine for patients with diabetes mellitus on insulin therapy and is also recommended by current clinical practice guidelines.1,2 Patients and doctors make treatment decisions based on the obtained readings, which can impact the patients' wellbeing. Therefore, the accuracy of glucose assessments is of uppermost importance. However, based on the underlying technology of strips and devices, chemical substances and environmental conditions, such as humidity or temperature, may influence the readings and may impair the accuracy of obtained values to provide reliable guidance for treatment decisions.3–5
Hematocrit has long been known to affect the accuracy of glucose analysis.6,7 Several studies of different glucose meters have indicated that lower-than-normal hematocrit values (<30% to <35%) result in overestimates of laboratory glucose concentrations when the point-of-care (POC) method is used for comparison, whereas hematocrit values higher than normal (>45%) result in underestimates of laboratory values.8–10 Several hypotheses have been proposed to explain the impact of abnormal hematocrit values on blood glucose testing, such as altered viscosity of blood, prevention of plasma from reaching the reaction surface of the test strip, change in diffusion kinetics, and/or increased packed red cell volume and displacement of plasma volume leading to insufficient plasma volume for accurate testing.10
For instance, a fixed volume of plasma has a higher water content and therefore has higher glucose concentrations of approximately 11–12% compared with whole blood already at a normal hematocrit of approximately 45%. This difference is even more pronounced in the case of high hematocrit values.11,12
The instructions for use of many handheld blood glucose meters limit their use to clinical situations in which hematocrit values are within a specific range, typically 30% to 60%. However, use of these devices in daily routine may occur outside these hematocrit values, e.g., in critically ill patients, extreme exercise, and late-stage nephropathy.13–15
Technical accuracy of glucose meters is usually not determined against the gold standard method for glucose assessment (isotope dilution mass spectrometry) but by comparison with a method in routine use in the clinical laboratory, thus establishing a comparative accuracy.11,12 However, bedside devices are often used to determine glucose concentrations when frequent monitoring of glucose is important, e.g., for daily insulin dosing calculations. Multiple studies have already shown that the majority of handheld and POC glucose meters are affected by hematocrit interference and that the observed deviations may have an impact on therapeutic decisions.16–19 One technical solution to correct for a possible hematocrit interference is parallel measurement of hematocrit with a subsequent correction algorithm as employed by the POC StatStrip device (Nova Biomedical). In several studies, the StatStrip device was compared with other devices and was found to be insusceptible against hematocrit or ascorbic acid interference, while the comparator devices showed deviating results when subjected to hematocrit and ascorbic acid interferences, with the magnitude of interference varying by glucose measurement technology.20,21
Another possibility to reduce hematocrit interference is the application of a physical and mathematical result correction as employed by dynamic electrochemistry. Dynamic electrochemistry involves multiple measurements at different conditions (e.g., by varying frequencies and voltage) and readjustment of the input stimulation signal in response to how the electron transfer kinetics at the electrode and the related chemistry are progressing. This dynamic adjustment results in a much richer output signal that forms the basis for a “fingerprint” that the meter's algorithms can analyze to develop correction factors to minimize distortion caused by the interfering factors.22
This laboratory investigation was performed to assess the impact of hematocrit variation on the performance of a new blood glucose meter employing dynamic electrochemistry technology in comparison with several other blood glucose meters based on different electrochemical colorimetric technologies.
Materials and Methods
Measurement Devices and Laboratory Protocol
The following blood glucose meters were included in this investigation: BGStar (sanofi-aventis; glucose oxidase with dynamic electrochemistry); Accu-Chek Aviva and Accu-Chek Aviva Nano [Roche Diagnostics; both glucose dehydrogenase (GDH) with static electrochemistry]; Contour and Breeze 2 (Bayer; both GDH with static electrochemistry); OneTouch Ultra 2 and OneTouch Verio (LifeScan; both GDH with static electrochemistry); Freestyle Freedom Lite and Precision Xceed (Abbott Diabetes Care); and Glucocard G+, GlucoMen LX, and GlucoMen GM (Menarini Diagnostics). StatStrip Connectivity (Nova Biomedical, Waltham, MA) was used as whole blood reference method. Reference measurements with this device were performed before and after each meter test. Cobas 6000 (Roche Diagnostics, Mannheim, Germany; glucose hexo-kinase method) served as plasma reference method, and assessment was performed once before use of each sample. Two meters of each device were used in this protocol.
Blood sample collection for this study was performed in accordance with local ethical and legal requirements. After the blood draw, heparinized samples were manipulated as described here to contain three different levels of blood glucose and five different hematocrit concentrations. Thus, the total amount of samples to be tested was 15 samples. Samples were aliquoted and shortly stored at 4 °C until measurement. Prior to glucose measurements with the reference and test methods, the degree of oxygenation was adjusted to reach physiological capillary values (range 55–140 mm Hg) and hematocrit of the prepared samples was measured with the ABL80 FLEX CO-OX blood gas analyzer (Sendx Medical/Radiometer, Carlsbad, CA). Each meter/strip combination was tested four times (8 measurements/meter/sample = 1440 measurements in total). All experiments were carried out under similar environmental conditions.
Sample Processing
Venous, heparinized whole blood was drawn the day of the experiment. For hematocrit interference, blood was spiked to three appropriate target glucose concentrations using a 40% concentrated glucose solution (B. Braun, Germany; target ranges: 50–90, 120–180, and 280–350 mg/dl) and was carefully manually rocked in a 15 ml centrifugation tube for at least 5 min. Then the samples were centrifuged to separate plasma and red blood cells. Five aliquots were reconstituted in separate tubes to produce hematocrit values of approximately 20–30%, 35–40%, 45–50%, 50–55%, and 55–65%. Exact values of hematocrit and oxygen pressure in the sample were verified by means of the ABL analyzer. The degree of oxygenation of each sample prior to glucometer measurement had to be within meter specifications (i.e., within a range of 55–140 mm Hg). If necessary, individual samples were oxygenized by gentle manual rocking at room temperature.
Analysis
Data of each meter was tabulated. Mean values and standard deviations for each meter type/sample combination were calculated, and the coefficient of variation was determined (precision). Mean glucose value with the hematocrit of 40–45% was set to be 100% in order to determine the bias (percentage deviation) at different hematocrit and glucose levels. The means of these deviations were used for calculating maximal mean percentage deviation (MMPD; largest observed high deviation + largest observed low deviation from the value at hematocrit of 45%) for each meter at the three glucose concentrations. A MMPD <15% for the individual glucose level and a mean MMPD over the entire glucose ranges <10% was defined as indicative for no clinically relevant influence of hematocrit on blood glucose readings. Data were calculated for each meter and individual glucose concentration. In addition, mean deviation over the entire glucose range was determined for each meter type. Comparisons between mean values were calculated by means of the two-sided Student's t-test. A p value < 0.05 was considered statistically significant.
Results
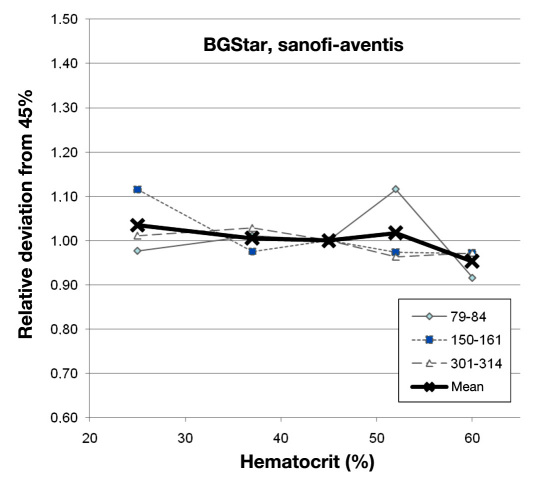
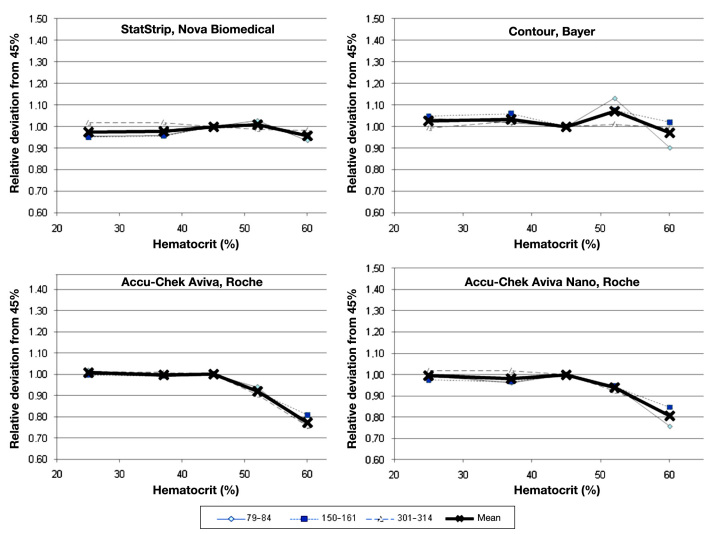
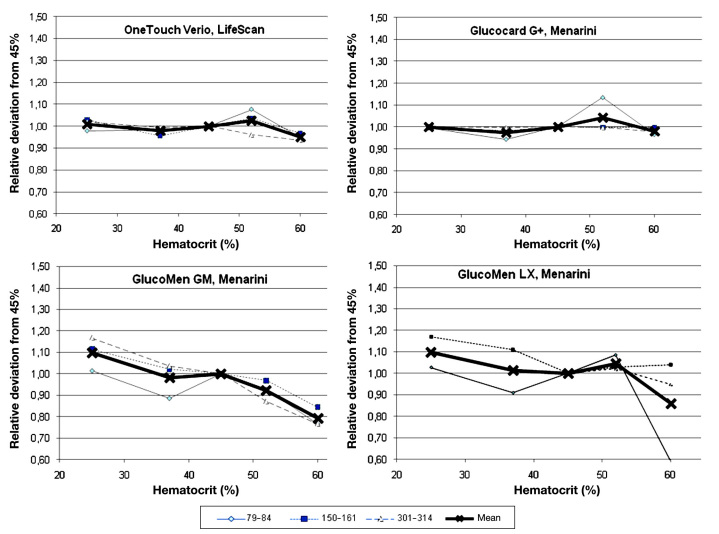
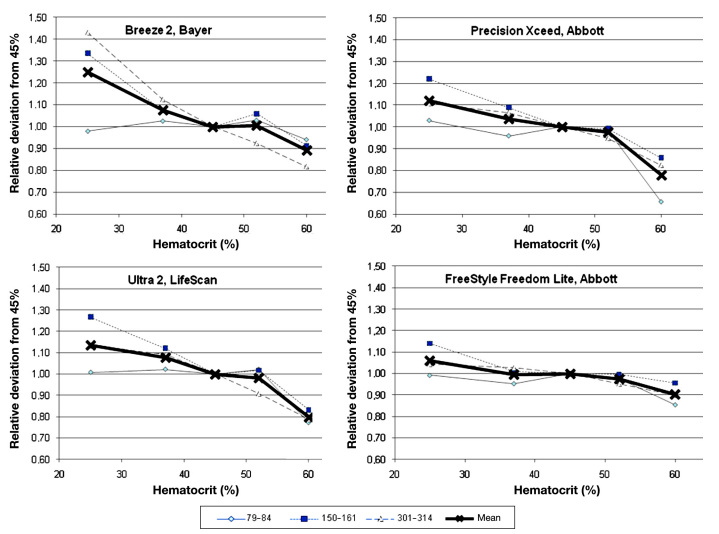
Laboratory manipulations achieved final glucose values of 79–84, 150–161, and 301–314 mg/dl at hematocrit values of 25%, 37%, 45%, 52%, and 60%, respectively. Deviations at different glucose levels and mean bias for each device are shown for BGStar in Figure 1 and for the competitor devices in Figures 2 to 4.
Figure 1.
Relative deviation of the BGStar from the glucose concentration measured at a hematocrit value of 45% at the three glucose ranges and the combined mean value.
Figure 2.
Relative deviation of four comparator devices (StatStrip, Contour, Accu-Chek Aviva, and Accu-Chek Aviva Nano) from glucose concentration measured at a hematocrit value of 45% at the three glucose ranges and the combined mean value.
Figure 4.
Relative deviation of four comparator devices (OneTouch Verio, Glucocard G+, GlucoMen GM, and GlucoMen LX) from glucose concentration measured at a hematocrit value of 45% at the three glucose ranges and the combined mean value.
Figure 3.
Relative deviation of four comparator devices (Breeze 2, Precision Xceed, OneTouch Ultra 2, and FreeStyle Freedom Lite) from glucose concentration measured at a hematocrit value of 45% at the three glucose ranges and the combined mean value.
Few devices were not affected in a clinically relevant magnitude by hematocrit interference (BGStar, OneTouch Verio, Glucocard G+, and Contour). These four unaffected devices and technologies showed a comparable performance in this experiment, with individual minor deviations seen with some samples. Several of the other devices showed pronounced deviations from the reference hematocrit value, with the largest bias seen for Breeze 2 at the high glucose concentration (+43% to -17% with increasing hematocrit). As expected, the best performance was seen with the capillary whole blood reference device (StatStrip; see Figure 2).
Calculation of mean absolute percentage deviation for the different blood glucose ranges is provided in Table 1, and mean values over the entire blood glucose ranges are provided in Figure 5.
Table 1.
Percentage Deviation between Glucose Concentrations Measured at the Lowest (25%) and Highest (60%) Hematocrit Level for All Three Glucose Ranges
| Glucometer | Glucose concentrations | ||
|---|---|---|---|
| 79–84 mg/dl | 150–161 mg/dl | 301–314 mg/dl | |
| BGStar | 6.1% | 14.5% | 3.9% |
| Contour | 13.5%a | 2.9%a | 0.2% |
| Breeze 2 | 3.9% | 42.2%a | 61.3%a |
| OneTouch Ultra 2 | 23.5%a | 43.6%a | 34.7%a |
| OneTouch Verio | 3.0% | 6.2% | 8.4% |
| Precision Xceed | 37.3%a | 36.2%a | 28.4%a |
| FreeStyle Freedom Lite | 13.9%a | 18.4% | 14.4%a |
| Accu-Chek Aviva | 26.2%a | 18.9% | 25.6%a |
| Accu-Chek Aviva Nano | 23.7%a | 12.9% | 20.4%a |
| Glucocard G+ | 3.0% | 0.2%a | 2.2% |
| GlucoMen LX | 24.9%a | 27.1 %a | 40.0%a |
| GlucoMen GM | 43.6%a | 13.1% | 14.8%a |
| StatStrip Connectivity | 1.8% | 0.5%a | 3.4% |
p < .05 versus BGStar.
Figure 5.
Mean percentage deviation between glucose concentrations measured at the lowest and highest hematocrit value calculated over all glucose ranges.
Similar to the individual analysis, only the four previously mentioned devices were classified to be not influenced by hematocrit in a clinically relevant way (MMPD <15% for individual glucose levels, mean MMPD over entire glucose ranges <10%: BGStar 8%, Verio 6%, and Glucocard G+ 2%).
Discussion
Prevalence of hematocrit variations is usually underestimated by physicians and diabetes nurse educators, but they occur in daily practice more often than generally expected. They can be induced by lifestyle interventions (e.g., smoking, prolonged exercise) and are also influenced by environmental conditions (e.g., seasons, geographic height), demographic conditions (e.g., age), and disease- and drug-related conditions (e.g., hypermenorrhea, pregnancy, renal disease, hematological disorders).23,24 The normal within-subject biological variation is 3%, and the analytical variation is also 3% when observed in healthy subjects.25 Partly due to hemodilution in warm weather, hematocrit often has a seasonal variation in normal healthy adults. Based on results of a meta-analysis from 18 studies of 24,793 participants, the population mean is approximately 3% lower in summer than winter.25,26 Population mean values that are 7% lower in summer than in winter have been found in some studies, although no seasonal effect may also be seen, especially in temperate climates.27 If hematocrit values are sampled at yearly peak and trough time points, with intervals of up to 6 months, a 15% relative change (95% level) can be seen in a normal healthy adult, e.g., a change from 0.42–0.48.25 The relevance of this phenomenon has only been investigated in high-risk populations (e.g., intensive care unit patients or neonates), but information from community-based studies is lacking.28 In older patients also suffering from various diseases, these variations can be much more pronounced.29,30 However, hematocrit interference on blood glucose meter results may represent a potential risk factor for diabetes patients, e.g., for patients performing intensive insulin therapy, as inaccurate blood glucose readings may lead to wrong treatment decisions, potentially risking the patient's safety and wellbeing.
Some of the modern glucose measurement technologies have been developed to address this potential risk factor. One option is that the devices measure hematocrit values in parallel to glucose concentrations and apply a corrective term before displaying the result; this option has been incorporated into the StatStrip technology.20,21,31 Another possibility to correct for hematocrit interference is to use sophisticated mathematical algorithms based on the differences in the kinetics of the electrochemical reactions of glucose and confounding substances under different measurement conditions to perform a mathematical correction prior to result display. This method is referred to as “dynamic electrochemistry” and has been incorporated into commercially available blood glucose meters for patient self-measurement, such as the BGStar and iBGStar devices from sanofi-aventis.22 In this mathematical model, it is proposed that each oxidation process leading to an electrode signal can be represented by a unique vector based on a phase angle (psi) and a unique vector length (YO) and that the concentration of each analyte leading to an electron transfer can be determined by monitoring the change in the admittance magnitude in the direction of the characteristic angle for that particular species when applying different baseline measurement conditions (e.g., frequency or voltage). The total faradic admittance for all electroactive species present is given by a linear combination of the independent vectors from different species. By applying different measurement conditions, the model allows for calculation of the individual contribution of an interfering substance based on the knowledge of the analyte-specific phase angle of the oxidation signal. Based on existing calibration curves and the knowledge about phase angle and basis vectors, glucose in samples containing several electroactive species can be measured by correcting the measured total admittance from several underlying measurement conditions for the influence of a variety of known interfering substances and conditions.22,32 In our laboratory study, these corrections lead to unbiased readings independent from hematocrit variation.
Several important limitations of our investigation need to be highlighted, which prohibit a direct translation of our laboratory results into clinical practice recommendations. Firstly, this investigation was performed in an artificial laboratory setting with manipulated venous samples. It was designed to provide information regarding the effect of hematocrit on the underlying technology of the investigated meters. However, all explored devices are designed to operate optimally with capillary blood obtained from the fingertip in a clinical environment. Therefore, we have not provided data about observed absolute accuracy or precision of the results. Also, while sample specimen and environmental factors were controlled in our experiment for all devices, other factors such as the complexity of chemical reactions, the involvement of different coenzymes, and additional unknown strip components may have further influenced our results. In this context, it is important to mention that oxygen pressure plays a crucial role in the laboratory performance assessment of devices employing dynamic electrochemistry. In particular, investigators who are interested in further exploration of this technology in a laboratory setting should ensure that oxygen pressure in their samples is indeed thoroughly assessed and adapted to physiological values immediately before measurement, if necessary. Otherwise, conclusions drawn from their laboratory results with devices employing dynamic electrochemistry may be of limited value or even misleading.
We optimized the laboratory setting in this respect and were able to demonstrate that the majority of the different devices tested is indeed subject to a pronounced interference by hematocrit. Given an observed individual relative variability of hematocrit of up to 15% in healthy subjects25 and the even larger distribution of hematocrit in patients affected by chronic disease, with extreme ranges from 30–70%,23,24 the impact of hematocrit on accuracy of blood glucose readings may have been underestimated so far. However, further well-designed studies are warranted to elucidate this phenomenon. In any case, it appears to be advantageous to select those blood glucose meters among existing devices that have demonstrated a stable performance, independent from hematocrit interference. In our investigation, few devices fulfilled this requirement, and the manufacturers of the other blood glucose meters might want to invest time and effort to improve their technologies with respect to insusceptibility to hematocrit interference.
In conclusion, hematocrit interference can affect the accuracy of blood glucose readings in daily clinical practice. In our laboratory investigation, few devices performed in a stable manner if challenged by this confounding factor. Dynamic electrochemistry as employed by the BGStar device appears to be an attractive technological solution to allow for reliable blood glucose determination under circumstances associated with hematocrit variations.
Glossary
Abbreviations
- (GDH)
glucose dehydrogenase
- (MMPD)
maximal mean percentage deviation
- (POC)
point of care
Funding
This study was supported by an unrestricted grant from sanofi-aventis.
Disclosures
Andreas Pfützner and Thomas Forst have received consultancy fees, speaker fees, travel support, and research grants from sanofi-aventis.
References
- 1.American Diabetes Association. Clinical practice recommendations. Diabetes Care. 2011;34(Suppl 1):S1–98. [PubMed] [Google Scholar]
- 2.Martin S, Dreyer M, Kiess W, Lüdecke H-J, Müller UA, Schatz H, Waldhäusl W. Scherbaum WA, editor. Behandlung des Diabetes mellitus Typ 1. Diabetologie und Stoffwechsel. 2008;3(Suppl 2):S155–6. Praxis-Leitlinien der Deutschen Diabetes-Gesellschaft (DDG) [Google Scholar]
- 3.Martinello F, Luiz da Silva E. Mechanism of ascorbic acid interference in biochemical tests that use peroxide and peroxidase to generate chromophore. Clin Chim Acta. 2006;373(1–2):108–116. doi: 10.1016/j.cca.2006.05.012. [DOI] [PubMed] [Google Scholar]
- 4.Tang Z, Du X, Louie RF, Kost GJ. Effects of drugs on glucose measurements with handheld glucose meters and a portable glucose analyzer. Am J Clin Pathol. 2000;113(1):75–86. doi: 10.1309/QAW1-X5XW-BVRQ-5LKQ. [DOI] [PubMed] [Google Scholar]
- 5.Schleis TG. Interference of maltose, icodextrin, galactose, or xylose with some blood glucose monitoring systems. Pharmacotherapy. 2007;27(9):1313–1321. doi: 10.1592/phco.27.9.1313. [DOI] [PubMed] [Google Scholar]
- 6.Tang Z, Lee JH, Louie RF, Kost GJ. Effects of different hematocrit levels on glucose measurements with handheld meters for point-of-care testing. Arch Pathol Lab Med. 2000;124(8):1135–1140. doi: 10.5858/2000-124-1135-EODHLO. [DOI] [PubMed] [Google Scholar]
- 7.Smith EA, Kilpatrick ES. Intra-operative blood glucose measurements. The effect of haematocrit on glucose test strips. Anaesthesia. 1994;49(2):129–132. doi: 10.1111/j.1365-2044.1994.tb03369.x. [DOI] [PubMed] [Google Scholar]
- 8.Pavlicek V, Garzoni D, Urech P, Brändle M. Inaccurate self-monitoring of blood glucose readings in patients on chronic ambulatory peritoneal dialysis with icodextrin. Exp Clin Endocrinol Diabetes. 2006;114(3):124–126. doi: 10.1055/s-2006-924011. [DOI] [PubMed] [Google Scholar]
- 9.Püntmann I, Wosniok W, Haeckel R. Comparison of several point-of-care testing (POCT) glucometers with an established laboratory procedure for the diagnosis of type 2 diabetes using the discordance rate. A new statistical approach. Clin Chem Lab Med. 2003;41(6):809–820. doi: 10.1515/CCLM.2003.123. [DOI] [PubMed] [Google Scholar]
- 10.Louie RF, Tang Z, Sutton DV, Lee JH, Kost GJ. Point-of-care glucose testing: effects of critical care variables, influence of reference instruments, and a modular glucose meter design. Arch Pathol Lab Med. 2000;124(2):257–266. doi: 10.5858/2000-124-0257-POCGT. [DOI] [PubMed] [Google Scholar]
- 11.Ginsberg BH. Factors affecting blood glucose monitoring: sources of errors in measurement. J Diabetes Sci Technol. 2009;3(4):903–913. doi: 10.1177/193229680900300438. [DOI] [PMC free article] [PubMed] [Google Scholar]
- 12.Tonyushkina K, Nichols JH. Glucose meters: a review of technical challenges to obtaining accurate results. J Diabetes Sci Technol. 2009;3(4):971–980. doi: 10.1177/193229680900300446. [DOI] [PMC free article] [PubMed] [Google Scholar]
- 13.Jain R, Myers TF, Kahn SE, Zeller WP. How accurate is glucose analysis in the presence of multiple interfering substances in the neonate? (glucose analysis and interfering substances) J Clin Lab Anal. 1996;10(1):13–16. doi: 10.1002/(SICI)1098-2825(1996)10:1<13::AID-JCLA3>3.0.CO;2-M. [DOI] [PubMed] [Google Scholar]
- 14.Oyibo SO, Pritchard GM, McLay L, James E, Laing I, Gokal R, Boulton AJ. Blood glucose overestimation in diabetic patients on continuous ambulatory peritoneal dialysis for end-stage renal disease. Diabet Med. 2002;19(8):693–696. doi: 10.1046/j.1464-5491.2002.00753.x. [DOI] [PubMed] [Google Scholar]
- 15.Haider DG, Fuhrmann H, Kovarik J, Heiss S, Graf H, Auinger M, Mittermayer F, Wolzt M, Hörl WH. Postprandial intradialytic dysglycaemia and diabetes in maintenance haemodialysis patients. Eur J Clin Invest. 2008;38(10):721–727. doi: 10.1111/j.1365-2362.2008.02012.x. [DOI] [PubMed] [Google Scholar]
- 16.Lacara T, Domagtoy C, Lickliter D, Quattrocchi K, Snipes L, Kuszaj J, Prasnikar M. Comparison of point-of-care and laboratory glucose analysis in critically ill patients. Am J Crit Care. 2007;16(4):336–346. [PubMed] [Google Scholar]
- 17.Critchell CD, Savarese V, Callahan A, Aboud C, Jabbour S, Marik P. Accuracy of bedside capillary blood glucose measurements in critically ill patients. Intensive Care Med. 2007;33(12):2079–2084. doi: 10.1007/s00134-007-0835-4. [DOI] [PubMed] [Google Scholar]
- 18.Kanji S, Buffie J, Hutton B, Bunting PS, Singh A, McDonald K, Fergusson D, McIntyre LA, Hebert PC. Reliability of point-of-care testing for glucose measurement in critically ill adults. Crit Care Med. 2005;33(12):2778–2785. doi: 10.1097/01.ccm.0000189939.10881.60. [DOI] [PubMed] [Google Scholar]
- 19.Sirkin A, Jalloh T, Lee L. Selecting an accurate point-of-care testing system: clinical and technical issues and implications in neonatal blood glucose monitoring. J Spec Pediatr Nurs. 2002;7(3):104–112. doi: 10.1111/j.1744-6155.2002.tb00159.x. [DOI] [PubMed] [Google Scholar]
- 20.Karon BS, Griesmann L, Scott R, Bryant SC, DuBois JA, Shirey TL, Presti S, Santrach PJ. Evaluation of the impact of hematocrit and other interference on the accuracy of hospital-based glucose meters. Diabetes Technol Ther. 2008;10(2):111–120. doi: 10.1089/dia.2007.0257. [DOI] [PubMed] [Google Scholar]
- 21.Pfützner A, Harzer O, Musholt PB, Scherer S, Löbig M, Forst T. Performance of blood glucose measurement systems influenced by interfering substances. Diabetes Stoffw Herz. 2009;18:387–392. [Google Scholar]
- 22.Iyengar S, Wiley M, Nadeau D. Performance of the WaveSense-enabled glucose monitoring system across multiple lots. Diabetes Stoffw Herz. 2007;16(1):15–20. [Google Scholar]
- 23.Takubo T, Tatsumi N. Reference values for hematologic laboratory tests and hematologic disorders in the aged. Rinsho Byori. 2000;48(3):207–216. [PubMed] [Google Scholar]
- 24.Macdougall IC, Ritz E. The Normal Haematocrit Trial in dialysis patients with cardiac disease: are we any the less confused about target haemoglobin? Nephrol Dial Transplant. 1998;13(12):3030–3033. doi: 10.1093/ndt/13.12.3030. [DOI] [PubMed] [Google Scholar]
- 25.Thirup P. Haematocrit: within-subject and seasonal variation. Sports Med. 2003;33(3):231–243. doi: 10.2165/00007256-200333030-00005. [DOI] [PubMed] [Google Scholar]
- 26.Hightower CM, Hightower JD, Vázquez BY, Intaglietta M. Seasonal hematocrit variation and health risks in the adult population of Kinshasa, Democratic Republic of Congo. Vasc Health Risk Manag. 2009;5:1001–1005. doi: 10.2147/vhrm.s8136. [DOI] [PMC free article] [PubMed] [Google Scholar]
- 27.Röcker L, Feddersen HM, Hoffmeister H, Junge B. Seasonal variation of blood components important for diagnosis. Klin Wochenschr. 1980;58(15):769–778. doi: 10.1007/BF01478285. [DOI] [PubMed] [Google Scholar]
- 28.Christensen RD, Henry E, Jopling J, Wiedmeier SE. The CBC: reference ranges for neonates. Semin Perinatol. 2009;33(1):3–11. doi: 10.1053/j.semperi.2008.10.010. [DOI] [PubMed] [Google Scholar]
- 29.Collins AJ, Ma JZ, Ebben J. Impact of hematocrit on morbidity and mortality. Semin Nephrol. 2000;20(4):345–349. [PubMed] [Google Scholar]
- 30.Volkova N, Arab L. Evidence-based systematic literature review of hemoglobin/hematocrit and all-cause mortality in dialysis patients. Am J Kidney Dis. 2006;47(1):24–36. doi: 10.1053/j.ajkd.2005.09.007. [DOI] [PubMed] [Google Scholar]
- 31.Nuntnarumit P, Chittamma A, Pongmee P, Tangnoo A, Goonthon S. Clinical performance of the new glucometer in the nursery and neonatal intensive care unit. Pediatr Int. 2011;53:218–223. doi: 10.1111/j.1442-200X.2010.03214.x. [DOI] [PubMed] [Google Scholar]
- 32.Iyengar S, Hall EA. Phasor transform to extract glucose and ascorbic acid data in an amperometric sensor. Analyst. 2000;125(11):1987–1992. doi: 10.1039/b005967f. [DOI] [PubMed] [Google Scholar]


