

Abstract
Microbially produced fatty acids are potential precursors to high-energy-density biofuels, including alkanes and alkyl ethyl esters, by either catalytic conversion of free fatty acids (FFAs) or enzymatic conversion of acyl-acyl carrier protein or acyl-coenzyme A intermediates. Metabolic engineering efforts aimed at overproducing FFAs in Escherichia coli have achieved less than 30% of the maximum theoretical yield on the supplied carbon source. In this work, the viability, morphology, transcript levels, and protein levels of a strain of E. coli that overproduces medium-chain-length FFAs was compared to an engineered control strain. By early stationary phase, an 85% reduction in viable cell counts and exacerbated loss of inner membrane integrity were observed in the FFA-overproducing strain. These effects were enhanced in strains endogenously producing FFAs compared to strains exposed to exogenously fed FFAs. Under two sets of cultivation conditions, long-chain unsaturated fatty acid content greatly increased, and the expression of genes and proteins required for unsaturated fatty acid biosynthesis were significantly decreased. Membrane stresses were further implicated by increased expression of genes and proteins of the phage shock response, the MarA/Rob/SoxS regulon, and the nuo and cyo operons of aerobic respiration. Gene deletion studies confirmed the importance of the phage shock proteins and Rob for maintaining cell viability; however, little to no change in FFA titer was observed after 24 h of cultivation. The results of this study serve as a baseline for future targeted attempts to improve FFA yields and titers in E. coli.
INTRODUCTION
Microbially derived free fatty acids (FFAs) are attractive intermediates for producing a wide range of high-energy-density biofuels from sustainable carbon sources, such as biomass (34). FFAs can be extracted from culture medium and catalytically converted to esters or alkanes (48, 55). Alternatively, enzymatic pathways exist for intracellular conversion to esters (42, 81), olefins (10, 59, 75), alkanes (78), or fatty aldehydes and fatty alcohols (22, 81, 82). These pathways can either be exploited in their native host or heterologously expressed in a genetically pliable microorganism (3). The physical and chemical properties of the resulting products are dependent on chain length and hydrophobicity; however, medium-chain-length (8- to 14-carbon) methyl esters, olefins, and alkanes exhibit many properties analogous to those of diesel and jet fuel and are therefore potential drop-in replacements (44, 61).
Several studies have demonstrated FFA overproduction in Escherichia coli (19, 48, 52, 81, 83). In each, the key strain modifications included overexpression of one or more cytosolic acyl-acyl carrier protein (ACP) thioesterases and deletion of fadD, or both fadD and fadE, which encode an acyl-coenzyme A (CoA) synthetase and acyl-CoA dehydrogenase, respectively. Overexpression of an acyl-ACP thioesterase depletes the level of acyl-ACP intermediates, which inhibit via feedback enzymes of fatty acid biosynthesis (19, 36). Deletion of fadD and/or fadE eliminates catabolism of fatty acids by the aerobic β-oxidation pathway (43, 65). The additional overexpression of the native E. coli acetyl-CoA carboxylase (ACC) has been shown to improve fatty acid yields in some metabolically engineered strains (19, 52) but to have little impact in others (48).
Reported yields (percentage [wt/wt] of FA from a supplied carbon source) in the literature from FFA-overproducing E. coli are 4.8% in a fed-batch fermentation with glycerol as the sole carbon source (52) and 6% in shake flasks with glucose as a sole carbon source (81), representing less than 20% of the maximum theoretical yield of FFAs from either glucose or glycerol. In comparison, strains of E. coli have been engineered to produce ethanol at over 88% of the maximum theoretical yield (64) and isobutanol at 86% of the maximum theoretical yield (8) from glucose. The limitations to achieving higher yields of FFAs in engineered strains are currently unknown. Potential metabolic bottlenecks have been identified in in vitro studies by using cell extracts supplemented with additional substrates, cofactors, or enzymes involved in FFA biosynthesis (50). It is not yet known whether the observed findings, such as a potential limitation in malonyl-CoA levels, translate to whole-cell biocatalysts, as we have observed little or no improvement in FFA titers in acyl-ACP thioesterase-expressing strains that simultaneously overexpress native E. coli ACC (48). In addition to metabolic bottlenecks, limitations to production can stem from product inhibition, toxicity, and other indirect effects (62).
In a previous study, we observed a copy number-dependent variation in FFA titers and maximum cell densities by expressing an acyl-ACP thioesterase from Umbellularia californica (84) in a series of plasmids with identical inducible promoters (48). We postulated that growth inhibition was due either to a depletion of acyl-ACPs that reduced the ability of cells to synthesize phospholipids necessary for growth or was due to alteration of membrane integrity as a result of accumulation of FFAs in the cell envelope. In this study, further characterization was performed on the cellular impacts of endogenous FFA overproduction, including viable cell counts, staining with the membrane-impermeable SYTOX green nucleic acid dye and forward scatter flow cytometry. Significant losses in cell viability were observed, beginning in the transition between log phase and stationary phase, and were accompanied by increased permeability to SYTOX green and drastic changes in cell morphology. The direct cause of these observations was not obvious and prevented implementation of directed metabolic engineering strategies to alleviate toxicity and increase FFA titer and yield. While prior studies have examined the impact of hydrophobic compounds such as hexane (35) and n-butanol (77) on E. coli gene expression, the only previous systems biology study to investigate exposure to FFAs was a differential proteomics analysis that identified several proteins with increased expression in the presence of exogenously fed oleic acid (C18:1Δ9) (33). Exposure to endogenously produced FFAs is anticipated to result in a more severe cellular impact than exogenously added FFAs, as excretion would require first traversing the inner membrane and subsequently the periplasm with its peptidoglycan network and the outer membrane.
In order to understand the mechanisms underlying the observed phenotypes, we performed a comparative systems biology study that identified key differences in transcript, protein, and lipid profiles between an FFA-overproducing strain and a control strain. This study, consisting of a DNA microarray analysis coupled to a global liquid chromatography/mass spectrometry (LC/MS) analysis of cellular peptides and determination of the fatty acid profile by gas chromatography/MS (GC/MS) as a function of time, represents the first investigation of changes in gene expression in E. coli resulting from either exogenous or endogenous exposure to medium-chain-length FFAs. Genes identified in two sets of parallel experiments focused attention on transcriptional responses that were specific to FFA overproduction. These filtered data sets demonstrated differential expression of stress regulons and suggested targets for improving physiology and strain performance.
MATERIALS AND METHODS
Strains, plasmids, enzymes, media, and bacterial cultivation.
Strains and plasmids are listed in Table 1 (see also Table S1 in the supplemental material). All enzymes used for PCR and cloning were purchased from New England BioLabs (Ipswich, MA) unless otherwise specified. Oligonucleotides used for PCR, cloning, quantitative PCR (qPCR), and verification are listed in Table S2 in the supplemental material. The primary strain used in this work (RL08) was E. coli K-12 MG1655 ΔfadD ΔaraBAD (48). These deletions eliminate aerobic β-oxidation (ΔfadD) and prevent catabolism of l-arabinose (ΔaraBAD), which was used as an inducing agent. FFA-overproducing strains were constructed by transforming RL08 with plasmids harboring a codon-optimized acyl-ACP thioesterase from Umbellularia californica (BTE) (84) as described previously (48). Plasmid pTrc99A-BTE places BTE under the control of the isopropyl-β-d-thiogalactopyranoside (IPTG)-inducible Ptrc promoter (38). Plasmids pBAD35-BTE and pBAD33-BTE place BTE under the control of an arabinose-inducible PBAD promoter (48). A set of control strains was constructed by transforming RL08 with plasmids harboring a mutated gene encoding a nonfunctional thioesterase (BTE-H204A) as previously described (48). The nonfunctional thioesterase was expressed at levels equal to BTE (see Fig. S1 in the supplemental material), providing protein overexpression stress to both experimental and control strains. Plasmids were introduced by established electroporation protocols or by a chemical transformation method (17).
Table 1.
Bacterial strains and plasmids used in this study
| Strain or plasmid | Relevant genotype or propertya | Source or reference |
|---|---|---|
| E. coli strains | ||
| RL08 | K-12 MG1655 ΔfadD ΔaraBAD | 47 |
| DH10B | F−mcrA Δ(mrr-hsdRMS-mcrBC) φ80lacZΔM15 ΔlacX74 recA1 endA1 araD139 Δ(ara leu)7697 galU galK λ−rpsL nupG | Invitrogen |
| JW5249-1 | F− Δ(araD-araB)567 ΔlacZ4787(::rrnB-3) λ− ΔmarA752::kan rph-1 Δ(rhaD-rhaB)568 hsdR514 | 9 |
| JW4359-1 | F− Δ(araD-araB)567 ΔlacZ4787(::rrnB-3) λ−rph-1 Δ(rhaD-rhaB)568 hsdR514 Δrob-721::kan | 9 |
| JW4023-5 | F− Δ(araD-araB)567 ΔlacZ4787(::rrnB-3) λ−rph-1 Δ(rhaD-rhaB)568 ΔsoxS756::kan hsdR514 | 9 |
| JW1296-5 | F− Δ(araD-araB)567 ΔlacZ4787(::rrnB-3) λ− ΔpspF739::kan rph-1 Δ(rhaD-rhaB)568 hsdR514 | 9 |
| RL09 | K-12 MG1655 ΔfadD ΔaraBAD marA::kan | This study |
| RL10 | K-12 MG1655 ΔfadD ΔaraBAD rob::kan | This study |
| RL11 | K-12 MG1655 ΔfadD ΔaraBAD soxS::kan | This study |
| RL12 | K-12 MG1655 ΔfadD ΔaraBAD pspF::kan | This study |
| RL13 | K-12 MG1655 ΔfadD ΔaraBAD ΔpspF | This study |
| Plasmids | ||
| pBAD33 | PBAD promoter, pACYC origin, Cmr | 32 |
| pBAD33-BTE | pBAD33 carrying BTE under PBAD control, Cmr | 47 |
| pBAD33-BTE-H204A | pBAD33 carring BTE-H204A under PBAD control, Cmr | 47 |
| pBAD33-ACC | pRL2 carrying accDABC under PBAD control, Cmr | 47 |
| pBAD35 | PBAD promoter, pBBR-1MCS origin, Kanr | 47 |
| pBAD35-BTE | pBAD35 carrying BTE under PBAD control, Kanr | 47 |
| pBAD35-BTE-H204A | pBAD35 carrying BTE-H204A under PBAD control, Kanr | 47 |
| pTrc99A | Ptrc promoter, pBR322 origin, Ampr | 4 |
| pTrc99A-BTE | pTrc99a carrying BTE under Ptrc control, Ampr | 38 |
| pTrc99A-BTE-H204A | pTrc99a carrying BTE-H204A under Ptrc control, Ampr | 38 |
| pCP20 | Carries yeast FLP recombinase under constitutive promoter, pSC101 origin, λ cI857+, λ pR Rep(Ts), Ampr Cmr | 16 |
Abbreviations: Amp, ampicillin; Cm, chloramphenicol; Kan, kanamycin; R, resistance; Ts, temperature sensitive.
Two sets of functional genomics experiments were conducted under different cultivation conditions. First, biological triplicate cultures of strain RL08 harboring pTrc99A-BTE or pTrc99A-BTE-H204A were grown at 37°C with 250 rpm shaking in 2-liter shake flasks containing 500 ml of EZ rich defined medium (Teknova, Hollister, CA) supplemented with 0.2% glucose, 0.01 mM biotin, and 100 μg ml−1 ampicillin. Cultures were induced at an optical density at 600 nm (OD600) of 0.2 with a final concentration of 50 μM IPTG. Additional experiments were conducted in biological duplicates with strain RL08 harboring pBAD35-BTE and pBAD33, pBAD35-BTE and pBAD33-ACC, or pBAD35-BTE-H204A and pBAD33, in a single-wall baffled fermentor vessel (Applikon Biotechnology, Schiedam, Netherlands) with a 12-liter working volume containing 4 liters of EZ rich defined medium supplemented with 0.4% glycerol, 0.01 mM biotin, 34 μg ml−1 chloramphenicol, and 25 μg ml−1 kanamycin. A temperature of 37°C, pH 7.0 ± 0.2, and 700 rpm agitation were maintained with an ez-Control unit (Applikon Biotechnology). A 5% solution of hydrochloric acid and 2 N sodium hydroxide were utilized for maintaining pH, and a 1:1,000 dilution of antifoam 204 (Sigma, St. Louis, MO) in water was added as necessary to minimize overflow due to foaming. Air was sparged at a flow rate of 4 liters min−1. Cultures were induced with 0.2% l-arabinose at an OD600 of 0.2.
Cultures sampled for qPCR analysis, flow cytometry, CFU ml−1 counts, and microscopy were grown in biological duplicates or triplicates in baffled shake flasks with a 4× headspace, as described for microarray experiments with RL08/pTrc99A-BTE. Exogenous addition of fatty acids was performed with strains RL08 and RL08/pTrc99A, with 0.5 g liter−1 of lauric acid (from a 50-g liter−1 stock in ethanol) or an equivalent volume of ethanol as a negative control, added at an OD600 of 0.1 to 0.2.
RNA sample preparation.
Samples for RNA isolation for microarray experiments were collected by adding 10 OD600 · ml of culture to a 1/8 volume of a chilled solution of 5% saturated phenol in absolute ethanol. Deionized water was added such that the ratio of aqueous solution to phenol-ethanol was constant. After centrifugation (5,000 × g, 4°C, 12 min), each supernatant was removed, and the remaining cell pellets were flash-frozen in a dry ice-ethanol bath and stored at −80°C. Total RNA was purified from frozen cell pellets using the Qiagen (Valencia, CA) RNAprotect bacteria reagent kit with lysozyme treatment and proteinase K digestion of cell lysates, and purification of total RNA was performed with the Qiagen RNeasy minikit as described in the product handbook.
For quantitative reverse transcription-PCR (RT-PCR), 0.8 OD600 · ml of each culture was centrifuged (16,000 × g, 1 min), supernatants were removed, and cell pellets were stored at −80°C. RNA was extracted using the Qiagen RNeasy minikit according to the manufacturer's instructions. Residual DNA was removed by DNase digestion (DNA-free kit; Ambion, Austin, TX). RNA samples were quantified using a NanoDrop spectrophotometer (Thermo Scientific, Wilmington, DE), and RNA quality was assessed using an Agilent BioAnalyzer (Agilent Technologies, Santa Clara, CA) using the Prokaryote Total RNA Nano series II chip set.
cDNA synthesis and hybridization.
For microarray hybridization, 10 μg of RNA was used to synthesize cDNA, and 1 μg was labeled with Cy3 according to the NimbleGen arrays user guide (70). Cy3-labeled cDNA samples were hybridized to Roche NimbleGen (Madison, WI) Escherichia coli K-12 (accession number NC_000913) microarray slides containing 4 arrays per slide and 72,000 probes per array. The arrays were scanned on a GenePix 4000B scanner (Molecular Devices, Sunnyvale, CA) with a photomultiplier tube gain to achieve 1 × 10⁻⁵ normalized counts at saturated intensity level. The images were processed and .pair files were generated based on nonnormalized intensities.
For quantitative RT-PCR, cDNA was synthesized using the GoScript reverse transcription system (Promega, Madison, WI) with 1 μg of template RNA, 2.5 mM MgCl2, and random hexamer primers. Extension was carried out for 1 h at 42°C.
Microarray data analysis.
Scanned probe intensities were imported into the ArrayStar software (DNASTAR, Madison, WI) and processed with robust microarray analysis (RMA) background correction, quantile normalization to adjust the probe intensity distributions to be the same across all cross-compared arrays, and RMA median polish summarization to generate gene-level signal values from the normalized probe intensities (12). Mean intensities were determined across all array and sample technical replicates and then across biological replicates to yield the final expression values. Linear changes in expression values are reported, with P values calculated across biological replicates based on a moderated t test (79) using the ArrayStar software. Ratios with a change greater than or equal to |2-fold| and with P values less than or equal to 0.05 were considered significant. To generate a filtered list of significantly regulated genes found in both the glucose-supplemented and glycerol-supplemented cultures, significance criteria were relaxed such that the fold change was greater than or equal to |1.8| and the P value was less than or equal to 0.1 for the glycerol-supplemented cultures, or 0.05 for the glucose-supplemented cultures.
Quantitative RT-PCR.
The cDNA was diluted 10-fold in water, and 5.0 μl was amplified using the Maxima SYBR green/fluorescein qPCR master mix (Fermentas, Glen Burnie, MD). For the selected housekeeping gene rrs (encoding 16S rRNA), 5.0 μl of 100-fold diluted cDNA was used as a template, due to its high abundance. SYBR green fluorescence was monitored with a Bio-Rad (Hercules, CA) CFX96 optical reaction module. Threshold cycle (CT) values were calculated by using Bio-Rad CFX Manager software, and fold changes were calculated as 2−ΔΔCT with inner normalization to the rrs housekeeping gene (51). Standard deviations of ΔCT values for three biological triplicates were propagated to obtain standard errors for each fold change value.
Protein sample preparation.
For protein isolation, approximately 20 OD600 units · ml of culture was centrifuged as described for RNA isolation. The resulting cell pellets were flash-frozen in a dry ice-ethanol bath and stored at −80°C. Cells were resuspended in 100 mM ammonium bicarbonate, pH 8.0 buffer and lysed with a Barocycler NEP3229 using FT500 PULSE tubes (Pressure BioSciences Inc., South Easton, MA; 10 cycles; 35,000 lb/in2; 20-s/cycle). Protein concentrations of the lysates were determined using a Bradford assay, and 100 μg of protein was denatured by the addition of 7 M urea and 5 mM dithiothreitol, followed by incubation at 60°C for 30 min. The samples were diluted 10-fold with 100 mM ammonium carbonate, and calcium chloride was added to a final concentration of 1 mM. Samples were digested with trypsin (1:50 trypsin/protein ratio) for 3 h at 37°C and desalted using 1-ml, 50-mg Discovery DSC-18 solid-phase extraction (SPE) columns (Supelco, St. Louis, MO). Each SPE column was conditioned using methanol and rinsed with 0.1% trifluoroacetic acid (TFA) in water. Samples were introduced to the columns and washed with 95:5 water/acetonitrile containing 0.1% TFA. Excess liquid was removed from the columns under vacuum, and samples were eluted using 80:20 acetonitrile/water and 0.1% TFA and concentrated in a Savant SpeedVac (Thermo Scientific) to a final volume of 50 to 100 μl. Final peptide concentrations were determined using a bicinchoninic acid protein assay.
Peptide analysis by capillary liquid chromatography/mass spectrometry.
Identification and quantification of individual peptides was performed by LC-tandem MS (LC-MS/MS). The high-performance liquid chromatography system and method used for capillary LC have been described in detail elsewhere (49). MS/MS data acquisition on an LTQ Velos orbitrap mass spectrometer (Thermo Scientific) began 20 min after sample injection and continued for 100 min over a mass (m/z) range of 400 to 2,000. For each cycle, using a dynamic exclusion time of 60 s, the six most abundant ions from MS were selected for MS/MS, using a collision energy setting of 45%.
Proteomics data analysis.
Quantitative analysis utilized the PNNL-developed accurate mass and time (AMT) tag approach (90) based on a previously established AMT tag peptide database for E. coli containing the characteristic accurate mass and LC separation elution time. The end result was a usable list of quantitative protein identifications for each sample. Tools used for quantitative analysis were a visualization program, VIPER (60), to correlate LC/MS features to the peptide identifications in the AMT tag database, and DAnTE software for peptide peak intensity value determination, normalization, and protein roll-up using Rrollup parameters (66). Only those proteins that were detected in two out of two instrumental technical replicates, in two out of three sample technical replicates (fermentor samples only), and in all biological replicates were considered for further analysis. The rolled-up protein abundances or abundances of single peptides, when they represented the only peptide identified from a protein, were averaged, and fold changes in abundance between the BTE-expressing cultures and BTE-H204A-expressing cultures were calculated at each sampling point. A two-tailed t test assuming equal sample variance was performed using Microsoft Excel (Redmond, WA) on the averaged biological replicate level data. Only those proteins that had a greater than |2|-fold change in abundance and decrease in abundance and P value of ≤0.05 were considered significantly differentially expressed.
Fatty acid extraction and analysis.
Fatty acids were extracted and methylated from cell cultures as previously described (48). GC/MS analysis and peak identification and quantification were performed on a model 7890 Agilent GC with a model 5975 mass spectrometer as previously described (48). Technical duplicates from each independent culture were averaged, and the average fatty acid concentrations from two (fermentors) or three (shake flasks) independent cultures were determined.
Glucose analysis.
Culture samples (0.5 ml) were incubated in centrifuge tubes at 100°C for 15 min and filtered using 0.22-μm centrifugal filters (16,000 × g, 10 to 15 min). The flowthrough was stored at −20°C prior to analysis. Samples were diluted 5-fold in deionized water prior to injection of 2 μl onto a Waters Acquity UPLC system (Milford, MA) with an evaporative light scatter detector. Samples were separated on a Waters Acquity UPLC BEH glycan 1.7-μm column with 0.2-ml min−1 flow for the mobile phase (74.9% acetonitrile, 24.9% water, and 0.2% triethylamine; adjusted to pH 9.1 with glacial acetic acid). Quantification was achieved by comparison of peak areas with a glucose standard curve.
Cell viability measurements from plate counts.
Volumes of cell cultures were serially diluted in phosphate-buffered saline (PBS; 137 mM NaCl, 27 mM KCl, 10 mM Na2HPO4, 2 mM KH2PO4; pH 7.4) and spread onto LB agar plates (containing no antibiotics) at the indicated times. Individual colonies were counted after overnight incubation at 37°C and an additional overnight incubation at room temperature, due to the wide range of colony sizes observed in BTE-expressing strains after overnight incubation.
SYTOX flow cytometry assays.
To assess cell permeability, cell pellets collected by centrifugation of 0.5- to 1-ml culture samples were resuspended in 1 ml of PBS, diluted 1,000- to 2,000-fold in 1 ml PBS, and stained by addition of 1 μl of 5 mM SYTOX green in dimethyl sulfoxide (Invitrogen). Staining proceeded for 10 to 30 min prior to flow cytometric analysis using a Guava EasyCyte Plus flow cytometer (Millipore, Billerica, MA) with 488-nm excitation and simultaneous measurement of forward scatter and 525-nm (green) emission on logarithmic scale photodetectors. Forward scatter with no minimum threshold was selected as the trigger for events, and 5,000 events were collected per sample. Green fluorescence histograms were constructed by binning logarithmic-scale green fluorescence values between 0 and 1,000 in increments of 10 and averaging the number of events per bin between three biological replicates.
Additional strain engineering.
Strains containing marA::kan, rob::kan, soxS::kan, and pspF::kan loci (Table 1) were obtained from the Keio Collection (9). Gene deletions were transduced into strain RL08 by P1 phage as previously described (48) to generate strains RL09, RL10, RL11, and RL12, respectively, which were verified by colony PCR and GoTaq Green master mix (Promega, Madison, WI). The kan cassette was removed from strain RL12 by transforming plasmid pCP20 (16), which encodes a FLP recombinase. The strain was cured of pCP20 by repeated incubations at 43°C to generate strain RL13.
The marA, rob, and soxS genes were amplified by PCR using E. coli K-12 MG1655 genomic DNA as template. The forward primers introduced an artificial ribosome binding site (AGGAGG) and spacer sequence (ATTATAAA) prior to the start codon of each gene. PCR products were cloned into pBAD18 (32) between the XbaI and HindIII sites to generate plasmids pBAD18-MarA, pBAD18-Rob, and pBAD18-SoxS. The pspABCDE operon and the putative native ribosome binding site upstream of pspA was amplified by PCR. The PCR product was cloned into pBAD18 between the SacI and XmaI sites to generate plasmid pBAD18-Psp.
To test the impact of these additional gene deletions or overexpressed genes on cell viability and fatty acid production, pBAD33-BTE or pBAD33-BTE-H204A, and also pBAD18, pBAD18-MarA, pBAD18-Rob, pBAD18-SoxS, or pBAD18-Psp, were transformed into strain RL08 or strain RL08 with additional gene deletions by a chemical method (16). Fresh transformants were grown in biological triplicates overnight in LB medium supplemented with the appropriate antibiotics (34 μg ml−1 chloramphenicol and 50 μg ml−1 ampicillin). Cultures were inoculated to an initial OD600 of 0.01 in 50 ml LB medium supplemented with 0.4% glycerol and appropriate antibiotics in 250-ml shake flasks. Cultures were induced with 0.2% arabinose at an OD600 of 0.2. After 8 h, cells were dilution plated as described above for measuring CFU ml−1. After 24 h, 200 μl of 1:10-diluted antifoam 204 (Sigma, St. Louis, MO) in ethanol was added to each culture, and samples with significant foam (all BTE-expressing cultures) were heated with gently swirling in an 85°C water bath for 5 to 10 min to assist with foam collapse. Samples were taken in technical duplicates from each culture for fatty acid analysis as described above. Technical duplicate fatty acid concentrations were averaged prior to analyzing the means and standard deviations of biological triplicate cultures.
Microarray data accession number.
Complete data, including raw pair files and RMM background-corrected, quantile-normalized average log2 intensities, are available as a GEO data set under accession number GSE29424.
RESULTS
Cell viability and morphology.
In prior studies, the OD600 of RL08 expressing BTE from high-copy-number plasmids was significantly reduced following induction relative to RL08 expressing nonfunctional BTE-H204A from the same plasmids (48). Furthermore, an optimum FFA titer was achieved when BTE was expressed on low-copy-number plasmids, strongly supporting the presence of a toxic effect resulting from FFA overproduction that is independent of effects resulting from protein overexpression (48). Additionally, induced shake flask cultures of RL08/pTrc99A-BTE exhibit reductions in OD600 during stationary phase (38) that may be indicative of cell lysis. To test the hypothesis that FFA overproduction is toxic, measurement of CFU ml−1 was performed at four sampling times (mid-log phase at OD600 between 0.8 and 1.0, transition period after log-phase growth had ceased but prior to plateauing of the OD600 at 4.5 h postinoculation, early stationary phase at 5.8 h, and mid-stationary phase at 10 h) on LB agar plates for cultures of RL08/pTrc99A-BTE-H204A and RL08/pTrc99A-BTE (Table 2). Cultures expressing BTE contained nearly 50% fewer CFU ml−1 in mid-log phase and approximately 85% fewer CFU ml−1 in early stationary phase than cultures expressing BTE-H204A at the same sampling times.
Table 2.
Viable cell counts at specified times from induced cultures of RL08/pTrc99A-BTE-H204A and RL08/pTrc99A-BTE grown in shake flasks containing EZ rich defined medium supplemented with 0.2% glucose
| Sampling time | Viable cell counts (CFU/ml)a |
|
|---|---|---|
| BTE-H204A | BTE | |
| Mid-log | (2.44 ± 0.29) × 108 | (9.9 ± 2.3) × 107 |
| Transition | (2.44 ± 0.28) × 109 | (4.1 ± 0.1) × 108 |
| Early stationary | (3.6 ± 0.6) × 109 | (5.3 ± 1.9) × 108 |
| Mid-stationary | (5.3 ± 1.9) × 109 | (9.7 ± 1.3) × 108 |
Means ± standard deviations.
An alternative measure of bacterial cell viability can be obtained by staining cells with SYTOX green nucleic acid dye, which is impermeable to cells when the inner membrane is intact. Staining of intact cells produces a weak green fluorescence that is associated with staining of the cell surface (73). In contrast, stained cells with compromised inner membranes exhibit an intense green fluorescence associated with nucleic acid binding by the dye (73). Samples of strains RL08/pTrc99A-BTE-H204A and RL08/pTrc99A-BTE were taken immediately prior to induction at an OD600 0.2 (preinduction) and after 4.3 h (transition), 6.3 h (early stationary phase), and 8.3 h (mid-stationary phase) and stained with SYTOX green to obtain a time course of measurements. Log-scale forward scatter and green fluorescence measurements were collected by flow cytometry. Forward scatter histograms (Fig. 1a) exhibited nearly identical distributions between BTE-H204A- and BTE-expressing cells before induction, with larger forward scatter values typical of the relatively elongated cells of log-phase growth (1). During the transition from log-phase growth and continuing throughout stationary phase, histograms for BTE-H204A-expressing cells shifted toward smaller forward scatter values. This is consistent with the contraction in size of wild-type E. coli cells as they deplete nutrients but continue dividing during early stationary phase (1). In contrast, BTE-expressing cells exhibited a broader distribution of forward scatter values, indicative of increased heterogeneity in cell size. Green fluorescence histograms of the BTE-expressing strain (Fig. 1b) revealed an increasing population of cells having intense green fluorescence from mid-log phase into stationary phase, indicating compromised inner membrane integrity. In contrast, the BTE-H204A-expressing strain exhibited a single population of cells possessing weak green fluorescence.
Fig. 1.

(a) Averaged log-scale forward scatter of cells taken from cultures of RL08/pTrc99A-BTE (gray) and RL08/pTrc99A-BTE-H204A (black) grown in EZ rich defined medium supplemented with 0.2% glucose at the sampling times defined in the text. Control cells expressing BTE-H204A demonstrated a shift from larger forward scatter values during log-phase growth (OD600, 0.2) to much smaller forward scatter values during stationary phase. In contrast, cells expressing BTE exhibited a broadened forward scatter distribution corresponding to a larger average but more heterogeneous range of cell sizes. (b) Green fluorescence (485-nm excitation, 525-nm emission) histograms of SYTOX green-stained cells taken from cultures of RL08/pTrc99A-BTE (gray) and RL08/pTrc99A-BTE-H204A (black) at the sampling times described in the text. Cells expressing BTE-H204A yielded a homogeneous population exhibiting weak green fluorescence. In contrast, cells expressing BTE exhibited a binary distribution with an increased population of cells exhibiting bright green fluorescence beginning in early stationary phase. Increased fluorescence is indicative of compromised inner membrane integrity.
To determine whether the observed phenotypes were specific to endogenous FFA overproduction or exacerbated by the presence of ampicillin, cell viability and SYTOX staining were evaluated on RL08 and RL08/pTrc99A cells exposed to exogenously added lauric acid (0.5 g liter−1) at an OD600 mimicking the induction time of fatty acid-overproducing strains, in order to present a stringent comparison to endogenous production. Little to no drop in viable cell counts was observed at 4.5 h and 10 h postinoculation (see Table S3 in the supplemental material). The heterogeneous distribution of colony sizes observed in BTE-expressing cells was absent in both RL08 and RL08/pTrc99A exposed to exogenous FFAs (see Fig. S2a and b in the supplemental material). The colony size distribution of cells exposed to lauric acid was also indistinguishable from control cells. Furthermore, SYTOX green staining indicated a significantly lower proportion of cells exhibiting bright green fluorescence from cultures with exogenously added lauric acid compared to cells that endogenously overproduce FFAs (see Fig. S2c and d).
Cultivation of E. coli for functional genomics study.
To determine a functional basis for the observed losses in viability and membrane integrity, global mRNA and protein levels were measured from triplicate shake flask cultures of RL08/pTrc99A-BTE-H204A and RL08/pTrc99A-BTE in a rich defined medium supplemented with glucose. RNA and protein samples were isolated during mid-log phase (OD600 of 0.8; two doublings after induction), during early stationary phase (defined as 1 h after the instantaneous growth rate dropped to one-fourth of the log-phase growth rate), and during mid-stationary phase (defined as 4 h after the early-stationary-phase sampling point). In addition, culture samples were taken periodically to monitor the OD600, glucose levels (Fig. 2a), and fatty acid content (Fig. 2b and 3) from the same cultures. As expected, expression of BTE resulted in production of elevated levels of fatty acids, primarily with a carbon chain length between 8 and 14 (and predominantly 12 carbons) relative to cultures expressing BTE-H204A (Fig. 2b). In a second set of experiments, RL08 harboring a combination of plasmids expressing either BTE or BTE-H204A (in pBAD35) and the four subunits of ACC or an empty vector (pBAD33) were cultivated in fermentors in a rich defined medium supplemented with glycerol. Samples for mRNA and protein quantification were isolated during late log phase (OD600 of 2.0), early stationary phase (defined as for the shake flask cultures, mRNA only), and mid-stationary phase (12 h). Growth curves are provided in the Fig. S3 of the supplemental material. The shake flask cultures and fermentor cultures were grown in the presence of different antibiotics (ampicillin and chloramphenicol/kanamycin), carbon sources (glucose and glycerol), and utilized different inducing agents (IPTG and arabinose). Genes and proteins that were differentially expressed in both the shake flask and fermentor experiments would be more specifically representative of the perturbations resulting from fatty acid overproduction.
Fig. 2.

(a) OD600 of cultures expressing RL08/pTrc99A-BTE-H204A (solid diamonds) or RL08/pTrc99A-BTE (empty diamonds) grown at 37°C in EZ rich defined medium supplemented with 0.2% glucose in shake flasks. A decrease in the OD600 was observed, beginning in early stationary phase for BTE-expressing cultures relative to BTE-H204A-expressing cultures. Glucose utilization is also indicated for BTE-H204A (solid squares) and BTE (empty squares) and proceeded at the same rate in all cultures. Sampling times for RNA and protein are indicated with dashed vertical lines. (b) Medium (8- to 14-carbon)-chain-length fatty acid titers in cultures expressing BTE-H204A (solid circles) or BTE (empty circles).
Fig. 3.

Titers of individual long-chain fatty acids in cultures expressing BTE-H204A (solid) and BTE (empty) as a function of growth time, including (a) palmitic acid (C16:0), (b) stearic acid (C18:0), (c) palmitoleic acid (C16:1), and (d) vaccenic acid (C18:1). Decreases in concentration of the saturated species (a and b) were observed, with little change in the concentration of unsaturated species (c and d).
Free fatty acid overproduction increases the long-chain unsaturated fatty acid content.
A GC/MS analysis of the fatty acid composition of FFA-overproducing and control strains was conducted. In both functional genomics experiments, the percentage of unsaturated long-chain (16 to 18 carbon chain length) fatty acids was significantly increased in FFA-overproducing strains. In BTE-expressing shake flask cultures, the percentage of long chain fatty acid unsaturation leveled off at 56% during stationary phase, from the earliest measured value of 43% during mid-log phase. In BTE-H204A-expressing shake flask cultures, the percentage was at a maximum value of 42% at 4 h, with a steady decrease to 30% unsaturation after 24 h. This increase in unsaturated fatty acid content was due almost entirely to a decrease in palmitic acid (C16:0) content (Fig. 3a) in the BTE-expressing strain rather than from an increase in palmitoleic acid (C16:1) and vaccenic acid (C18:1) content (Fig. 3c and d). A significant decrease in stearic acid (C18:0) content from approximately 2.0% to 1.5% was also detectable (Fig. 3b). A similar trend was previously observed when BTE was expressed in E. coli K27, a fadD mutant strain, with large increases in the percentage of C16:1 and C18:1 observed in extracted phospholipids (83). It has been postulated that this shift in phospholipid composition is due to the depletion of the pool of saturated acyl-ACPs by BTE (83). BTE-expressing cultures grown in fermentors exhibited similar increases in unsaturated 16- to 18-carbon-chain-length fatty acids (48% versus 22% in BTE-H204A-expressing cultures at 20 h) (see Fig. S4 in the supplemental material).
DNA microarray analysis.
Transcript profiles of BTE-H204A- and BTE-expressing strains were compared to identify stress responses and transcriptional cascades linked to FFA overproduction. During mid-log phase, only a small set of genes was identified as being significantly differentially regulated (fold change of ≥|2| and P ≤ 0.05) in BTE-expressing shake flask cultures relative to the corresponding BTE-H204A control. Out of the 4,240 genes analyzed on DNA microarrays, 20 genes displayed increased expression levels and 3 genes displayed decreased expression levels compared to the control strain. More dramatic changes were observed during stationary phase, with 283 genes having increased expression levels and 350 genes having decreased expression levels in early stationary phase. In mid-stationary phase, 477 genes were increased and 564 genes were decreased in expression. The extents of changes in mean gene expression values for each strain at the three sampling times are presented as a hierarchical clustering analysis (Fig. 4).
Fig. 4.
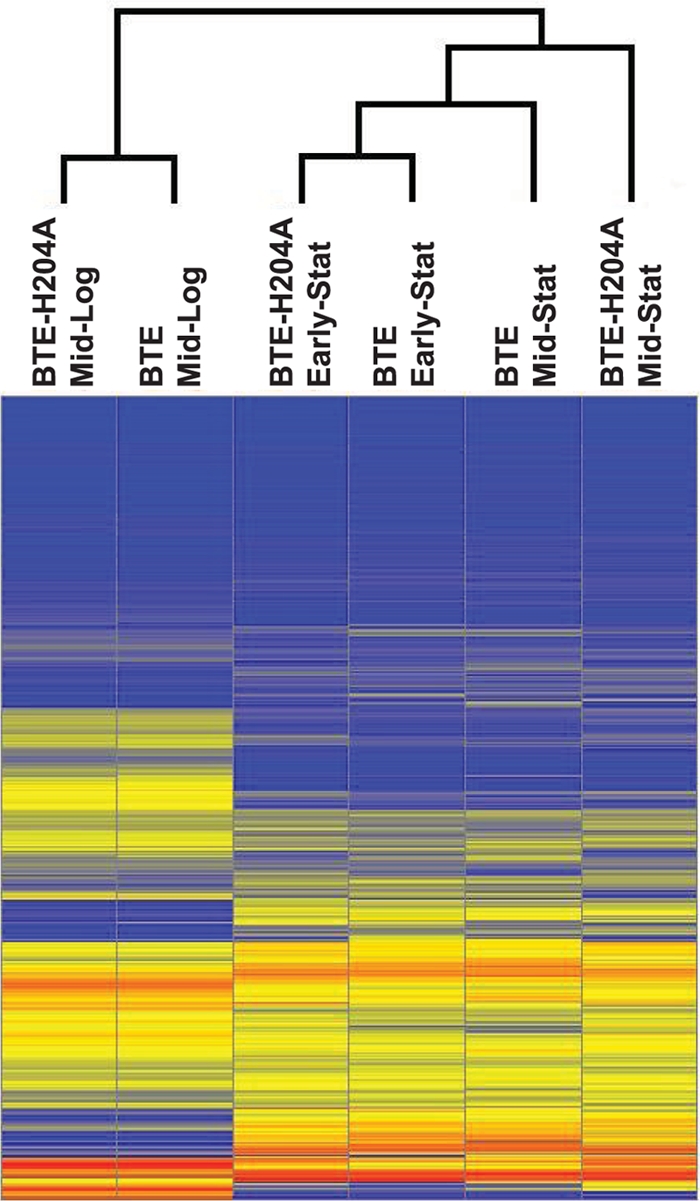
Heat map of mean gene expression values at three sampling times (mid-log phase; early stat, early stationary phase; mid stat, mid-stationary phase) for strain RL08/pTrc99A-BTE-H204A and RL08/pTrc99a-BTE grown in EZ rich defined medium supplemented with 0.2% glucose in shake flasks. Hierarchical clustering was performed with the ArrayStar software, with the closest pair clusters of gene expression profiles for each strain and sampling time indicated at the top. Mid-log-phase and early-stationary-phase profiles between the two strains were the most similar to each other. The mid-stationary-phase profile for BTE was more similar to the early-stationary-phase profiles of either strains than to the mid-stationary-phase profile of BTE-H204A. All stationary-phase profiles were more similar to each other than to the mid-log-phase profiles.
Additional transcript profiles were obtained from strain RL08 grown in fermentors. Fewer statistically significant, differentially expressed genes were identified in the fermentor cultures, which were grown in biological duplicate. A cross-comparison of significant differentially expressed genes present in both the shake flask and fermentor cultures across all sampling times (defined here as a fold change of ≥|1.8| and P ≤ 0.05 for shake flask cultures; P ≤ 0.10 for fermentor cultures) identified a key set of 150 upregulated genes and 112 downregulated genes (see the supplemental material). To validate results from the microarray data, three genes were selected for qPCR analysis of cDNA derived from RNA extracted from independent cultures of RL08/pTrc99A-BTE or RL08/pTrc99A-BTE-H204A cells grown in rich defined medium supplemented with glucose. Fold changes in expression calculated from qPCR cycle threshold values showed similar trends to the microarray fold changes (Table 3).
Table 3.
Changes in expression of selected genes in BTE-expressing strains versus BTE-H204A expressing strains as measured by qPCR
| Locus | Gene name | Fold changea (mean ± SE) at phase |
||
|---|---|---|---|---|
| Mid-log | Early stationary | Mid-stationary | ||
| b0954 | fabA | −1.12 ± 0.58 (−1.28, 0.087) | −4.05 ± 1.43 (−2.54, 0.004) | −8.15 ± 2.92 (−4.80, 0.000) |
| b1307 | pspD | 1.14 ± 0.62 (−1.03, 0.82) | 38.8 ± 11.9 (4.99, 0.002) | 57.0 ± 24.5 (9.60, 0.002) |
| b2237 | inaA | 1.08 ± 0.71 (1.58, 0.001) | 1.80 ± 0.61 (7.72, 0.000) | 2.76 ± 0.89 (5.72, 0.000) |
Sampling times were as defined in Materials and Methods. Standard errors are provided between biological triplicates. Values in parentheses below each qPCR fold change value correspond to the measured fold change observed in the equivalent DNA microarray experiment, with the P value provided in italics.
Differential proteomics analysis.
In shake flask experiments, a total of 2,214 proteins were detected in at least one technical replicate from at least one sampling time (mid-log phase, early stationary phase, or mid-stationary phase) from at least one peptide, and of these, 1,424 proteins were identified from at least two peptides. In fermentor experiments for three strains (BTE-H204A-expressing, BTE-expressing, and BTE-expressing and ACC-overexpressing strains), a total of 3,270 proteins were detected in at least one technical replicate from at least one sampling time (late log phase, mid-stationary phase) from at least one peptide, and of these, 2,498 proteins were identified from at least two peptides. Filtering, averaging, and statistical tests were applied between technical and biological replicates as described in Materials and Methods. This analysis resulted in a total of 42 proteins (37 from more than one peptide) in mid-log phase, 127 proteins (122 from more than one peptide) in early stationary phase, and 110 proteins (104 from more than one peptide) in mid-stationary-phase shake flask cultures identified as differentially expressed (P ≤ 0.05), with a much more select number of proteins exhibiting fold changes greater than or equal to 2 with a P value of ≤0.05 (see Table S4 in the supplemental material). Of the proteins with P values of ≤0.05 and a greater-than-2-fold change in expression, 44% were identified as being differentially expressed in the same direction at the transcript level from at least one sampling time. Comparing differential expression between the BTE-expressing strain and the BTE-H204A-expressing strains grown in fermentors, 80 proteins (79 from more than one peptide) in late log phase and 99 proteins (98 from more than one peptide) in mid-stationary phase were differentially regulated (P ≤ 0.05), with only a few proteins exhibiting both a P value of ≤0.05 and a greater-than-2-fold change in expression (see Table S5 in the supplemental material). In each proteomics data set, BTE and BTE-H204A were identified in the proteomics data sets from dozens of individual peptides, with a single peptide containing either the original (WNDLDVNQHVNNLK) or mutated histidine residue. As expected, the histidine-containing peptide was present in all BTE-expressing samples, and the alanine-containing peptide was present in all BTE-H204A-expressing samples. Because of the low genome coverage and relatively small number of proteins identified as significantly differentially expressed, the proteomics analysis was used primarily for validation of trends in the microarray data sets in this study, and a complete analysis was not performed here.
Induction of phage shock proteins.
Among the most significantly upregulated genes beginning in stationary phase in both the fermentor and shake flask cultures were those encoding the phage shock proteins (Table 4). PspA was also identified in proteomics data as being significantly differentially expressed in mid-stationary-phase shake flask cultures expressing BTE and in BTE-expressing, ACC-overexpressing cultures grown in fermentors (Table 5). Phage shock proteins are encoded in two operons (pspABCDE and pspG) and are induced under a variety of conditions that induce cell envelope stress and affect energy generation (39), including treatment with various organic solvents, such as hexane (45) and ethanol (14), and following exposure to octanoic acid (86) but not isobutanol (15). Transcription from the promoters of both operons is σ54 dependent and is activated by the transcriptional dual regulator PspF (39). PspA is believed to play a physical role in stabilizing membranes (24, 80) and has been shown to suppress proton leakage of damaged liposomes composed of E. coli phospholipids (46).
Table 4.
Transcript changes for BTE-expressing strains versus BTE-H204A-expressing strains cultured in EZ rich defined medium supplemented with 0.2% glucose (EZ glucose) in shake flasks and in EZ rich defined medium supplemented with 0.4% glycerol (EZ glycerol) in fermentorsa
| Protein group and locus | Gene name | Fold transcript changeb in the indicated medium at growth phase |
|||||
|---|---|---|---|---|---|---|---|
| EZ glucose |
EZ glycerol |
||||||
| Mid-log | Early stationary | Mid-stationary | Late log | Early stationary | Mid-stationary | ||
| Phage shock proteins | |||||||
| b1304 | pspA | 9.45 (0.000) | 11.04 (0.001) | 10.47 (0.000) | 12.63 (0.000) | ||
| b1305 | pspB | 5.18 (0.001) | 7.32 (0.001) | 7.09 (0.000) | 12.07 (0.000) | ||
| b1306 | pspC | 4.11 (0.002) | 5.07 (0.000) | 5.34 (0.000) | 8.76 (0.001) | ||
| b1307 | pspD | 4.99 (0.002) | 9.60 (0.002) | 9.78 (0.004) | 19.10 (0.000) | ||
| b1308 | pspE | 2.74 (0.000) | 11.40 (0.008) | 8.35 (0.005) | 19.47 (0.001) | ||
| MarA/Rob/SoxS regulon | |||||||
| b0447 | ybaO | 1.73 (0.018) | 4.64 (0.000) | ||||
| b0463 | acrA | −1.45 (0.005) | |||||
| b0578 | nfsB | 1.37 (0.043) | 1.53 (0.043) | ||||
| b0683 | fur | 1.69 (0.031) | |||||
| b0684 | fldA | 2.80 (0.001) | |||||
| b0819 | ybiS | −2.28 (0.000) | |||||
| b0850 | ybjC | 1.36 (0.004) | 2.65 (0.000) | 1.73 (0.003) | 5.32 (0.002) | ||
| b0851 | nfsA | 2.06 (0.020) | 4.29 (0.000) | 2.32 (0.007) | |||
| b0852 | rimK | 2.54 (0.005) | |||||
| b0853 | ybjN | 1.85 (0.002) | 2.06 (0.079) | ||||
| b0871 | poxB | 1.76 (0.014) | |||||
| b0950 | pqiA | 2.52 (0.003) | 5.92 (0.000) | 2.14 (0.100) | |||
| b0951 | pqiB | 2.94 (0.003) | |||||
| b1014 | putA | 2.53 (0.018) | 1.84 (0.085) | 2.27 (0.046) | |||
| b1053 | mdtG | 1.83 (0.013) | 2.20 (0.007) | 2.09 (0.033) | |||
| b1101 | ptsG | −2.61 (0.000) | −2.86 (0.014) | 1.96 (0.060) | |||
| b1277 | ribA | −1.42 (0.007) | 1.37 (0.052) | ||||
| b1530 | marR | 2.50 (0.037) | 2.72 (0.004) | 5.20 (0.000) | 1.96 (0.031) | 2.79 (0.013) | 5.96 (0.007) |
| b1531 | marA | 1.73 (0.018) | 5.21 (0.000) | 6.25 (0.000) | 2.91 (0.001) | 6.10 (0.010) | |
| b1532 | marB | −1.36 (0.037) | |||||
| b1611 | fumC | 4.39 (0.000) | 8.51 (0.000) | 2.15 (0.013) | |||
| b1852 | zwf | −1.77 (0.001) | |||||
| b1973 | zinT | 1.75 (0.001) | |||||
| b2159 | nfo | 2.00 (0.032) | 2.46 (0.004) | 1.89 (0.044) | |||
| b2237 | inaA | 1.58 (0.001) | 7.72 (0.000) | 5.72 (0.000) | 1.34 (0.073) | 2.10 (0.001) | 7.52 (0.005) |
| b3035 | tolC | −1.03 (0.081) | |||||
| b3037 | ygiB | 1.78 (0.006) | 2.77 (0.003) | 1.33 (0.058) | |||
| b3038 | ygiC | 1.61 (0.002) | 5.53 (0.000) | ||||
| b3506 | slp | 3.95 (0.000) | 22.72 (0.000) | −1.66 (0.049) | |||
| b3507 | dctR | 1.38 (0.006) | 1.69 (0.006) | ||||
| b3508 | yhiD | 2.05 (0.025) | 6.85 (0.020) | ||||
| b3509 | hdeB | 3.94 (0.002) | 67.71 (0.000) | −3.67 (0.018) | |||
| b3510 | hdeA | 3.11 (0.002) | 36.27 (0.000) | −3.27 (0.017) | |||
| b3624 | rfaZ | 1.31 (0.043) | |||||
| b3625 | rfaY | 1.35 (0.038) | |||||
| b3800 | aslB | 1.47 (0.034) | 1.65 (0.028) | ||||
| b3908 | sodA | 1.47 (0.002) | 2.29 (0.001) | 1.49 (0.065) | |||
| b3924 | fpr | −1.24 (0.028) | 1.51 (0.006) | 2.22 (0.014) | |||
| b4025 | pgi | 2.47 (0.020) | −1.58 (0.089) | ||||
| b4062 | soxS | 2.56 (0.008) | 4.52 (0.057) | ||||
| b4177 | purA | −1.78 (0.007) | −5.92 (0.000) | 1.46 (0.087) | |||
| b4396 | rob | 2.85 (0.002) | |||||
| b4637 | uof | 1.32 (0.042) | |||||
| Energy metabolism | |||||||
| b0428 | cyoE | 1.47 (0.010) | 3.65 (0.003) | 1.81 (0.096) | 1.98 (0.042) | ||
| b0429 | cyoD | 2.47 (0.007) | 1.78 (0.057) | 1.95 (0.046) | |||
| b0430 | cyoC | 2.00 (0.015) | 2.05 (0.060) | ||||
| b0431 | cyoB | 2.15 (0.001) | |||||
| b0432 | cyoA | 1.28 (0.037) | 2.24 (0.004) | 1.67 (0.075) | |||
| b0972 | hyaA | 15.29 (0.000) | |||||
| b0973 | hyaB | −1.95 (0.016) | 14.59 (0.000) | ||||
| b0974 | hyaC | 19.18 (0.000) | |||||
| b0975 | hyaD | 12.76 (0.000) | |||||
| b0976 | hyaE | 5.47 (0.001) | |||||
| b0977 | hyaF | 5.06 (0.005) | |||||
| b0978 | appC | −3.07 (0.001) | −1.52 (0.097) | −1.74 (0.014) | −2.95 (0.092) | ||
| b0979 | appB | −2.26 (0.000) | −1.82 (0.016) | −2.76 (0.087) | |||
| b0980 | appA | −2.06 (0.001) | −1.67 (0.074) | −1.98 (0.017) | |||
| b1974 | yodB | −2.57 (0.000) | −2.40 (0.016) | ||||
| b2276 | nuoN | 2.42 (0.015) | |||||
| b2277 | nuoM | −1.81 (0.000) | 2.93 (0.006) | ||||
| b2278 | nuoL | −1.70 (0.001) | 1.68 (0.019) | ||||
| b2279 | nuoK | 1.76 (0.012) | |||||
| b2280 | nuoJ | 1.82 (0.030) | |||||
| b2281 | nuoI | 2.91 (0.008) | 1.92 (0.054) | ||||
| b2282 | nuoH | 3.27 (0.008) | 1.83 (0.071) | ||||
| b2410 | yfeH | 2.53 (0.038) | 1.81 (0.053) | ||||
| b2899 | yqfA | −8.77 (0.006) | −14.66 (0.020) | −32.77 (0.000) | |||
| b2996 | hybA | 2.84 (0.001) | 2.25 (0.015) | −1.26 (0.073) | |||
| b3892 | fdoI | 1.55 (0.042) | 2.91 (0.000) | 2.33 (0.070) | |||
| b3894 | fdoG | −1.21 (0.022) | 2.48 (0.017) | 12.49 (0.000) | 2.32 (0.072) | ||
| b4039 | ubiC | 1.95 (0.007) | 2.60 (0.005) | 2.80 (0.018) | |||
| b4040 | ubiA | 1.75 (0.001) | 2.07 (0.014) | 4.51 (0.001) | |||
| b4154 | frdA | 2.22 (0.001) | 1.83 (0.094) | 1.36 (0.024) | |||
| Unsaturated fatty acid biosynthesis | |||||||
| b0954 | fabA | −2.54 (0.004) | −4.80 (0.000) | −2.94 (0.019) | −3.58 (0.004) | ||
| b2323 | fabB | −1.87 (0.000) | −12.95 (0.001) | −10.28 (0.001) | −27.33 (0.000) | −2.35 (0.099) | |
| Other genes | |||||||
| b0464 | acrR | 1.96 (0.000) | 1.66 (0.018) | 2.60 (0.017) | |||
| b0929 | ompF | −7.72 (0.000) | −10.43 (0.002) | −6.93 (0.037) | |||
| b2684 | mprA | 1.37 (0.023) | 2.10 (0.000) | 6.11 (0.000) | 2.12 (0.082) | 3.44 (0.000) | 10.39 (0.001) |
Data shown are from sampling times specified in the text. Only those fold changes with P values greater than 0.05 (EZ glucose) or 0.10 (EZ glycerol) are shown.
Data are means, with P values for comparisons of BTE-expressing strains versus BTE-H204A-expressing strains shown in parentheses.
Table 5.
Protein changes for BTE-expressing strains versus BTE-H204A-expressing strains cultured in EZ rich defined medium supplemented with 0.2% glucose in shake flasks (EZ glucose) or in EZ rich defined medium supplemented with 0.4% glycerol (EZ glycerol)a
| Locus | Protein | Fold change between BTE-expressing strains vs BTE-H204A-expressing strains |
|||||
|---|---|---|---|---|---|---|---|
| EZ glucose, BTE+ ACC− |
EZ glycerol |
||||||
| BTE+ ACC− |
BTE+ ACC+ |
||||||
| Early stationary | Mid-stationary | Late log | Mid-stationary | Late log | Mid-stationary | ||
| PutA | 2.10 | 2.20 | −4.32 | ||||
| b1304 | PspA | 5.52 | 2.28 | ||||
| b1493 | GadB | 4.63 | |||||
| b1611 | FumC | 3.53 | |||||
| b1743 | Spy | 5.24 | |||||
| b2323 | FabB | −4.20 | −3.46 | −2.36 | −5.85 | −2.46 | −7.00 |
| b3506 | Slp | 2.10 | −2.11 | ||||
Cultures were grown in fermentors and sampled at the times specified in the text. P values for all fold changes shown were less than 0.05. No significant changes in expression levels were measured at the mid-log phase sampling point for EZ glucose cultures.
Induction of the MarA/Rob/SoxS regulon.
Under all tested conditions, BTE-expressing strains exhibited increased expression of many genes activated by the MarA/Rob/SoxS transcription factors (Table 4). MarA, Rob, and SoxS bind to a similar consensus sequence of DNA upstream of the promoters of regulon members in a degenerate manner, with one, two, or all three of the regulators activating transcription from a given promoter (57). The activities of the transcription factors are modulated by various mechanisms dependent on environmental conditions. In the presence of salicylate and other aromatic compounds, MarA activation occurs via inactivation of the DNA-binding repressor MarR (2). Similarly, SoxS activation occurs via inactivation of the cognate repressor SoxR in the presence of superoxide (20). Rob has no known cognate repressor, and its activity is directly modulated by the presence of decanoate, bile salts, and dipyridyl (71, 72). As early as during mid-log-phase growth in BTE-expressing shake flask cultures and at the late-log-phase sampling point in fermentors, upregulation of marR was observed. Early-stationary-phase induction and a further-increased mid-stationary-phase induction of many members of the regulon were observed in both shake flasks and fermentors, including fumC (encoding an aerobically active fumarase), marA, pqiA (encoding a paraquat-inducible protein with no known function), inaA (encoding a protein with unknown function), marR, ybjC (encoding a protein with unknown function), putA (encoding a FAD+-dependent proline dehydrogenase), nfsA (encoding an NADPH-dependent nitroreductase), and nfo (encoding a DNA endonuclease involved in repairing oxidative damage). Expression of mdtG, a recently ascribed member of the MarA/Rob/SoxS regulon which putatively encodes an efflux pump and for which overexpression increases resistance to fosfomycin and deoxycholate (25), was also increased. MarA, Rob, and SoxS additionally activate transcription of MicF RNA, which acts as an antisense repressor of transcription of ompF (encoding an outer membrane porin) (5). Strongly decreased expression of ompF was observed in stationary phase in both shake flasks and fermentors (Table 4). PutA was identified as having increased mid-stationary-phase expression in BTE-expressing shake flask cultures, in exponential-phase fermentor cultures expressing only BTE, and in mid-stationary-phase fermentor cultures expressing BTE and overexpressing ACC (Table 5). FumC was also observed to have increased expression in shake flask proteomics data in BTE-expressing cultures during mid-stationary phase (Table 5).
Notably, no significant increase in expression of acrAB was observed in BTE-expressing cultures (Table 4), which encodes an inner membrane multidrug efflux pump (AcrB) and a periplasmic linker protein (AcrA) to an outer membrane channel (TolC). It has been previously shown that acrAB transcription can be induced by high concentrations (5 mM) of exogenously supplied decanoate via activation of Rob (54, 71). Decanoate is similar to the predominant overproduced fatty acid laurate; however, the maximum titer of endogenously produced free fatty acids (chain length, C12 to C14) in this study was approximately 1.5 mM, which may be too low to observe significant induction of acrAB. Transcription of the acrAB operon is also modulated by two divergently transcribed repressors, AcrR and MprA, which appear to serve as secondary attenuators of acrAB expression (31, 53). Expression of acrR was moderately increased in BTE-expressing cultures in early stationary phase in shake flasks and in mid-stationary phase in fermentors (Table 4). Expression of mprA was moderately increased in early stationary phase and strongly increased in mid-stationary phase in both shake flasks and fermentors (Table 4). It has been previously noted that transcription of acrR is increased approximately 4-fold more than transcription of acrAB under general stress conditions, including exposure to 4% ethanol, 0.5 M NaCl, and during stationary phase (52), which is consistent with the pattern of expression observed in this study.
Induction of other envelope stress responses and the acid resistance response in batch cultures.
Other regulons implicated in cell envelope stress include those of the alternative sigma factor σE and the two-component systems CpxAR and BaeSR (74). Several genes in the σE regulon, including opgG, opgH, plsB, and lpxP, were strongly upregulated in early to mid-stationary phase in BTE-expressing shake flask cultures but not in fermentors. Significantly increased expression of members of the CpxR regulon was also observed in mid-stationary phase in shake flask cultures but not fermentors, including cpxP, degP, mdtD, and spy (mdtD and spy are also in the BaeR regulon). Spy was also identified as being significantly differentially expressed in the shake flask proteomics data (Table 5), but the other proteins were either nonsignificantly changed or not detected. Other members of the σE and CpxR regulon were significantly downregulated in mid-stationary phase in BTE-expressing shake flask cultures, including ompF, csgDEFG, and hlpA-lpxD-fabZ-lpxA, an operon transcribed from a promoter upstream of hlpA.
A number of genes on a region of the genome referred to as the acid fitness island (37), primarily involving glutamate-dependent acid resistance, were significantly increased in expression in stationary-phase shake flask cultures. These genes included slp and hdeAB-yhiD, which are repressed by MarA during the transition to stationary phase (68, 76) but are also affected by numerous other regulators. Increased expression of these genes was also accompanied by dramatic increases in expression of gadA, gadB, gadC, gadE, and mdtEF, with more moderate increases in expression (<5-fold) of gadX and gadW (see the supplemental material), strongly suggesting a relative lack of MarA involvement. Slp and GadB were also identified as having increased expression in shake flask proteomic data (Table 5). There was no activation of genes on the acid fitness island in fermentor cultures, but rather a reduction in expression of hdeAB in the BTE-expressing strain in mid-stationary phase.
Changes in energy metabolism.
Genes involved in energy metabolism were upregulated in BTE-expressing strains in both shake flask and fermentor cultures (Table 4). These included many members of the nuo operon (nuoH, nuoI, nuoJ, and nuoN), encoding subunits of NADH:ubiquinone oxidoreductase I, and the cyo operon (cyoC, cyoD, and cyoE), encoding subunits of the cytochrome bo terminal oxidase complex and heme O synthase. Other members of the operon were upregulated in the mid-stationary-phase shake flask data set, with either P values or fold changes not meeting the selected significance criteria or not also being identified with the significance criteria in the fermentor data set, including nuoG, nuoL, nuoK, cyoA, and cyoB. Similarly for fermentor data, additional genes identified in late log phase included nuoM, nuoK, nuoG, nuoL, cyoA, and cyoB. These gene products form core components of the electron transport chain, with complex regulation of transcription by a number of different transcription factors involved in sensing oxygen levels (ArcA, FNR, and Fur) and nitrate levels (NarL) among others. Furthermore, expression of the nuo operon was also dependent on the proportion of NADH present relative to total reducing equivalents, as it is activated by growth on C4 dicarboxylates, which have a reduced proportion of NADH (13). Upregulation of the nuo and cyo operons has also been observed upon n-butanol exposure, which was suggested to either be indicative of an increased energy requirement or impairment of respiration (77). While dissipation of the proton motive force is likely, given the induction of phage shock proteins and increased permeability to SYTOX green, it is not clear how this event causes elevated transcription of the nuo and cyo operons.
Additional genes involved in cellular respiration were also identified as differentially regulated in BTE-expressing strains in both data sets (Table 4), including increased stationary-phase expression of fdoG- and fdoI-encoding subunits of the aerobic formate dehydrogenase O (fdoH was also increased but with low statistical confidence in fermentors), ubiC and ubiA, which are involved in ubiquinone biosynthesis, hybA, encoding a subunit of hydrogenase 2 (other subunits also exhibited increased differential expression but with lower statistical confidence), frdA, encoding a subunit of fumarate reductase, and yfeH, encoding an AI-2-induced putative cytochrome oxidase. Highly increased expression of hyaABCDEF, encoding hydrogenase 1 and associated proteins, was observed only in shake flask cultures. Decreased expression of appCBA, encoding cytochrome bd II terminal oxidase and an acid phosphatase, was observed transiently in shake flasks in early stationary phase and in mid-stationary phase in fermentors. Strongly reduced expression of yqfA, encoding a subunit of a predicted oxidoreductase, and reduced expression of yodB, encoding a predicted cytochrome, were also transient in shake flasks in early stationary phase and during late log phase to early stationary phase in fermentors.
Decreased expression of the unsaturated fatty acid biosynthesis pathway.
In both functional genomics experiments, the percentage of unsaturated long-chain (16- to 18-carbon) fatty acids was significantly increased due to a decrease in C16:0 levels in FFA-overproducing strains. Fatty acid unsaturation in E. coli is introduced by 3-hydroxydecanoyl-ACP dehydrase (FabA) by dehydration of the hydroxylated C10 acyl-ACP and isomerization to both cis- and trans-3-enoyl-ACP (18). The cis species are not reduced by FabI and are elongated as unsaturated acyl-ACPs. Additionally, an alternative β-ketoacyl-ACP synthase, FabB, is required for elongation of cis-3-decenoyl-ACP (28). Transcription of fabA and fabB is activated by FadR and repressed by FabR, which bind within the promoter region. FadR activation is abolished upon its binding to acyl-CoAs (21), whereas FabR repression is abolished upon its binding to either unsaturated acyl-CoAs or unsaturated acyl-ACPs (89). As such, FabR is considered a controller of the level of membrane lipid unsaturation. In BTE-expressing strains in both the shake flask and fermentor data sets, fabB was strongly downregulated in early stationary phase, with decreased expression evident as early as the mid-log phase and late log phase in shake flask and fermentor cultures, respectively (Table 4). FabB was also identified as being significantly decreased in abundance in BTE-expressing cultures under all conditions (Table 5). Additionally, fabA was reduced in expression but to a lesser extent than fabB. Deletion studies of fadR and fabR and in vitro studies have identified FadR as having a greater influence on fabA expression, and FabR has been identified as having a greater influence on fabB expression (29). Therefore, it is suggestive that FabR plays a role in controlling fabB and fabA transcription in BTE-expressing strains by sensing a high ratio of unsaturated to saturated acyl-ACPs, and also that this high ratio results from depletion of saturated acyl-ACPs by BTE. Despite this high level of transcriptional regulation, cultures appear to be unable to produce sufficient palmitoyl-ACP to maintain a typical degree of long-chain fatty acid saturation.
Functional genomics guided strain engineering.
Stress responses that were induced as a result of fatty acid overproduction (phage shock proteins and the MarA/Rob/SoxS regulon) were selected as targets for additional strain engineering. RL08 harboring pBAD33-BTE was selected as the base strain because it produces higher titers of fatty acids than strains harboring other BTE-containing plasmids when grown in LB medium supplemented with 0.4% glycerol (38, 48). The phage shock proteins (encoded by pspABCDE and pspG), of which some members may function to repair or stabilize damaged cell membranes (39), were deactivated by deletion of the necessary transcriptional activator, PspF (41) (strain RL13), in order to gauge its importance in maintaining viability in BTE-expressing cells (Table 6). After 8 h of growth, there was no significant change in CFU ml−1 when pspF was deleted in BTE-H204A-expressing cells; however, there was a 4-fold decrease in viability in BTE-expressing cells. This observation suggested that the phage shock system played a role in reducing the loss of viability resulting from FFA overproduction. Despite the loss in viability after 8 h, there was no significant difference in total fatty acid titers after 24 h between RL08/pBAD33-BTE and RL13/pBAD33-BTE (Fig. 5a). Next, the phage shock system was overexpressed by cloning the pspABCDE operon into pBAD18 (pBAD18-Psp). Overexpression of pspABCDE has previously been shown to improve tolerance of E. coli to hexane exposure, but to a lesser degree than culturing the cells in the presence of 10 mM MgSO4 (45). A 2-fold decrease in CFU ml−1 at 8 h was found in RL08/pBAD18-Psp expressing BTE-H204A, and an over 7-fold decrease in CFU ml−1 was found when expressing BTE (see Table S6 in the supplemental material). Total fatty acid titers were similarly negatively affected in the strain overexpressing pspABCDE and BTE over the strain expressing BTE alone (see Fig. S5). Interestingly, the decrease in titer was almost entirely in medium-chain-length (C8 to C14) rather than long-chain-length (C16 to C18) fatty acids.
Table 6.
Viable cell counts 8 h postinoculation from induced cultures of RL08 harboring plasmid pBAD33-BTE-H204A or pBAD33-BTE with additional specified gene deletionsa
| Strain | Viable cell counts (CFU/ml [mean ± SD]) |
|
|---|---|---|
| BTE-H204A | BTE | |
| RL08 | (2.02 ± 0.18) × 109 | (7.3 ± 0.2) × 108 |
| RL08 ΔpspF | (2.49 ± 0.49) × 109 | (1.8 ± 0.1) × 108 |
| RL08 | (3.2 ± 0.9) × 109 | (5.9 ± 1.8) × 108 |
| RL08 marA::kan | (3.0 ± 0.6) × 109 | (4.6 ± 0.8) × 108 |
| RL08 rob::kan | (2.7 ± 0.1) × 109 | (3.3 ± 0.2) × 108 |
| RL08 soxS::kan | (5.3 ± 0.2) × 109 | (4.4 ± 2.6) × 108 |
Cells were grown in LB medium supplemented with 0.4% glycerol.
Fig. 5.

Titers of 16- to 18-carbon-chain-length fatty acids (white), which are primarily associated with membrane lipids, and 8- to 14-carbon-chain-length fatty acids (gray), which are primarily either FFAs or minorly associated with lipid A of (a) strain RL13 (ΔpspF) expressing BTE-H204A (BTE-) or BTE (BTE+), and (b) strains RL09 (marA::kan), RL10 (rob::kan), and RL11 (soxS::kan) expressing BTE-H204A or BTE. Strain RL08 was used as a negative control against gene deletion strains. All fatty acid samples were taken after 24 h of shake flask growth in LB medium supplemented with 0.4% glycerol as described in Materials and Methods.
To gauge the physiological importance of the MarA, Rob, and SoxS regulons on maintenance of viability during FFA overproduction, deletions of marA, rob, and soxS were constructed by P1 phage transduction of kan cassettes from the corresponding Keio Collection mutants (9) into strain RL08. No decreases in CFU ml−1 after 8 h of growth were observed from deletions in RL08 expressing BTE-H204A; however, deletion of soxS resulted in a small but statistically significant increase in CFU ml−1 (Table 6). In BTE-expressing cultures, a small but statistically significant loss of viability was observed in the rob deletion strain. While only Rob is known to be activated by FFAs (51), there were no trends in the microarray data to suggest that it had a more important role than MarA or SoxS, and genes annotated as being exclusively activated by Rob (ybiS, mltF, and aslB) (30) did not have highly increased expression. In addition to having reduced CFU ml−1 after 8 h, the rob deletion strain expressing BTE also produced a lower C8-to-C14 fatty acid titer relative to RL08 (Fig. 5b). Overexpression of marA, rob, and soxS on pBAD18 did not result in any statistically significant changes to CFU ml−1 (see Table S6 in the supplemental material) or fatty acid titers (see Fig. S5 in the supplemental material). While overexpression of either marA, rob, or soxS has previously been observed to increase tolerance toward hexane (35), cyclohexane (35, 87), triclosan (58), antibiotics (7, 85), and cationic antimicrobial peptides (85), it did not increase tolerance to endogenously overproduced FFAs.
DISCUSSION
Overproduction of medium-chain-length (C8 to C14) FFAs in E. coli by heterologous expression of the Umbellularia californica acyl-ACP thioesterase (BTE) results in severe phenotypic consequences beginning as early as the transition out of log phase growth, with concomitant large reductions in CFU ml−1 and compromised inner membrane integrity as indicated by staining with SYTOX green. Additionally, heterogeneous cell size is observed by flow cytometry analysis in BTE-expressing cells, indicating possible defects in cell division on entry into stationary phase. The observed degree of toxicity and morphological changes are unique to endogenous production and cannot be replicated by exogenous addition of lauric acid. Previous studies investigating the exogenous addition of 0.4% decanoic, methyldecanoic acid, or undecanoic acid have similarly observed little growth inhibition (26, 27); however, much lower concentrations (0.01%) of methyldecanoic acid induced lysis of E. coli spheroplasts (27). The outer membrane of E. coli is decorated with hydrophilic lipopolysaccharides, providing a protective barrier against diffusive entry of hydrophobic compounds and completely excluding free fatty acids with 14 or more carbon chain lengths without the presence of the outer membrane fatty acid transporter FadL (11). In contrast, endogenous production exposes the unprotected inner membrane to FFAs. While FFAs are able to passively diffuse across the inner membrane (56), the rate of flipping across the bilayer or exiting the membrane into the periplasm may be slower than the rate of intracellular production, which would lead to accumulation in either the cell membranes or the periplasm.
In this study, we found that overproduction of medium-chain-length FFAs in E. coli resulted in significantly perturbed gene expression profiles that correlated temporally with elevated rates of fatty acid production. Cross-comparison of differentially expressed genes under two sets of growth conditions and with BTE and BTE-H204A expressed on plasmids under the control of different inducible promoters allowed the identification of a core set of stress responses that may be generally induced as a result of endogenous FFA overproduction. Two stress response regulons were identified as having all or many members upregulated in both sets of microarray data, with additional proteins identified as differentially expressed in the more-limited set of statistically significant proteomic data. All members of the phage shock system were strongly induced in BTE-expressing cultures (Table 4), with PspA identified as having an increased abundance at the protein level (Table 5). Activation of the phage shock system appears to occur in response to dissipation of the proton motive force; however, the exact mechanism of signal transduction remains elusive (39). It appears that at least one of the phage shock proteins, PspA, plays a role in restoring membrane polarization (46). Many of the key genes of aerobic respiration were upregulated, including the nuo and cyo operons, possibly as a result of the degradation of membrane properties or proton motive force. The products of these genes are necessary to generate a proton gradient across the inner membrane for aerobic energy generation. Exogenously added fatty acids act as proton motive force-uncoupling agents in mitochondria by various mechanisms, including diffusive flipping of proton-bound free acids into the cytosol and direct interaction of membrane-bound fatty acid anions with protons in membrane proteins, such as ATP synthase (88). Export of endogenously overproduced FFAs should result in a net efflux of protons by diffusive mechanisms, but they may still behave as uncoupling agents by causing futile cycling of protons that were originally bound for the cytosol. Alternatively, FFAs may accumulate in the periplasmic space and cause uncoupling by diffusing back into the cytosol at later times during culture growth, essentially mimicking exogenously added FFAs. The observation that the phage shock system was only induced in stationary phase supports this hypothesis.
Numerous members of the MarA/Rob/SoxS regulon, which are implicated in multiple antibiotic resistance, resistance to solvents and other small toxic molecules, and oxidative stress, were also strongly induced (Table 4) as early as during mid-log phase, although no clear trend could be ascertained as to whether one or more of these transcription factors was responding to a particular environmental stimulus. Rob activity is known to be increased by medium-chain FFAs, such as decanoate, and it has been suggested that E. coli possesses natural defense mechanisms for dealing with high concentrations of fatty acids and bile salts in the enteric environment (71). While members of other cell envelope stress responses, including the σE, CpxR, and BaeR regulons, were identified in shake flask cultures, induction of these regulons was notably absent in fermentor cultures. Thus, it seems likely that other environmental factors in combination with FFA production were the cause of this response. For example, increased intercalation of FFAs in cell membranes of BTE-expressing cells could render the cells more sensitive to ampicillin (present in the shake flask cultures), but not to chloramphenicol or kanamycin (present in the fermentors), and this secondary impact could be responsible for the induced stress responses. In light of the mode of action of ampicillin as a peptidoglycan transpeptidase inhibitor, it is also tempting to speculate that the wide range of cell lengths present in BTE-expressing cells during stationary phase is a result of inhibited cell division due to effectively increased ampicillin exposure. Another possibility is that the less-controlled conditions present in shake flask cultures with respect to temperature and pH could have imposed additional stresses on the cells, leading to further cell envelope stress cascades. Increased acid stress or other indirect transcriptional cascades could be responsible for the very large induction of genes present on the acid fitness island in shake flask cultures.
The induction of stress responses could be a direct result of a change in membrane properties due to FFA intercalation in the inner membrane or because of other indirect effects on the composition of membrane lipids. Notably, large decreases in expression of fabB and fabA were observed in BTE-expressing strains, with the onset of decreased expression of fabB occurring as early as mid-log phase. FabB was identified as having reduced expression in both proteomics data sets. This early onset of differential regulation points to a rapid and severe perturbation of unsaturated membrane lipid homeostasis that precedes most stress responses, as both fabB and fabA are required for long chain unsaturated fatty acid biosynthesis. They are negatively regulated by FabR, which effectively senses the ratio of unsaturated to saturated acyl-ACPs and tunes the transcription of genes required for unsaturated fatty acid biosynthesis accordingly (89). Despite the high degree of transcriptional repression, the fatty acid profile revealed a sharply increased degree of C16-to-C18 fatty acid unsaturation due primarily to a decrease in C16:0 content in BTE-expressing strains (Fig. 3). These antagonizing observations seem to point to an inability of the cells to compensate for an extreme enrichment of unsaturated acyl-ACPs as a result of the saturated acyl-ACP substrate preference of BTE, rather than an attempt by the cells to purposefully alter their phospholipid unsaturated fatty acid content. An inability to effectively control the degree of membrane lipid unsaturation could lead to severe consequences on maintenance of membrane integrity and could also exacerbate or be the primary factor responsible for proton motive force dissipation. Indeed, Bacillus subtilis and Bacillus megaterium mutants defective in phospholipid desaturase activity exhibit an increased degree of membrane saturation while attaining increased resistance to proton motive force uncouplers, such as carbonyl cyanide 3-chlorophenylhydrazone (CCCP) (23). Regardless of the mechanism, any detrimental impact of unsaturated membrane lipid content to cell viability presents metabolic engineering opportunities in the form of correcting the degree of membrane lipid unsaturation.
Alternatively, if the primary membrane stress arises from FFA intercalation in the inner or outer membranes or accumulation in the periplasm, then a possible metabolic engineering strategy is to overexpress either a native or heterologous fatty acid exporter. While speculated to exist in plant chloroplast membranes (47), no specific fatty acid export protein has been convincingly identified to date. However, less-specific exporter proteins may exist in the form of drug efflux pumps, which can confer resistance to a wide range of toxic small molecules (67, 69). The AcrAB-TolC efflux pump, a member of the MarA and Rob regulons, is not only activated in response to fatty acids via Rob (54, 71) but also by overexpression, which has been shown to confer greatly increased resistance to chemicals such as sodium dodecyl sulfate and deoxycholate (63). A number of other drug efflux pumps that are not in the MarA/Rob/SoxS regulon confer similar resistances (25, 63).
Gene deletions of pspF and rob negatively affected cell viability (and in the case of rob, reduce C8-to-C14 fatty acid titers) in BTE-expressing cells, underscoring the physiological importance of the phage shock response and Rob regulon under conditions of endogenous FFA overproduction. Despite their importance, higher cell viabilities or fatty acid titers were not observed when overexpressing the genes encoding the phage shock proteins, or marA, rob, or soxS, on multicopy plasmids. Further optimization of expression may be necessary. In the case of overexpression of marA, rob, and soxS, additional deletions of attenuating transcriptional repressors, such as marR, acrR, and mprA, may be necessary to achieve higher fatty acid yields. Strategies for specifically repairing membrane damage may need to be carried out in tandem with modifications that reduce the degree of membrane lipid unsaturation. Alterations in growth conditions could also be explored, such as the addition of 10 mM Mg2+ or Ca2+, which has previously been shown to reduce the lethality of hexane toward E. coli (6).
In summary, several lines of evidence for the toxicity of intracellularly produced medium-chain-length FFAs have been obtained. In fatty acid-overproducing strains, this includes compromised inner membrane integrity, altered cellular morphology, reduced viability, and a large increase in the percent composition of unsaturated 16- to 18-carbon-chain-length fatty acids. A functional basis for many of these observations was determined by an analysis of differential gene and protein expression between a fatty acid-overproducing and a nonoverproducing strain. Genes encoding the phage shock proteins, and many members of the MarA/Rob/SoxS regulon, exhibited increased expression in the FFA-overproducing strain, indicating transcriptional cascades in response to unfavorable conditions, such as proton motive force dissipation and the presence of toxic small molecules and oxidative stress. The increase in unsaturated long-chain fatty acid content could be functionally linked to changes in gene (fabB and fabA) and protein (FabB) expression. The importance of the phage shock proteins and the Rob regulon to maintaining cell viability under conditions of FFA overproduction were validated by testing gene deletion strains. This study's findings open up the possibility for directed rational strain engineering to achieve improved yields of free fatty acids.
Supplementary Material
ACKNOWLEDGMENTS
This work was funded by the DOE Great Lakes Bioenergy Research Center (DOE BER Office of Sciences DE-FC02-07ER64494) and startup funds from the University of Wisconsin—Madison Graduate School. R.M.L. was supported as a trainee in the Chemistry-Biology Interface Training Program (NIH) and by the Department of Chemical and Biological Engineering Dahlke-Hougen Fellowship. K.K. was supported by the Khorana Program for Scholars.
Footnotes
Supplemental material for this article may be found at http://aem.asm.org/.
Published ahead of print on 23 September 2011.
REFERENCES
- 1. Åkerlund T., Nordström K., Bernander R. 1995. Analysis of cell size and DNA content in exponentially growing and stationary-phase batch cultures of Escherichia coli. J. Bacteriol. 177:6791–6797 [DOI] [PMC free article] [PubMed] [Google Scholar]
- 2. Alekshun M. N., Levy S. B. 1999. Alteration of the repressor activity of MarR, the negative regulator of the Escherichia coli marRAB locus, by multiple chemicals in vitro. J. Bacteriol. 181:4669–4672 [DOI] [PMC free article] [PubMed] [Google Scholar]
- 3. Alper H., Stephanopoulos G. 2009. Engineering for biofuels: exploiting innate microbial capacity or importing biosynthetic potential? Nat. Rev. Microbiol. 7:715–723 [DOI] [PubMed] [Google Scholar]
- 4. Amann E., Ochs B., Abel K.-J. 1988. Tightly regulated tac promoter vectors useful for the expression of unfused and fused proteins in Escherichia coli. Gene 69:301–315 [DOI] [PubMed] [Google Scholar]
- 5. Andersen J., Forst S. A., Zhao K., Inouye M., Delihas N. 1989. The function of micF RNA. micF RNA is a major factor in the thermal regulation of OmpF protein in Escherichia coli. J. Biol. Chem. 264:17961–17970 [PubMed] [Google Scholar]
- 6. Aono R., Kobayashi H., Joblin K. N., Horikoshi K. 1994. Effects of organic solvents on growth of Escherichia coli K-12. Biosci. Biotechnol. Biochem. 58:2009–2014 [DOI] [PubMed] [Google Scholar]
- 7. Asako H., Nakajima H., Kobayashi K., Kobayashi M., Aono R. 1997. Organic solvent tolerance and antibiotic resistance increased by overexpression of marA in Escherichia coli. Appl. Environ. Microbiol. 63:1428–1433 [DOI] [PMC free article] [PubMed] [Google Scholar]
- 8. Atsumi S., Hanai T., Liao J. C. 2008. Non-fermentative pathways for synthesis of branched-chain higher alcohols as biofuels. Nature 451:86–89 [DOI] [PubMed] [Google Scholar]
- 9. Baba T., et al. 2006. Construction of Escherichia coli K-12 in-frame, single-gene knockout mutants: the Keio Collection. Mol. Syst. Biol. 2:2006.0008 [DOI] [PMC free article] [PubMed] [Google Scholar]
- 10. Beller H. R., Goh E.-B., Keasling J. D. 2010. Genes involved in long-chain alkene biosynthesis in Micrococcus luteus. Appl. Environ. Microbiol. 76:1212–1223 [DOI] [PMC free article] [PubMed] [Google Scholar]
- 11. Black P. N. 1990. Characterization of FadL-specific fatty acid binding in Escherichia coli. Biochim. Biophys. Acta 1046:97–105 [DOI] [PubMed] [Google Scholar]
- 12. Bolstad B. M., Irizarry R. A., Åstrand M., Speed T. P. 2003. A comparison of normalization methods for high density oligonucleotide array data based on variance and bias. Bioinformatics 19:185–193 [DOI] [PubMed] [Google Scholar]
- 13. Bongaerts J., Zoske S., Weidner U., Unden G. 1995. Transcriptional regulation of the proton translocating NADH dehydrogenase genes (nuoA-N) of Escherichia coli by electron acceptors, electron donors, and gene regulators. Mol. Microbiol. 16:521–534 [DOI] [PubMed] [Google Scholar]
- 14. Brissette J. L., Russel M., Weiner L., Model P. 1990. Phage shock protein, a stress protein of Escherichia coli. Proc. Natl. Acad. Sci. U. S. A. 87:862–866 [DOI] [PMC free article] [PubMed] [Google Scholar]
- 15. Brynildsen M. P., Liao J. C. 2009. An integrated network approach identifies the isobutanol response network of Escherichia coli. Mol. Syst. Biol. 5:277. [DOI] [PMC free article] [PubMed] [Google Scholar]
- 16. Cherepanov P. P., Wackernagel W. 1995. Gene disruption in Escherichia coli: Tcr and Kmr cassettes with the option of Flp-catalyzed excision of the antibiotic-resistance determinant. Gene 158:9–14 [DOI] [PubMed] [Google Scholar]
- 17. Chung C. T., Niemela S. L., Miller R. H. 1989. One-step preparation of competent Escherichia coli: transformation and storage of bacterial cells in the same solution. Proc. Natl. Acad. Sci. U. S. A. 86:2172–2175 [DOI] [PMC free article] [PubMed] [Google Scholar]
- 18. Cronan J. E., Jr., Rock C. O. October 2008, posting date Biosynthesis of membrane lipids. In Curtiss R., III, et al. (ed.), EcoSal: Escherichia coli and Salmonella: cellular and molecular biology. ASM Press, Washington, DC: http://www.ecosal.org [Google Scholar]
- 19. Davis M. S., Solbiati J., Cronan J. E., Jr 2000. Overproduction of acetyl-CoA carboxylase activity increases the rate of fatty acid biosynthesis in Escherichia coli. J. Biol. Chem. 275:28593–29598 [DOI] [PubMed] [Google Scholar]
- 20. Demple B. 1996. Redox signaling and gene control in the Escherichia coli soxRS oxidative stress regulon: a review. Gene 179:53–57 [DOI] [PubMed] [Google Scholar]
- 21. DiRusso C. C., Heimert T. L., Metzger A. K. 1992. Characterization of FadR, a global transcriptional regulator of fatty acid metabolism in Escherichia coli. J. Biol. Chem. 267:8685–8691 [PubMed] [Google Scholar]
- 22. Doan T. T. P., et al. 2009. Functional expression of five Arabidopsis fatty acyl-CoA reductase genes in Escherichia coli. J. Plant Physiol. 166:787–796 [DOI] [PubMed] [Google Scholar]
- 23. Dunkley E. A., Jr., Clejan S., Krulwich T. A. 1991. Mutants of Bacillus species isolated on the basis of protonophore resistance are deficient in fatty acid desaturase activity. J. Bacteriol. 173:7750–7755 [DOI] [PMC free article] [PubMed] [Google Scholar]
- 24. Engl C., et al. 2009. In vivo localizations of membrane stress controllers PspA and PspG in Escherichia coli. Mol. Microbiol. 73:382–396 [DOI] [PMC free article] [PubMed] [Google Scholar]
- 25. Fàbrega A., Martin R. G., Rosner J. L., Mar Tavio M., Vila J. 2010. Constitutive SoxS expression in a fluoroquinolone-resistant strain with a truncated SoxR protein and identification of a new member of the marA-soxS-rob regulon, mdtG. Antimicrob. Agents Chemother. 54:1218–1225 [DOI] [PMC free article] [PubMed] [Google Scholar]
- 26. Fay J. P., Farias R. N. 1975. The inhibitory action of fatty acids on the growth of Escherichia coli. J. Gen. Microbiol. 91:233–240 [DOI] [PubMed] [Google Scholar]
- 27. Fay J. P., Farias R. N. 1977. Inhibitory action of a non-metabolizable fatty acid on the growth of Escherichia coli: role of metabolism and outer membrane integrity. J. Bacteriol. 132:790–795 [DOI] [PMC free article] [PubMed] [Google Scholar]
- 28. Feng Y., Cronan J. E. 2009. Escherichia coli unsaturated fatty acid synthesis: complex transcription of the fabA gene and in vivo identification of the essential reaction catalyzed by FabB. J. Biol. Chem. 284:29526–29535 [DOI] [PMC free article] [PubMed] [Google Scholar]
- 29. Feng Y., Cronan J. E. 2011. Complex binding of the FabR repressor of bacterial unsaturated fatty acid biosynthesis to its cognate promoters. Mol. Microbiol. 80:195–218 [DOI] [PMC free article] [PubMed] [Google Scholar]
- 30. Gama-Castro S., et al. 2011. RegulonDB version 7.0: transcriptional regulation of Escherichia coli K-12 integrated within genetic sensory response units (Gensor Units). Nucleic Acids Res. 39:D98–D105 [DOI] [PMC free article] [PubMed] [Google Scholar]
- 31. Grkovic S., Brown M. H., Skurray R. A. 2002. Regulation of bacterial drug export systems. Microbiol. Mol. Biol. Rev. 66:671–701 [DOI] [PMC free article] [PubMed] [Google Scholar]
- 32. Guzman L.-M., Belin D., Carson M. J., Beckwith J. 1995. Tight regulation, modulation, and high-level expression by vectors containing the arabinose PBAD promoter. J. Bacteriol. 177:4121–4130 [DOI] [PMC free article] [PubMed] [Google Scholar]
- 33. Han M.-J., Lee J. W., Lee S. Y., Yoo J. S. 2008. Proteome-level responses of Escherichia coli to long-chain fatty acids and use of fatty acid inducible promoter in protein production. J. Biomed. Biotechnol. 2008:735101. [DOI] [PMC free article] [PubMed] [Google Scholar]
- 34. Handke P., Lynch S. A., Gill R. T. 2011. Application and engineering of fatty acid biosynthesis in Escherichia coli for advanced fuels and chemicals. Metab. Eng. 13:28–37 [DOI] [PubMed] [Google Scholar]
- 35. Hayashi S., et al. 2003. Analysis of organic solvent tolerance in Escherichia coli using gene expression profiles from DNA microarrays. J. Biosci. Bioeng. 95:379–383 [DOI] [PubMed] [Google Scholar]
- 36. Heath R. J., Rock C. O. 1996. Regulation of fatty acid elongation and initiation by acyl-acyl carrier protein in Escherichia coli. J. Biol. Chem. 271:1833–1836 [DOI] [PubMed] [Google Scholar]
- 37. Hommais F., et al. 2004. GadE (YhiE): a novel activator involved in the response to acid environment in Escherichia coli. Microbiology 150:61–72 [DOI] [PubMed] [Google Scholar]
- 38. Hoover S. W., et al. 2011. Bacterial production of free fatty acids from freshwater macroalgal cellulose. Appl. Microbiol. Biotechnol. 91:436–446 [DOI] [PMC free article] [PubMed] [Google Scholar]
- 39. Joly N., et al. 2010. Managing membrane stress: the phage shock protein (Psp) response, from molecular mechanisms to physiology. FEMS Microbiol. Rev. 34:797–827 [DOI] [PubMed] [Google Scholar]
- 40. Reference deleted.
- 41. Jovanovic G. L., Weiner L., Model P. 1996. Identification, nucleotide sequence and characterization of PspF, the transcriptional activator of the Escherichia coli stress-induced psp operon. J. Bacteriol. 178:1936–1945 [DOI] [PMC free article] [PubMed] [Google Scholar]
- 42. Kalscheuer R., Stölting T., Steinbüchel A. 2006. Microdiesel: Escherichia coli engineered for fuel production. Microbiology 152:2529–2536 [DOI] [PubMed] [Google Scholar]
- 43. Klein K. R., Steinberg R., Fiethen B., Overath P. 1971. Fatty acid degradation in Escherichia coli. An inducible system for the uptake of fatty acids and further characterization of old mutants. Eur. J. Biochem. 19:442–450 [DOI] [PubMed] [Google Scholar]
- 44. Knothe G. 2010. Biodiesel and renewable diesel: a comparison. Prog. Energy Combustion Sci. 36:364–373 [Google Scholar]
- 45. Kobayashi H., Yamamoto M., Aono R. 1998. Appearance of a stress-response protein, phage-shock protein A, in Escherichia coli exposed to hydrophobic organic solvents. Microbiology 144:353–359 [DOI] [PubMed] [Google Scholar]
- 46. Kobayashi R., Suzuki T., Yoshida M. 2007. Escherichia coli phage-shock protein A (PspA) binds to membrane phospholipids and repairs proton leakage of the damaged membranes. Mol. Microbiol. 66:100–109 [DOI] [PubMed] [Google Scholar]
- 47. Koo A. J. K., Ohlrogge J. B., Pollard M. 2004. On the export of fatty acids from the chloroplast. J. Biol. Chem. 279:16101–16110 [DOI] [PubMed] [Google Scholar]
- 48. Lennen R. M., Braden D. J., West R. M., Dumesic J. A., Pfleger B. F. 2010. A process for microbial hydrocarbon synthesis: overproduction of fatty acids in Escherichia coli and catalytic conversion to alkanes. Biotechnol. Bioeng. 106:193–202 [DOI] [PMC free article] [PubMed] [Google Scholar]
- 49. Lipton M. S., et al. 2006. AMT tag approach to proteomic characterization of Deinococcus radiodurans and Shewanella oneidensis. Methods Biochem. Anal. 49:113–134 [PubMed] [Google Scholar]
- 50. Liu T., Vora H., Khosla C. 2010. Quantitative analysis and engineering of fatty acid biosynthesis in E. coli. Metab. Eng. 12:378–386 [DOI] [PubMed] [Google Scholar]
- 51. Livak K. J., Schmittgen T. D. 2001. Analysis of relative gene expression data using real-time quantitative PCR and the 2−ΔΔCt method. Methods 25:402–408 [DOI] [PubMed] [Google Scholar]
- 52. Lu X., Vora H., Khosla C. 2008. Overproduction of free fatty acids in E. coli: implications for biodiesel production. Metab. Eng. 10:333–339 [DOI] [PubMed] [Google Scholar]
- 53. Ma D., Alberti M., Lynch C., Nikaido H., Hearst J. E. 1996. The local repressor AcrR plays a modulating role in the regulation of acrAB genes of Escherichia coli by global stress signals. Mol. Microbiol. 19:101–112 [DOI] [PubMed] [Google Scholar]
- 54. Ma D., et al. 1995. Genes acrA and acrB encode a stress-induced efflux system of Escherichia coli. Mol. Microbiol. 16:45–55 [DOI] [PubMed] [Google Scholar]
- 55. Mäki-Arvela P., Kubickova I., Snåre M., Eränen K., Yu D. Murzin 2007. Catalytic deoxygenation of fatty acids and their derivatives. Energy Fuels 21:30–41 [Google Scholar]
- 56. Maloy S. R., Ginsburgh C. L., Simons R. W., Nunn W. D. 1981. Transport of long and medium chain fatty acids by Escherichia coli K12. J. Biol. Chem. 256:3735–3742 [PubMed] [Google Scholar]
- 57. Martin R. G., Gillette W. K., Rhee S., Rosner J. L. 1999. Structural requirements for marbox function in transcriptional activation of mar/sox/rob regulon promoters in Escherichia coli: sequence, orientation, and spatial relationship to the core promoter. Mol. Microbiol. 34:431–441 [DOI] [PubMed] [Google Scholar]
- 58. McMurry L. M., Oethinger M., Levy S. B. 1998. Overexpression of marA, soxS, or acrAB produces resistance to triclosan in laboratory and clinical strains of Escherichia coli. FEMS Microbiol. Lett. 166:305–309 [DOI] [PubMed] [Google Scholar]
- 59. Mendez-Perez D., Begemann M. B., Pfleger B. F. 2011. A gene encoding a modular synthase is involved in α-olefin biosynthesis in Synechococcus sp. PCC7002. Appl. Environ. Microbiol. 77:4264–4267 [DOI] [PMC free article] [PubMed] [Google Scholar]
- 60. Monroe M. E., et al. 2007. VIPER: an advanced software package to support high-throughput LC-MS peptide identification. Bioinformatics 23:2021–2023 [DOI] [PubMed] [Google Scholar]
- 61. Murphy M. J., Taylor J. D., McCormick R. L. 2004. Compendium of experimental cetane number data. NREL/SR-540-36805 National Renewable Energy Laboratory, Golden, CO [Google Scholar]
- 62. Nicolaou S. A., Gaida S. M., Papoutsakis E. T. 2010. A comparative view of metabolite and substrate stress and tolerance in microbial bioprocessing: from biofuels and chemicals, to biocatalysis and bioremediation. Metab. Eng. 12:307–331 [DOI] [PubMed] [Google Scholar]
- 63. Nishino K., Yamaguchi A. 2001. Analysis of a complete library of putative drug transporter genes in Escherichia coli. J. Bacteriol. 183:5803–5812 [DOI] [PMC free article] [PubMed] [Google Scholar]
- 64. Ohta K., Beall D. S., Mejia J. P., Shanmugam K. T., Ingram L. O. 1991. Genetic improvement of Escherichia coli for ethanol production: chromosomal integration of Zymomonas mobilis genes encoding pyruvate decarboxylase and alcohol dehydrogenase II. Appl. Environ. Microbiol. 57:893–900 [DOI] [PMC free article] [PubMed] [Google Scholar]
- 65. Overath P., Pauli G., Schairer H. U. 1969. Fatty acid degradation in Escherichia coli. An inducible acyl-CoA synthetase, the mapping of old-mutations, and the isolation of regulatory mutants. Eur. J. Biochem. 7:559–574 [PubMed] [Google Scholar]
- 66. Polpitiya A. D., et al. 2008. DAnTE: a statistical tool for quantitative analysis of -omics data. Bioinformatics 24:1556–1558 [DOI] [PMC free article] [PubMed] [Google Scholar]
- 67. Pos K. M. 2009. Drug transport mechanism of the AcrB efflux pump. Biochim. Biophys. Acta 1794:782–793 [DOI] [PubMed] [Google Scholar]
- 68. Price G. P., St. John A. C. 2000. Purification and analysis of expression of the stationary phase-inducible Slp lipoprotein in Escherichia coli: role of the Mar system. FEMS Microbiol. Lett. 193:51–56 [DOI] [PubMed] [Google Scholar]
- 69. Ramos J. L., et al. 2002. 2002. Mechanisms of solvent tolerance in Gram-negative bacteria. Annu. Rev. Microbiol. 56:743–768 [DOI] [PubMed] [Google Scholar]
- 70. Roche NimbleGen 2010. NimbleGen array user's guide: gene expression arrays, version 5.0. Roche NimbleGen, Madison, WI [Google Scholar]
- 71. Rosenberg E. Y., Bertenthal D., Nilles M. L., Bertrand K. P., Nikaido H. 2003. Bile salts and fatty acids induce the expression of Escherichia coli AcrAB multidrug efflux pump through their interaction with Rob regulatory protein. Mol. Microbiol. 48:1609–1619 [DOI] [PubMed] [Google Scholar]
- 72. Rosner J. L., Dangi B., Gronenborn A. M., Martin R. G. 2002. Posttranscriptional activation of the transcriptional activator Rob by dipyridyl in Escherichia coli. J. Bacteriol. 184:1407–1416 [DOI] [PMC free article] [PubMed] [Google Scholar]
- 73. Roth B. L., Poot M., Yue S. T., Millard P. J. 1997. Bacterial viability and antibiotic susceptibility testing with SYTOX green nucleic acid stain. Appl. Environ. Microbiol. 63:2421–2431 [DOI] [PMC free article] [PubMed] [Google Scholar]
- 74. Rowley G., Spector M., Kormanec J., Roberts M. 2006. Pushing the envelope: extracytoplasmic stress responses in bacterial pathogens. Nat. Rev. Microbiol. 4:383–394 [DOI] [PubMed] [Google Scholar]
- 75. Rude M. A., et al. 2011. Terminal olefin (1-alkene) biosynthesis by a novel P450 fatty acid decarboxylase from Jeotgalicoccus sp. Appl. Environ. Microbiol. 77:1718–1727 [DOI] [PMC free article] [PubMed] [Google Scholar]
- 76. Ruiz C., McMurry L. M., Levy S. B. 2008. Role of the multidrug resistance regulator MarA in global regulation of the hdeAB acid resistance operon in Escherichia coli. J. Bacteriol. 190:1290–1297 [DOI] [PMC free article] [PubMed] [Google Scholar]
- 77. Rutherford B. J., et al. 2010. Functional genomic study of exogenous n-butanol stress in Escherichia coli. Appl. Environ. Microbiol. 76:1935–1945 [DOI] [PMC free article] [PubMed] [Google Scholar]
- 78. Schirmer A., Rude M. A., Li X., Popova E., del Cardayre S. B. 2010. Microbial biosynthesis of alkanes. Science 329:559–562 [DOI] [PubMed] [Google Scholar]
- 79. Smyth G. K. 2004. Linear models and empirical Bayes methods for assessing differential expression in microarray experiments. Stat. Appl. Genet. Mol. Biol. 3:3. [DOI] [PubMed] [Google Scholar]
- 80. Standar K., et al. 2008. PspA can form large scaffolds in Escherichia coli. FEBS Lett. 582:3585–3589 [DOI] [PubMed] [Google Scholar]
- 81. Steen E. J., et al. 2010. Microbial production of fatty-acid-derived fuels and chemicals from plant biomass. Nature 463:559–562 [DOI] [PubMed] [Google Scholar]
- 82. Teerawanichpan P., Qiu X. 2010. Fatty acyl-CoA reductase and wax synthase from Euglena gracilis in the biosynthesis of medium-chain wax esters. Lipids 45:263–273 [DOI] [PubMed] [Google Scholar]
- 83. Voelker T. A., Davies H. M. 1994. Alteration of the specificity and regulation of fatty acid synthesis of Escherichia coli by expression of a plant medium-chain acyl-acyl carrier protein thioesterase. J. Bacteriol. 176:7320–7327 [DOI] [PMC free article] [PubMed] [Google Scholar]
- 84. Voelker T. A., et al. 1992. Fatty acid biosynthesis redirected to medium chains in transgenic oilseed plants. Science 257:72–74 [DOI] [PubMed] [Google Scholar]
- 85. Warner D. M., Levy S. B. 2010. Different effects of transcriptional regulators MarA, SoxS and Rob on susceptibility of Escherichia coli to cationic antimicrobial peptides (CAMPs): Rob-dependent CAMP induction of the marRAB operon. Microbiology 156:570–578 [DOI] [PMC free article] [PubMed] [Google Scholar]
- 86. Weiner L., Model P. 1994. Role of an Escherichia coli stress-response operon in stationary-phase survival. Proc. Natl. Acad. Sci. U. S. A. 91:2191–2195 [DOI] [PMC free article] [PubMed] [Google Scholar]
- 87. White D. G., Goldman J. D., Demple B., Levy S. B. 1997. Role of the acrAB locus in organic solvent tolerance mediated by expression of marA, soxS, or robA in Escherichia coli. J. Bacteriol. 179:6122–6126 [DOI] [PMC free article] [PubMed] [Google Scholar]
- 88. Wojtczak L., Wiêckowski M. R. 1999. The mechanisms of fatty acid-induced proton permeability of the inner mitochondrial membrane. J. Bioenerg. Biomembr. 31:447–455 [DOI] [PubMed] [Google Scholar]
- 89. Zhu K., Zhang Y.-M., Rock C. O. 2009. Transcriptional regulation of membrane lipid homeostasis in Escherichia coli. J. Biol. Chem. 284:34880–34888 [DOI] [PMC free article] [PubMed] [Google Scholar]
- 90. Zimmer J. S., Monroe M. E., Qian W. J., Smith R. D. 2006. Advances in proteomics data analysis and display using an accurate mass and time tag approach. Mass Spectrom. Rev. 25:450–482 [DOI] [PMC free article] [PubMed] [Google Scholar]
Associated Data
This section collects any data citations, data availability statements, or supplementary materials included in this article.