Abstract
The structural and spatial associations of Fe with O and C in the outer coat fibers of the Leptothrix ochracea sheath were shown to be substantially similar to the stalk fibers of Gallionella ferruginea, i.e., a central C core, probably of bacterial origin, and aquatic Fe interacting with O at the surface of the core.
TEXT
The Fe/Mn-oxidizing bacteria are known for their potential to form extracellular Fe- or Mn-encrusted structures in aquatic environments (7, 9, 10, 12, 14, 15). The genus Leptothrix forms microtubular sheaths that are distinct in morphology from the twisted stalks produced by another Fe-oxidizing genus, Gallionella (7). Suzuki et al. (15) examined the structural and spatial associations of Fe with O and C in the nanometer-scale stalk fibers of Gallionella ferruginea by high-angle annular dark-field scanning electron microscopy (HAADF-STEM) and electron energy loss spectroscopy (EELS). They determined that the fibers have a central C core, probably of bacterial exopolymers, and that aquatic Fe interacts with O at the surface of the C core, resulting in the deposition of iron oxides at the surface. Emerson and Ghiorse (4, 5) reported that the sheath matrix of Leptothrix discophora SP-6 consisted of two carbohydrate-rich layers: an inner layer of tightly woven structural fibrils and an outer layer of diffuse capsular material with active anionic sites. These papers led us to focus on the outer coat of the Leptothrix ochracea sheath as a target for examining the structural and spatial linkages between Fe, O, and C in its matrix.
Ocherous deposits were collected from groundwater-receiving tanks at a freshwater purification pilot plant in Joyo City, Kyoto Prefecture, Japan (sampling site 1) and at a similar pilot plant located at the Okayama University farm (sampling site 2) 1 day after washing the tank. Although the typical tubular sheaths produced by L. ochracea were confirmed by light microscopy to be predominant in the deposits, we could have been observing a mixed population because of the sampling of natural products in the open-air tanks.
By following the previous method (15), uranyl acetate/lead-stained ultrathin sections prepared from glutaraldehyde/OsO4-fixed and resin-embedded specimens were subjected to transmission electron microscopy (TEM) observation. A suspension of the washed specimens was vacuum dried and Pt coated on an aluminum stub and observed by scanning electron microscopy (SEM).
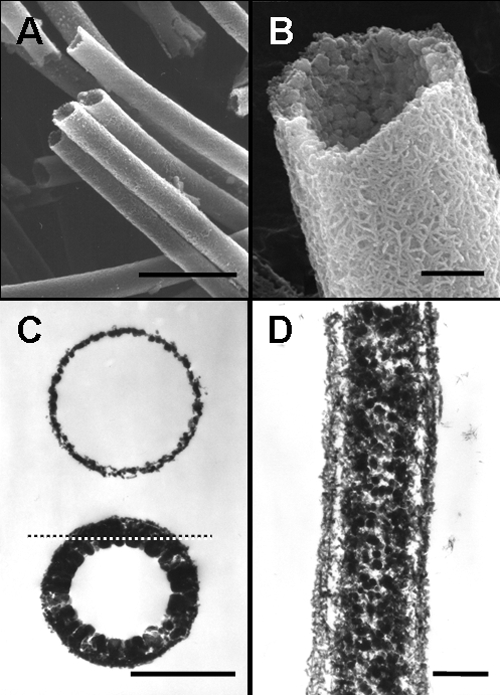
Hollow sheaths of various diameters and lengths were observed in the deposits collected at site 1 (Fig. 1A). An enlarged SEM image revealed the intermingled fibrous outer coat and globular inner wall of the mature sheaths (Fig. 1B), which was consistent with the earlier observation (12). TEM observation of cross sections revealed thin, single-layered rings with fluffy surfaces and also thick double-layered rings (Fig. 1C). The single-layered ring most likely represents an initial sheath with a fluffy coat, which could correspond to the outer sheath layer reported in earlier papers (4, 13), whereas the double-layered ring could be a mature sheath with inner globular deposits, which would be consistent with the SEM image in Fig. 1B. A longitudinal section (Fig. 1D) illustrating the outer fibrous layer and inner electron-dense globules was obtained from the cut plane (dotted line in Fig. 1C) of a mature sheath. The bacterial polysaccharides are considered to trigger initial construction of the outer layer (13), whereas the inner globules may be attributable to abiotic Fe oxidation that proceeds consecutively in the aquatic environment (2, 8). The network structure of the outer coat (Fig. 1B) is most likely attributable to the intermingling and folding of fluffy fibrils formed at the initial stage (Fig. 1C).
Fig. 1.

Micrographs of L. ochracea sheaths harvested from site 1. (A) SEM image of assembling sheaths. Scale bar, 5 μm. (B) Enlarged SEM image of a single sheath. Note the outer network surface and inner globular surface. Scale bar, 500 nm. (C) TEM images of a cross section of the single-layered ring with a fluffy surface of an immature sheath (upper) and a double-layered ring having electron-dense deposits inside (lower). Scale bar, 1 μm. (D) TEM image of a longitudinal section of a mature sheath obtained from a cut plane indicated by the dotted line in panel C. Note the fibrous outer layer and globular inner deposits. Scale bar, 500 nm.
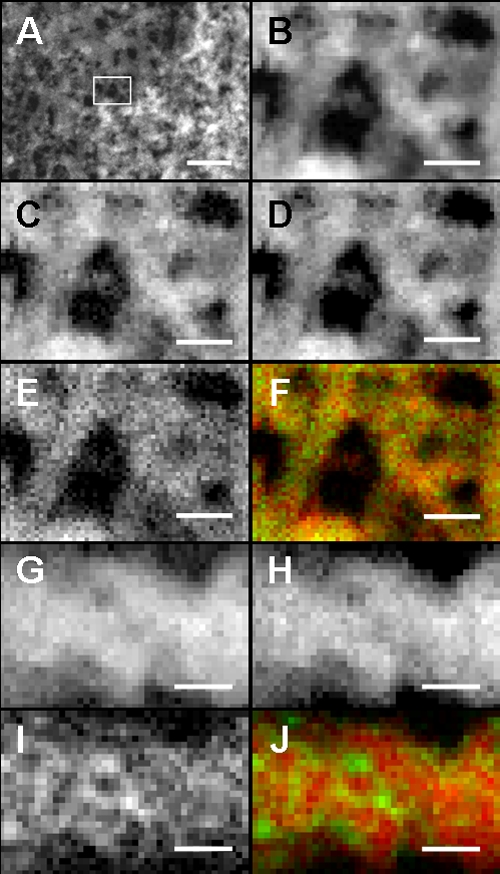
A diluted suspension of fragmented sheaths was air dried on a copper grid and subjected to HAADF-STEM imaging and STEM-EELS mapping, as described in our previous paper (15). The coarse network exposed at the broken plane of the sheath was analyzed using the aberration-corrected STEM (JEM-2100F with the CEOS Cs-corrector). The EELS spectra of C, O, and Fe were acquired using a Gatan imaging filter, and their mapping was performed using the Digiscan function of the Gatan digital micrograph software. The maps of C-K, O-K, and Fe-L2,3 edges were reconstructed from the accumulated spectra on all pixels following the standard protocol of EELS quantitative analysis, which included subtracting background values. In vortexed and sonicated specimens from site 1, the outer network structure was partially released from the sheath (Fig. 2A). An appropriate area (Fig. 2A, frame) was selected for HAADF-STEM imaging (Fig. 2B) and EELS analysis. In EELS mapping (Fig. 2C to J), the fine bright signal spots represent the sites of the energy loss of the incident electron beam by the elements present. Because the energy loss for the respective elements occurs at specific electron voltages, the precise nanometer-scale localization of the specific element is defined by comparing the site density with the background darkness produced. The enlarged HAADF-STEM image of the selected area (Fig. 2B) demonstrates a network structure of intermingled fibers, where the heterogeneous brightness reflects a structural unevenness of the fiber matrix and/or a varied focal plane. In the Fe distribution map (Fig. 2C), brighter and darker spots apparently coexist over the fibers, indicating the heterogeneous distribution of Fe over the entire matrix. The O distribution is similar to that of Fe but more even and exhibiting fewer low-density spots (Fig. 2D). In contrast, the C distribution (Fig. 2E) is characterized by numerous intense signals with high concentrations in some areas. The merging image of Fe/C (Fig. 2F) demonstrates that Fe is distributed in a spotty or aggregated manner in the C matrix. The red spots represent highly concentrated deposits of Fe, and the yellowish spots indicate the colocalization of both elements. The green C zone represents the area with no or less Fe deposition. The structural and spatial associations between each element are more clearly evident in images of a single fiber at a higher resolving power (Fig. 2G to J). Fe and O are similarly distributed over the entire matrix, with some low-density areas (Fig. 2G and H), whereas intense C signals are distributed over the entire matrix. Interestingly, the intense C signals were not detected at the marginal fiber region (Fig. 2I), as is evident in a comparison of Fig. 2G and I, suggesting that C is localized in the core but to a lesser degree, or not at all, at the fiber margin. This interpretation is supported by the merging image of Fe/C (Fig. 2J), in which the intense red Fe signals are localized at the fiber margin, but the green and/or yellowish signals are not. Suzuki et al. (15) detected similar Fe/C localization patterns in Gallionella stalk fibers using EELS and proposed that (i) the C fibrils probably excreted from the bacterial cells were intermingled and folded at the fiber core region but not at the extreme margin and (ii) oxidized Fe could interact with C in the entire fiber. The biotic and abiotic Fe oxidations associated with Leptothrix and Gallionella are still in debate. Based on published data, Emerson et al. (3) estimated rates of biotic Fe oxidation by these bacteria as approximately 45% on average. Similarly, Rentz et al. (11) measured rates of biological and autocatalytic oxidation in Fe-oxidizing bacteria-inhabiting mats and showed the same order of magnitude for both oxidations. These reports show that only one-half of Fe oxidation could be attributable to biological activity. Chan et al. (1) inferred that bacterial cells excrete the carboxyl-rich polymers in order to localize mineral precipitation (both abiotic and biotic). Because iron oxides, including ferrihydrite and/or iron oxyhydroxide, are known to have an affinity for organic matters (1, 6), the presence of C in the Leptothrix sheaths must be significantly involved in abiotic and biotic precipitation of aquatic minerals. Although Fig. 2G to I led us to consider that C could play a key role in creating the unique network structure of the Leptothrix sheath surface, the EELS techniques cannot provide any information about whether all of the detected C components originated from bacterial activity and/or the aquatic environment and whether they might exist in the polymeric form. Further detailed studies are required for solving these questions.
Fig. 2.

HAADF-STEM images and EELS maps of the outer network surface of an L. ochracea sheath harvested from site 1. (A) HAADF image of network fibers comprising the outer surface. Scale bar, 100 nm. (B) Enlarged HAADF image of network fibers in the framed area of panel A. Scale bar, 20 nm. (C, D, and E) EELS map of Fe, O, and C distribution, respectively, shown in panel B. Pixel size, 1.5 nm; scale bar, 20 nm. (F) Merged image of Fe (red)/C (green) distribution shown in panel B. Scale bar, 20 nm. (G, H, and I) EELS map of Fe, O, and C distribution, respectively, in a single fiber at a higher resolving power. Pixel size, 0.53 nm; scale bar, 5 nm. (J) Merged image of Fe (red)/C (green) distribution. The yellowish color represents sites of colocalization of both elements. Note no or fewer C signals at the marginal fiber region. Scale bar, 5 nm.
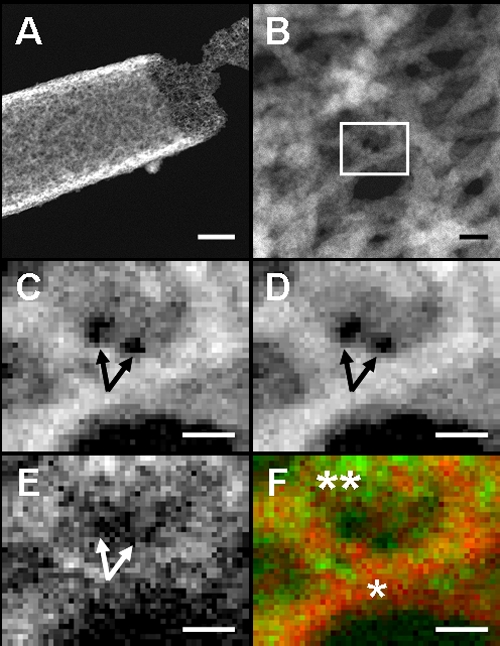
For reference, similar ocherous deposits collected from site 2 were subjected to the same analyses as those described above. Again, partially released outer coat fibers were observed in some sheaths (Fig. 3A and B). The framed area in Fig. 3B was targeted for EELS mapping. Similar to the Fe and O distribution shown in Fig. 2C and D, Fe and O were distributed almost homogeneously in the entire fibers but with some low-density spots (Fig. 3C and D). In contrast, the intense C signals were detected in a spotty manner over the entire matrix. Two dark holes in Fig. 3C and D (arrows) indicate the presence of little or no Fe and O, respectively. Nevertheless, the signals of C appear to cover these holes (Fig. 3E, arrow), indicating the presence of detectable amounts of C at these sites. The heterogeneous distribution of Fe and C is illustrated in the merging image (Fig. 3F): concentrated Fe in one fiber (single asterisk) and lesser Fe in the C matrix of another fiber (double asterisks). Irrespective of the sampling sites, distribution patterns of these three elements in the sheath coat matrix are substantially comparable (Fig. 2 and 3).
Fig. 3.

HAADF-STEM images and EELS maps of the outer network surface of an L. ochracea sheath harvested from site 2. (A) HAADF image of network fibers partially released from the outer sheath coat. Scale bar, 500 nm. (B) Enlarged HAADF image of network fibers. The framed area was targeted for EELS mapping. Scale bar, 20 nm. (C, D, and E) EELS map of Fe, O, and C distribution in panel B, respectively. Note no signals of Fe and O in two holes, indicated by the arrows in panels C and D, respectively, but spotty C signals in the holes in panel E. Pixel size, 0.97 nm; scale bar, 10 nm. (F) Merged image of Fe (red)/C (green) distribution shown in panel B. Note the intense Fe signal in one fiber (single asterisk) and the intense C signal in another fiber (double asterisks). Scale bar, 10 nm.
A separate analysis by inductively coupled plasma-optical emission spectrometry revealed that the Fe content in the groundwater was 2.00 mg/liter at site 1 versus 13.24 mg/liter at site 2. The elemental composition of the sheaths, determined by a separate EDX analysis, was 78:10:12 (Fe:Si:P) in the site 2 specimens, which was close to the composition of the sheaths at site 1 (73:22:5), with regard to the relative amount of Fe (12). The current data, along with these additional data, demonstrate that the basic elemental composition and distribution in the L. ochracea sheath are not affected by the Fe content in the water with which the sheaths were in contact in situ.
The most important finding is that the constitutional associations between Fe, O, and C are quite similar in morphologically distinguishable Leptothrix sheaths and Gallionella twisted stalks. Our previous EELS mapping (15) suggested that Fe could exist as iron oxide and/or oxyhydroxide in the fibers of G. ferruginea. It is likely that organic fibrils in the stalks and sheaths collect iron oxyhydroxides and control its recrystallization in the structures, which possibly explains the natural formation of the mineralized structures, as suggested by Chan et al. (1, 2). Irrespective of the apparent morphological differences between Leptothrix sheaths and Gallionella stalks, such a constitutional similarity could be attributable to the preferential and selectively regulated affinity of the elements for these respective structures. This affinity may provide a clue to understanding the ubiquitous mechanism of spontaneous Fe deposition in aquatic environments.
Acknowledgments
This study was financially supported by the Special Grant for Education and Research from the Ministry of Education, Culture, Sports, Science, and Technology, Japan (J.T.), a Grant-in-Aid for Research Activity Start-up (no. 22860040, 2010 and 2011) (H.H.), and the Yakumo Foundation for Environmental Science (H.H. and T.S.).
Footnotes
Published ahead of print on 16 September 2011.
REFERENCES
- 1. Chan C. S., Fakra S. C., Edwards D. C., Emerson D., Banfield J. F. 2009. Iron oxyhydroxide mineralization on microbial extracellular polysaccharides. Geochim. Cosmochim. Acta 73:3807–3818 [Google Scholar]
- 2. Chan C. S., Fakra S. C., Emerson D., Fleming E. J., Edwards K. J. 2011. Lithotrophic iron-oxidizing bacteria produce organic stalks to control mineral growth: implication for biosignature formation. ISME J. 5:717–727 [DOI] [PMC free article] [PubMed] [Google Scholar]
- 3. Emerson D., Fleming E. J., McBeth J. M. 2010. Iron-oxidizing bacteria: an environmental and genomic perspective. Annu. Rev. Microbiol. 64:561–583 [DOI] [PubMed] [Google Scholar]
- 4. Emerson D., Ghiorse W. C. 1993. Ultrastructure and chemical composition of the sheath of Leptothrix discophora SP-6. J. Bacteriol. 175:7808–7818 [DOI] [PMC free article] [PubMed] [Google Scholar]
- 5. Emerson D., Ghiorse W. C. 1993. Role of disulfide bonds in maintaining the structural integrity of the sheath of Leptothrix discophora SP-6. J. Bacteriol. 175:7819–7827 [DOI] [PMC free article] [PubMed] [Google Scholar]
- 6. Eusterhues K., et al. 2008. Characterization of ferrihydrite-soil organic matter coprecitates by X-ray diffraction and Mössbauer spectroscopy. Environ. Sci. Technol. 42:7891–7897 [DOI] [PubMed] [Google Scholar]
- 7. Ghiorse W. C. 1984. Biology of iron- and manganese-depositing bacteria. Annu. Rev. Microbiol. 38:515–550 [DOI] [PubMed] [Google Scholar]
- 8. Hallberg R., Ferris F. G. 2004. Biomineralization by Gallionella. Geomicrobiol. J. 21:325–330 [Google Scholar]
- 9. Hashimoto H., et al. 2007. Characteristics of hollow microtubes consisting of amorphous iron oxide nanoparticles produced by iron oxidizing bacteria, Leptothrix ochracea. J. Magn. Magn. Mater. 310:2405–2407 [Google Scholar]
- 10. Miot J., et al. 2009. Extracellular iron biomineralization by photoautotrophic iron-oxidizing bacteria. Appl. Environ. Microbiol. 75:5586–5591 [DOI] [PMC free article] [PubMed] [Google Scholar]
- 11. Rentz J. A., Kraiya C., Luther G. W., III, Emerson D. 2007. Control of iron oxidation within circumneutral microbial iron mats by cellular activity and autocatalysis. Environ. Sci. Technol. 41:6084–6089 [DOI] [PubMed] [Google Scholar]
- 12. Sakai T., et al. 2010. Chemical modification of biogenous iron oxide to create an excellent enzyme scaffold. Organic Biomol. Chem. 8:336–338 [DOI] [PubMed] [Google Scholar]
- 13. Sawayama M., et al. 2011. Isolation of a Leptothrix strain, OUMS1, from ocherous deposits in groundwater. Curr. Microbiol. 63:173–180 [DOI] [PubMed] [Google Scholar]
- 14. Spring S. 2006. The genera Leptothrix and Sphaerotilus, p. 758–777 In Dworkin M., Falkow S., Rosenberg E., Schleifer K.-H., Stackebrandt E. (ed.). The prokaryotes, 3rd ed., vol. 5 Springer Science, New York, NY [Google Scholar]
- 15. Suzuki T., et al. 2011. Nanometer-scale visualization and structural analysis of the inorganic/organic hybrid structure of Gallionella ferruginea twisted stalks. Appl. Environ. Microbiol. 77:2877–2881 [DOI] [PMC free article] [PubMed] [Google Scholar]


