

Abstract
Past analyses of sequence diversity in high-resolution protein-encoding genes have identified putative ecological species of unicellular cyanobacteria in the genus Synechococcus, which are specialized to 60°C but not 65°C in Mushroom Spring microbial mats. Because these studies were limited to only two habitats, we studied the distribution of Synechococcus sequence variants at 1°C intervals along the effluent flow channel and at 80-μm vertical-depth intervals throughout the upper photic layer of the microbial mat. Diversity at the psaA locus, which encodes a photosynthetic reaction center protein (PsaA), was sampled by PCR amplification, cloning, and sequencing methods at 60, 63, and 65°C sites. The evolutionary simulation programs Ecotype Simulation and AdaptML were used to identify putative ecologically distinct populations (ecotypes). Ecotype Simulation predicted a higher number of putative ecotypes in cases where habitat variation was limited, while AdaptML predicted a higher number of ecologically distinct phylogenetic clades in cases where habitat variation was high. Denaturing gradient gel electrophoresis was used to track the distribution of dominant sequence variants of ecotype populations relative to temperature variation and to O2, pH, and spectral irradiance variation, as measured using microsensors. Different distributions along effluent channel flow and vertical gradients, where temperature, light, and O2 concentrations are known to vary, confirmed the ecological distinctness of putative ecotypes.
INTRODUCTION
Surveys of sequence diversity have led to the discovery of ecologically adapted populations in extremely closely related microorganisms in multiple taxa that inhabit many different environments. For instance, molecular diversity in Prochlorococcus spp. (16, 22, 34) and proteorhodopsin-containing bacteria (4) has been found to vary with depth in the marine water column in relation to variation in light intensity and quality, as well as differences in nutrient availability. Unique Bacillus sequence clusters were shown to be associated with desert hillsides having distinct solar exposure patterns and soil textures (8, 18). Molecular analyses also have shown closely related, ecologically distinct populations in marine Vibrio (14), acid mine Leptospirillum (9), and multiple pathogens, including Legionella (6), Escherichia (21, 29, 30), Mycobacterium (25), Salmonella (26), and Yersinia (35). Finally, genetically distinct populations of hot spring Synechococcus have been shown to be associated with different temperatures and vertical distributions (12, 24, 32).
In the case of Synechococcus, five closely related 16S rRNA genotypes (termed A3, A′, A, B′, and B) exhibited different distributions along the effluent channels of both Octopus and Mushroom Springs from the upper temperature limit at ∼74°C to ∼50°C (12, 32). Cultivated Synechococcus strains representing some of these 16S rRNA genotypes exhibited unique optimal growth temperatures, as well as different temperature ranges for growth, which correlated with the in situ genotype distributions (1). This provided a means of testing the hypothesis that adaptive evolution, at least in part, can explain the distribution pattern observed in situ. Vertical distribution studies gave further evidence for the adaptation of Synechococcus spp. At 60°C, the Synechococcus B′ 16S rRNA genotype was the only cyanobacterial genotype detected near the mat surface, while the Synechococcus A 16S rRNA genotype was detected only at lower depths in the approximately 1-mm-thick top green layer of the mat (24), correlating with a brightly autofluorescent subsurface Synechococcus population. At 68°C, where the Synechococcus A′ genotype is found, there was no sequence diversity at the 16S rRNA locus throughout the vertical aspect. However, the examination of the more rapidly evolving 16S-23S rRNA internal transcribed spacer (ITS) region allowed for the identification of two unique genetic populations that inhabited distinct vertical positions within the top green layer (11). One sequence cluster was found in the top portion of the green layer, while the other was found near the bottom of the green layer, where the more brightly autofluorescent Synechococcus population resided. In contrast, at 65°C, no differences in 16S rRNA or ITS sequences were found throughout the vertical aspect of the mat, raising the question of whether more molecular resolution was needed to separate ecologically distinct populations of cyanobacteria, or whether one differently acclimated population was merely autofluorescing dissimilarly at different light intensities (32).
Recently, genetic variation in protein-encoding loci of Synechococcus was analyzed with an evolutionary simulation program based on the stable ecotype model of species and speciation (23). Ecotype simulation (ES) was used to predict, from sequence variation alone, putative ecologically distinct populations (i.e., putative ecotypes [PEs]), which group together as sequences that are hypothesized to represent ecologically interchangeable individuals (7, 18). The algorithm AdaptML (14), which utilizes both habitat specialization and phylogeny, also was used in this study to identify ecologically distinct phylogenetic clusters of sequences (i.e., ecological clusters [ECs]). These two algorithms have been shown previously to yield similar, though not identical, demarcations of ecologically distinct populations (8, 23). Previous applications of ES and AdaptML have shown that the greater molecular resolution provided by protein-encoding loci increased the number of Synechococcus PEs predicted by 4 to 14 times that observed with 16S rRNA, and the number of PEs predicted for each gene was a function of the rate of evolution of the gene (23). The validation of whether PEs meet the expectations of true ecologically specialized populations can be achieved through the examination of unique spatial distributions relative to different features of the habitat (32). However, in the case of hot spring Synechococcus populations, studies done to date using protein-encoding sequences have included only two habitats, and this limited the identification of habitat associations.
The aim of this study was to more thoroughly examine the distribution patterns of populations predicted from sequence analyses to be ecologically distinct. To do so, we examined the distribution of genetic variation of a highly resolving protein-encoding locus along fine-scale environmental gradients as quantified by microsensor analysis (19). We used variation in the psaA locus, which encodes a reaction center protein subunit of photosystem I, an essential component of the cyanobacterial photosynthesis apparatus, to predict PEs. This locus was selected because it is one of the most highly expressed genes detected in metatranscriptomic analyses of these mats (20) and thus offers the potential to reveal differences in expression patterns among individual ecotypes, which could be useful for discerning adaptive differences among populations that coexist spatially. Since PE clades contain dominant sequence variants (23), we were able to use denaturing gradient gel electrophoresis (DGGE) to track the distributions of PEs predicted by ES and ECs predicted by AdaptML. We show that Synechococcus populations predicted to be PEs or ECs do exhibit different distribution patterns, as is expected of true ecological species.
MATERIALS AND METHODS
Sampling.
This study was focused on the 65 to 59°C region of the major effluent channel of Mushroom Spring, an alkaline siliceous hot spring in the Lower Geyser Basin, Yellowstone National Park, WY. Samples were collected from sites spread over a distance of ∼15 m in the main flow path and defined by temperatures measured at the specific time of collection, similarly to the sample sites in Fig. S1 in the supplemental material. Temperatures at specific sites in Mushroom Spring fluctuate during the diel cycle (see Fig. S2 in the supplemental material) and seasonally (S. Nowack and I. Klapper, unpublished results). Microbial mat samples were collected on 20 September 2006 at temperature-defined sites along the flow path using a number 2 cork borer (19.6 mm2). The ∼1-mm-thick top green layer of the mat containing Synechococcus cells was removed with a sterile razor blade and immediately frozen on site in liquid N2. Samples for vertical distribution analyses, which included the orange undermat beneath the green layer, were collected at midday on 13 and 14 September 2008 with a number 2 cork borer and were immediately frozen in isopentane kept cold with liquid N2. These samples were stored during transit on dry ice in 15-ml Falcon tubes packed with Kimwipes at both ends to prevent physical damage as described by Ramsing et al. (24) and were transferred to a −80°C freezer for long-term storage.
Vertical dissection.
Frozen cores were embedded in Tissue-Tek O.C.T. compound cryoprotectant (Sakura, Torrance, CA) and sliced parallel to the mat surface at 40-μm intervals using a cryotome (Leica CM 1850; Leica, Bellevue, WA) with a fixed sterile diamond knife at −20°C. Two adjacent 40-μm slices were combined for DNA extraction. This procedure was repeated throughout the top green layer, which ranged in thickness from 500 to 980 μm.
DNA extraction and purification.
Nucleic acids were extracted and purified with the fastDNA spin kit (Molecular Biosciences) according to the manufacturer's instructions. Cells were suspended in the manufacturer's lysis solution and lysed by bead beating in a Fastprep cell disrupter (Bio101 Savant Instruments, New York, NY) for 45 s at a speed setting of 6.5 m/s.
PCR amplification, cloning, sequencing, and phylogenetic analyses.
A 557-bp segment of the psaA gene (positions 279 to 836; total gene length, 2,268 bp; a single copy in the Synechococcus strain A and B′ genomes) was chosen for analysis, because it resides within the most variable region of the psaA gene and exhibits 8% nucleotide divergence between homologs in the Synechococcus strain A and B′ genomes (5). Primers for the amplification of Synechococcus A/B-lineage psaA genes (psaAforward, 5′-CTGAGCGGCATGTACTACCA-3′; psaArerverse, 5′-CAGGCCACCCTTGAAGGTG-3′) were designed using the primer design tool in SciTools on the Integrated DNA Technologies website; BLAST analyses (2) against the GenBank nucleotide (nr/nt) database (http://www.ncbi.nlm.nih.gov/GenBank/index.html) and Mushroom and Octopus Spring metagenomes (17) were conducted to ensure that the top match of the primers was to Synechococcus strain A or B′ psaA homologs.
Primers were diluted to a final concentration of 10 μM for use in the PCR mixture (5 μl MgCl2 [25 μM], 5 μl reaction buffer, 5 μl bovine serum albumin, 1 μl of each 10 μM primer stock solution, 1 μl deoxynucleoside triphosphates [dNTPs] [10 μM each], 0.25 μl Taq gold polymerase, and 31.75 μl double-distilled H2O). Cycling conditions were an initial denaturing step of 94°C for 2 min, followed by 30 cycles of 45 s at 94°C, 45 s at 53°C, and 90 s at 72°C. After verifying the sizes of the PCR products using agarose gel electrophoresis, PCR products were purified using a QIAquick PCR purification kit (Qiagen).
Purified PCR products were cloned using the TOPO TA 4.1 cloning kit (Invitrogen Life Technologies) with 2 μl of DNA solution (∼1 μg/ml), and cells were transformed by following the manufacturer's protocol. Transformant colonies were picked, and inserts were analyzed by the PCR amplification of the psaA locus and gel electrophoresis. Clones with correctly sized inserts were sequenced using the psaA forward and reverse PCR primers at the Idaho State University Molecular Biosciences Core Facility. Sequence data were aligned and manually edited using Sequencher 4.7. Clone sequence ends were trimmed to achieve a final length of 523 bp to obtain the maximum number of sequences for analysis. Neighbor-joining trees were constructed, and average evolutionary divergence was calculated using MEGA 4.0 software (28).
Ecotype demarcation.
Sequences were assigned as either Synechococcus A-like or B′-like at 60 and 63°C if they were ≥92% identical to the respective psaA genomic homologs in Synechococcus strain A (JA-3-3Aa) or B′ [JA-2-3B′a(2-13)]. Aligned sequences for A-like and B′-like psaA variants (alignments are available on request) were analyzed using ES to predict the number of putative ecotypes with 1.5× sorting (7, 18). Neighbor-joining trees were constructed and uploaded into ES as Newick files for ecotype demarcation. Sequences were classified into ecotypes using the automatic demarcation approach (https://wesfiles.wesleyan.edu/home/fcohan/web/EcoSim_Web_Site/index.htm). ES demarcated putative ecotypes as the largest clades that were consistent with containing a single ecotype (i.e., the confidence interval of the number of ecotypes for the clade included the value 1). AdaptML analysis was performed using software available at http://almlab.mit.edu/adaptml/, with temperature habitat variation and the sequence-based phylogeny as the input (14). Single sequences demarcated as PEs (singleton PEs) are identified with asterisks in Fig. 1 and 2. Single sequences demarcated as ECs (singleton ECs) were not shown, because the combination of nucleotide polymorphisms and habitat variation led to large numbers of singleton ECs that contained only a single nucleotide polymorphism. Singleton PEs and ECs are not considered in the main text so that distribution analyses could be focused on more abundant ecotypes that contain a dominant allele.
Fig. 1.

Neighbor-joining phylogenetic tree based on B′-like Synechococcus psaA sequences recovered from a 60°C site in the Mushroom Spring mat. Brackets show clusters of sequences demarcated as PEs by ES or as an EC by AdaptML; subclades with dominant variants within PEs also are indicated. The ratio of the number of dominant sequence variants to the total number of variants in a PE or subclade is indicated within parentheses to the right of the PE designation. The triangle orientation indicates association with upper (▴) and lower (▾) mat layers based on DGGE results. The location of the Synechococcus sp. strain B′ genomic homolog is shown by the arrow. Single sequences demarcated as PEs are indicated with asterisks. The scale bar indicates the number of fixed point mutations per nucleotide position.
Fig. 2.

Neighbor-joining phylogenetic tree based on A-like Synechococcus psaA sequences recovered from 60, 63, and 65°C sites in the Mushroom Spring mat. Brackets show clusters of sequences demarcated as PEs by ES or as ECs by AdaptML; subclades with dominant variants within PEs also are indicated. The ratio of the number of dominant sequence variants to the total number of variants in the PE, subclade, or EC is indicated within parentheses to the right of the PE designation. Colored symbols indicate the temperature at which the majority of sequences within a putative ecotype were collected (blue, 60°C; purple, 63°C; red, 65°C); the triangle orientation indicates association with upper (▲) and lower (▼) mat layers based on DGGE results. Circles indicate temperature distribution only. Numbers separated by colons to the right of some symbols indicate the number of sequences retrieved from each site (60°C:63°C:65°C). The location of the Synechococcus sp. strain A genomic homolog is shown by the arrow. Single sequences demarcated as PEs are indicated with asterisks. The scale bar indicates the number of fixed-point mutations per nucleotide position.
DGGE.
The denaturing gradient gel electrophoresis (DGGE) procedure, band dissection, and reagents were the same as those in Ferris et al. (10). The DGGE clamp (5′-CGCCCGCCGCGCCCCGCGCCCGGCCCGCCGCCCCCGCCCCTGAGCGGCATGTACTACCA-3′) was attached to the 5′ end of the forward psaA primer for amplification. DGGE gels were prepared to form a 50 to 60% denaturant gradient of urea and formamide, which was determined to provide optimal band separation. DGGE gels were stained with SYBR green and photographed with a Kodak 200R image station. Bands were excised and DNA was extracted (see reference 10), and DNA was purified using a QIAquick PCR purification kit (Qiagen) to remove traces of acrylamide before PCR amplification and sequencing. Sequenced clones containing dominant alleles of closely related A-like PEs were PCR amplified and denatured to analyze comigration patterns. DGGE patterns observed along the main flow path were replicated multiple times, and allelic distribution remained visibly unchanged from September 2006 to September 2008 (see Fig. S3 in the supplemental material).
Physical/chemical analyses.
The temperature of spring water at the sampling sites along the flow gradient was monitored using an electronic thermometer (DigiSense dual logger; Eutech Instruments, Singapore). Ambient photosynthetically active radiation (PAR; 400 to 700 nm) was quantified as downwelling irradiance as measured with a quantum irradiance sensor connected to a battery-driven data-logging light meter (LI 1400; LiCor, NE).
Profiles of O2 concentration and pH versus depth in the mat were measured in situ with electrochemical microsensors mounted on a motor-driven micromanipulator and calibrated as described in detail elsewhere (15, 27). Measuring sites were adjacent to and slightly upstream from mat collection sites so that debris from sampling would not affect the microsensor measurements.
Spectral photon scalar irradiance versus depth in the mat was profiled with fiber optic microsensors as described in detail elsewhere (19, 32). Irradiance was measured in fresh mat samples retrieved at the different temperature sites with a core sampler (inner diameter, ∼1.5 cm) and brought to the laboratory for analysis within 24 h after sampling. Light spectra were measured with a fiber optic halogen lamp (KL2500; Schott GmbH, Germany) illuminating the mat vertically from above. A scalar irradiance microsensor was inserted into the mat at a zenith angle of 135° (relative to the vertically incident light) in steps of 100 to 200 μm vertical distance using a manually operated micromanipulator. The scalar irradiance microsensor was connected to a thermoelectrically cooled spectrometer (QE65000; Ocean Optics).
Nucleotide sequence accession numbers.
The nucleotide sequences have been submitted to GenBank under the accession numbers JN160275 to JN160599.
RESULTS
Variation in psaA and prediction of putative ecotypes and ecological clusters.
A highly variable region of the psaA gene was PCR amplified from DNA extracted from mat samples collected at Mushroom Spring sites at 60, 63, and 65°C, and the resultant amplicons were cloned. A sample of 245 clones from the 60°C site, 26 clones from the 63°C site, and 49 clones from the 65°C site were sequenced (184 B′-like and 136 A-like clones) to obtain the phylogenies shown in Fig. 1 and 2. Compared to those of other loci studied previously, the average evolutionary distances for A-like and B′-like psaA variants were most similar to those of the aroA (encoding 3-phosphoskimate 1-carboxyvinyltransferase) locus (Table 1). In separate analyses of Synechococcus A-like and B′-like populations, ES predicted a total of 21 nonsingleton PEs (i.e., those containing more than one variant; 12 B′-like and 9 A-like), and AdaptML predicted a total of 14 nonsingleton ECs (1 B′-like and 11 A-like). Most of the PEs and ECs contained dominant alleles along with singleton variants, which generally were divergent from the dominant sequence by one or two nucleotide substitutions. ES estimated the periodic selection rate (sigma) to be 0.998 (confidence interval of 0.0195 to 2.13) and the ecotype formation event rate (omega) to be 0.152 (confidence interval of 0.104 to 0.342) (rates are per nucleotide substitution in the psaA sequence).
Table 1.
Molecular resolution and PE prediction by ES analysis for Synechococcus populationsa
| Locusb | AEDc of A-like PE | AED of B′-like PE | No. of A-like PEsd | No. of B′-like PEs |
|---|---|---|---|---|
| 16S | 0.002 | 0.002 | 1 | 2 |
| ITS | 0.002 | 0.010 | 2 | 6 |
| apcAB | 0.016 | 0.010 | 5 | 5 |
| aroA | 0.013 | 0.030 | 4 | 13 |
| psaA | 0.014 | 0.021 | 12 (9) | 18 (12) |
| rbsK | 0.095 | 0.050 | 14 | 15 |
Synechococcus A-lineage and B′-lineage populations from 60 and 65°C Mushroom Spring samples were examined at the psaA locus and other loci using 70 sequences and allowing singleton PEs.
Loci other than psaA that were analyzed by Melendrez et al. (23). aroA encodes 3-phosphoskimate 1-carboxyvinyltransferase, apcAB encodes the allophycocyanin alpha and beta subunits, and rbsK encodes ribokinase. Boldface indicates the locus used in the study.
AED, average evolutionary divergence.
PEs reported in reference 23 were demarcated on the basis of variation in 70 sequences and included PEs demarcated based on singleton sequences. Comparable PE numbers for psaA variants were based on random samplings of 70 variants and included singleton PEs. Values in parentheses are numbers of nonsingleton PEs predicted from all of the psaA sequences included in this study.
Of the 12 nonsingleton B′-like PEs predicted by ES, 9 contained a dominant variant (i.e., a sequence comprising >15% of a putative ecotype). PEs without a dominant variant always contained a small number of sequences (≤3). The B′-like sequences also were analyzed with AdaptML, which predicted one EC. Because B′-like sequences were recovered only from the 60°C sample, there was no opportunity for AdaptML to distinguish multiple ECs. The Synechococcus sp. strain B′ genome psaA sequence, which was not included in ES or AdaptML analyses, is most closely related to a singleton PE that fell between PE clades B′5 and B′6 (arrow in Fig. 1). PE B′9 subclades (PE B′9-1 and PE B′9-2) did not contain enough molecular divergence for ES to demarcate them as unique PEs, although these groups of sequences each contain a dominant allele (Fig. 1).
ES predicted nine nonsingleton A-like PEs, eight of which contained a dominant allele. PEs A1 and A3 to A6 were most frequently recovered from the 60°C sample, PE A7 was mostly recovered from the 63°C sample, and PEs A2, A8, and A9 were almost exclusively recovered from the 65°C sample. PE A8 and A9 are likely to be A′-like sequences, as they showed a closer relationship to homologs in a metagenome produced from DNA extracted from a 68°C mat sample (see Fig. S4 in the supplemental material), where A′-like 16S rRNA sequences predominate (17). The psaA sequence from the Synechococcus sp. strain A genome was 100% identical to the dominant allele of the most abundant A-like PE (A1) (arrow in Fig. 2). PEs A1 and A9 contain four and three subclades, respectively, each of which has its own dominant sequence variant, but these subclades were not demarcated as separate PEs by ES. The PE A1 subclades all were demarcated by AdaptML as unique ECs, one of which was retrieved only from the 60°C sample and three of which were predominantly associated with the 63°C sample (EC A2 to EC A4). AdaptML did not resolve PE A8 and PE A9 and did not demarcate PE A9 subclades as unique ECs, but these groups were retrieved only from the 65°C sample (Fig. 2).
Distribution of psaA variants along the effluent flow path.
Along the flow path between 65 and 59°C, shifts in DGGE bands were observed at 64 to 65°C and 61 to 62°C (Fig. 3). These shifts in population structure were observed at slightly higher temperatures in 2008 (see Fig. S3 in the supplemental material), which might be due to differences in the degree to which the single measured temperature reflects the actual average temperature of a site (see Fig. S2 in the supplemental material) or to year-to-year differences in water chemistry. Many of the DGGE bands were dissected, purified, sequenced, and analyzed with the clone library sequences to determine their relationship to PEs predicted by ES and to ECs predicted by AdaptML. At 60 to 61°C, the three most intense DGGE bands corresponded to the dominant variants of the most well-represented PEs in the B′-like and A-like phylogenies (B′9, B′7, and A1), which were defined by sequences of clones retrieved from the 60°C site. In the 63 and 64°C samples, the band that migrated slightly lower in the gel than the A1 band corresponds to the dominant variant of PE A7 (EC A10), whose dominant allele was recovered only from the 63°C clone library. Bands corresponding to the dominant variants of PEs A1 and A7 exhibit how comigration limits band resolution in DGGE analysis. Multiple distinct DGGE bands were observed at 65°C, the most intense of which corresponded to the dominant variant of the most abundant PE in the 65°C clone library (A9). A second dominant band migrated just above the dominant A9 band, and at least three other intense DGGE bands in the 65°C DGGE sample were visible that could not be purified and sequenced but might correspond to PE A8 and subclades of PE A9, respectively. Alternatively, these unidentified bands may be heteroduplexes of very closely related A-like and B′-like populations, since they also exhibit unique distributions along the effluent channel.
Fig. 3.
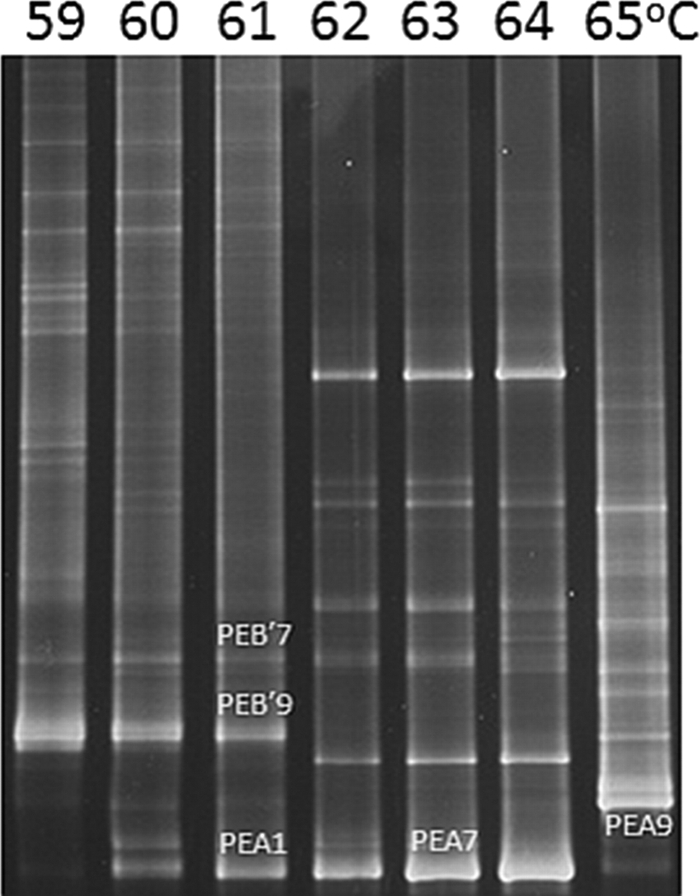
Denaturing gradient gel electrophoresis analysis of PCR-amplified psaA gene segments obtained from Mushroom Spring microbial mat samples collected at different temperature-defined sites (59 to 65°C) along the main flow path in the effluent channel. Labeled bands were purified, sequenced, and found to correspond to the dominant variants of putative ecotypes B′7, B′9, A1, A7, and A9 shown in Fig. 1 and 2. The direction of electrophoresis is top to bottom.
Vertical distribution of psaA variants.
PCR-amplified psaA sequences obtained from different vertical sections of 60 and 63°C mat samples were analyzed by DGGE to observe vertical population structures (Fig. 4). Bands at different vertical intervals were identified based on comigration with bands in the whole-mat sample that had been purified and sequenced. At 60°C (Fig. 4A), bands corresponding to the dominant variants of PEs B′9 and B′7 were most intense toward the top of the mat and decreased in intensity with depth, with the band corresponding to PE B′7 being most intense closer to the mat surface and its intensity decreasing more rapidly with depth than that of the band corresponding to PE B′9. Two distinct bands migrating to positions near that of the dominant variant of PE A1 were most intense in the lower layers of the 60°C sample (arrows in Fig. 4A). It was not possible to separately purify and sequence these bands; however, we suspect that they most likely are from PEs A1 (and subclade A1-1, which is the same as EC A1), A4, and A6, which were the next most abundant PEs detected in cloning and sequencing analysis of the 60°C sample. Further support for this interpretation comes from the very similar DGGE migrations of the dominant alleles of these populations in DGGE analysis (Fig. 5).
Fig. 4.

Vertical distribution of psaA variants, light, O2, and pH at 60°C (A) and 63°C (B) sites in the microbial mat inhabiting the effluent channel of Mushroom Spring. The column on the left shows denaturing gradient gel electrophoresis analyses of PCR-amplified psaA gene segments obtained from 80-μm-thick vertical sections of the top green layers. Arrows indicate the different positions of closely migrating dominant alleles, which appear as one band in whole-mat samples and comigrate with the PE A1 and A7 band that was purified and sequenced (Fig. 3). The direction of electrophoresis is left (top) to right (bottom). The middle column shows spectral scalar irradiance (400 to 700 nm). Data were normalized to the downwelling irradiance at the mat surface. The spectral coverage in deeper layers was narrowed due to spectrometer stray light at wavelengths of <500 nm. The column on the right shows in situ depth profiles of O2 concentration (solid symbols) and pH (open symbols) measured at noon (between 12:00 p.m. and 1:00 p.m. at an irradiance of >1,600 mmol photons m−2 s−1).
Fig. 5.
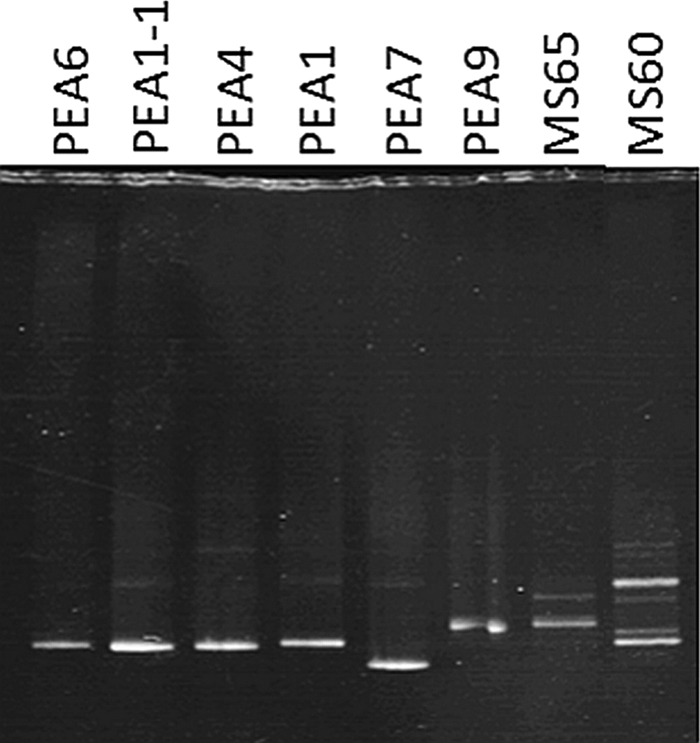
Denaturing gradient gel electrophoresis analyses of PCR-amplified psaA gene segments obtained from clones containing dominant alleles of closely related A-like putative ecotypes and mat DNA from 65 and 60°C samples (MS65 and MS60, respectively).
Several closely migrating bands also were observed in the 63°C vertical profile (Fig. 4B). A band corresponding to PE A7 was found between the mat surface and a depth of 480 μm (band 1 in Fig. 4B). Three other bands, which migrated slightly less far into the DGGE gel, were found at different subsurface depth intervals. The most intense and furthest migrating of these bands was found below a depth of 480 μm (band 2). Another band appeared between 400 μm and the bottom of the mat (band 3). The least intense of these bands, which exhibited the shortest migration distance, appeared between 240 and 720 μm (band 4). We suspect that bands 2, 3, and 4 represent PE A1 subclades A1-2, A1-3, and A1-4, as these were minor populations demarcated by AdaptML, which were demarcated as ECs A2, A3, and A4 and were predominantly retrieved from the 63°C site. Other dominant bands in the 63°C sample that could not be purified or sequenced may be heteroduplexes of these very closely related A-like populations, since they also exhibit increasing band intensities with depth. The habitat distribution of each ecotype is summarized in Table 2.
Table 2.
Summary of A-like and B′-like Synechococcus putative ecotypes, subclades, and ecological clusters
| ES and AdaptML clusters | DA ratiob | No. of sequences from: |
Vertical habitatc (μm) | ||
|---|---|---|---|---|---|
| 60°C | 63°C | 65°C | |||
| PEsa | |||||
| PEA1 | 10/44 | 26 | 14 | 4 | 160–960 |
| A1-1 | 4/10 | 10 | 0 | 0 | |
| A1-2 | 0/3 | 0 | 3 | 0 | |
| A1-3 | 0/3 | 0 | 3 | 0 | |
| A1-4 | 3/3 | 1 | 2 | 0 | |
| PEA2 | 2/3 | 1 | 0 | 2 | |
| PEA3 | 0/3 | 3 | 0 | 0 | |
| PEA4 | 4/11 | 11 | 0 | 0 | |
| PEA5 | 2/4 | 4 | 0 | 0 | |
| PEA6 | 4/12 | 10 | 1 | 1 | |
| PEA7 | 4/13 | 3 | 9 | 1 | 0–480 |
| PEA8 | 3/11 | 0 | 0 | 11 | |
| PEA9 | 10/32 | 0 | 0 | 32 | |
| A9-1 | 3/7 | 0 | 0 | 7 | |
| A9-2 | 3/4 | 0 | 0 | 4 | |
| A9-3 | 3/3 | 0 | 0 | 3 | |
| PEB′1 | 9/18 | 18 | 0 | 0 | |
| PEB′2 | 2/8 | 8 | 0 | 0 | |
| PEB′3 | 3/6 | 6 | 0 | 0 | |
| PEB′4 | 2/11 | 11 | 0 | 0 | |
| PEB′5 | 0/3 | 3 | 0 | 0 | |
| PEB′6 | 2/3 | 3 | 0 | 0 | |
| PEB′7 | 8/21 | 21 | 0 | 0 | 0–80 |
| PEB′8 | 7/22 | 22 | 0 | 0 | |
| PEB′9 | 12/78 | 78 | 0 | 0 | 0–400 |
| B′9-1 | 9/20 | 20 | 0 | 0 | |
| B′9-2 | 4/9 | 9 | 0 | 0 | |
| PEB′10 | 0/3 | 3 | 0 | 0 | |
| PEB′11 | 2/3 | 3 | 0 | 0 | |
| PEB′12 | 0/2 | 2 | 0 | 0 | |
| Singletons | 0/11 | 11 | 0 | 0 | |
| ECsd | |||||
| ECA1 | 4/10 | 10 | 0 | 0 | |
| ECA2 | 0/3 | 0 | 3 | 0 | |
| ECA3 | 0/3 | 0 | 3 | 0 | |
| ECA4 | 3/3 | 1 | 2 | 0 | |
| ECA5 | 2/3 | 1 | 0 | 2 | |
| ECA6 | 0/3 | 3 | 0 | 0 | |
| ECA7 | 4/11 | 11 | 0 | 0 | |
| ECA8 | 2/4 | 4 | 0 | 0 | |
| ECA9 | 4/12 | 10 | 1 | 1 | |
| ECA10 | 4/8 | 1 | 7 | 0 | |
| ECA11 | 10/43 | 0 | 0 | 43 | |
| ECB′1 | 184 | 0 | 0 | ||
Putative ecotypes (PEs) identified by ES and their distributions along flow and vertical gradients. Hyphenated numbers indicate subclades within a demarcated PE that contain a dominant allele but were not demarcated as a putative ecotype.
Ratio of dominant allele (DA) number to total number of sequences within a putative ecotype.
Vertical-depth intervals are for PEs indicated only. PEs without vertical-depth intervals could not be identified in gel analysis.
Ecological clusters (ECs) identified by AdaptML and their distributions along flow and vertical gradients.
Microenvironmental characteristics.
The microbial mats at the 60 and 63°C sites both exhibited steep gradients of O2, pH, and irradiance with depth, leading to microenvironmental niche opportunities in the mats (Fig. 4). During midday, when samples for molecular analyses were taken, intense solar irradiance fueled cyanobacterial photosynthesis in the upper mat layers, where high pH (>9) and strong O2 supersaturation were observed in the top 1 mm (Fig. 4, right columns). Maximal O2 concentration, which is indicative of peaks in gross photosynthesis, were found at 0.2 and 0.4 mm below the mat surface at the 60 and 63°C sites, respectively. At 60°C, O2 was fully depleted 2 mm below the mat surface, while O2 penetrated to about 5 mm in the 63°C mat.
Spectral light measurements showed distinct troughs in the transmission spectra corresponding to absorption maxima of chlorophyll a (around 440 and 675 nm) and cyanobacterial phycobiliproteins (especially phycocyanin, which absorbed at around 625 nm) in the upper millimeters of the mat (Fig. 4, center columns). More than 0.5 to 1 mm below the surface of the mat the phycobiliprotein absorption maximum gradually changed to about 600 nm. Light in the visible spectral region driving oxygenic photosynthesis (400 to 700 nm) was depleted to about 1% of the incident irradiance 1 mm below the mat surface in both mats. Light attenuation was highest in the top 0.3 to 0.5 mm, where a peak in O2 concentration and pH was observed. A very strong attenuation was observed between 0.2 and 0.3 mm below the mat surface at the 63°C site, which is indicative of a densely pigmented subsurface cyanobacterial layer. At the 60°C site, light attenuation was somewhat more gradual and was maximal between 0.3 and 0.4 mm below the surface.
DISCUSSION
The identification of the fundamental species-like units within a microbial community is of paramount importance to understanding how evolutionary forces have shaped bacterial lineages and defined their adaptations. Ultimately, these adaptations control the present distributions of species and the contributions they make to the community as a whole. Although many models of species and species-level identification have been developed (7), the stable ecotype model seems to best fit these Synechococcus species populations (31, 32, 33).
Melendrez et al. (23) showed that the number of PEs detected by ES depends on the molecular resolution of the protein-encoding locus used to sample genetic diversity and the fraction of diversity sampled. Melendrez et al. studied 70 variants and included singleton PEs; thus, to compare results from psaA analyses to those of Melendrez et al. (23), we had to reduce the number of sequences analyzed to 70 and include singleton PEs in the analysis (Table 1). In terms of the average evolutionary divergence among the sequence variants studied, psaA offers more molecular resolution than 16S rRNA, ITS, and apcAB (encoding the allophycocyanin alpha and beta subunits) loci, molecular resolution similar to that of the aroA locus, but less molecular resolution than the rbsK (encoding ribokinase) locus (Table 1). The total number of A-like and B′-like PEs predicted by ES using these common conditions (i.e., 70 sequences and allowing singleton PEs) increased from 3 using 16S rRNA, to 8 using the ITS locus, to 10 using the apcAB gene, to 17 using the aroA gene, to 30 using the psaA locus. ES analysis of the rbsK locus, which exhibited significantly more evolutionary divergence, identified 29 ecotypes in the Synechococcus A/B lineage found at 60 and 65°C. The similar number of PEs detected using psaA and rbsK variation indicates that both loci offer sufficient molecular resolution to detect all PEs. However, it is difficult to make this inference for two reasons. First, our analysis of PEs using psaA involved three temperature sites, whereas only two sites were included in the analysis of other loci, and some PEs found at the third temperature (i.e., 63°C) were unique to that site. Second, PEs likely to be contributed by A′-like Synechococcus dominated the 65°C site we studied, whereas they comprised a small proportion of sequences obtained from the 65°C samples collected in 2004 by Melendrez et al. (23). Suspected A′-like sequences were not included in analyses done by Melendrez et al. (23). Differences in population structure at 65°C in 2006 and 2008 (Fig. 3; also see Fig. S3 in the supplemental material) may have been due to the fact that single temperature readings are not indicative of the true range of temperatures at a given sample site (see Fig. S2 in the supplemental material). It also is unclear without deeper sampling whether singleton PEs represent actual ecotypes. Consistent with previous studies (23), the estimates of 0.998 for periodic selection rate (sigma) and of 0.152 for ecotype formation events (omega) indicated a higher rate of periodic selection than ecotype formation, as predicted by the stable ecotype model.
ES analysis, which is based solely on sequence variation, predicted PEs in cases where AdaptML did not because of low habitat variation in the B′-like phylogeny (Fig. 1). For instance, the 12 B′ PEs predicted by ES all were lumped into one EC by AdaptML, because B′-like sequences were found only in the 60°C sample. Also, the inability of AdaptML to discern PEs A8 and A9 and subclades of PE A9 reflects the fact that all sequences in these PEs were obtained only from the 65°C sample. In contrast, given sufficient habitat variation, AdaptML predicted ECs that exhibited too little sequence variation for ES to demarcate as PEs. This is exhibited by the fact that AdaptML predicted four ECs within PE A1, discerning the closely related subclades not demarcated by ES analysis. Clearly, both molecular resolution and habitat variation are important factors for identifying ecological species.
The abrupt shifts of dominant variants of several PEs at the same locations (e.g., at 64 to 65°C and 61 to 62°C in 2006) along the flow path indicate that common molecular adaptations underlie temperature ranges of coexisting species-like populations. These transition zones may represent ecotones (i.e., a transitional zone between two ecological communities, as between a forest and grassland or a river and its estuary) on a microenvironmental scale. These transition zones are apparent along the effluent flow path, indicating that multiple ecotones are present and influence the evolution and ecology of the mat community as a whole.
DGGE distribution analyses along flow and vertical gradients show patterns of variation at a level of molecular resolution higher than that previously attained, but matching variation seen in DGGE gels with ecotypes predicted from the cloned sequences was limited to abundant ecotypes that contain a dominant allele that did not comigrate with other dominant alleles. Ecotypes identified by ES or ECs identified by AdaptML that contain a dominant allele appear to occupy different spatial niches, although many ecotype distributions have overlapping regions where they spatially coexist (Table 2). Overlapping spatial niches also were reported in the studies of Bacillus and marine Vibrio ecological species (8, 14, 18). At lower temperatures the B′-like ecotypes are most abundant and were detected primarily at the top of the mat, which was consistent with previous research conducted with lower resolution loci (24). However, the ability to discern B′-like ecotype distributions was limited, since they were recovered from only one temperature site. The A-like ecotypes were recovered from all three temperature sites, and clusters of sequences identified as ecotypes by ES, subclades with dominant variants, and ECs identified by AdaptML showed different distributions. The vertical analysis of 60 and 63°C samples showed multiple bands in the lower layers, which we hypothesize are associated with closely related PEs or ECs (i.e., PE A1 subclades) containing dominant alleles that could not be differentiated within the whole-mat sample by DGGE due to comigration. We speculate that these deeper populations align with the observed phycobiliprotein absorption maximum shift to about 600 nm in deeper mat layers, specializing to wavelengths not attenuated by other overlying populations. Ecological populations of both A-like and B′-like Synechococcus cyanobacteria are specialized to very fine gradations of temperature (horizontal flow position) and parameters that vary with depth (e.g., light intensity, light quality, and/or chemical gradients).
To achieve increased sampling of diversity across a larger variety of habitats, we are currently examining the use of Ti454 barcode analyses (3, 13), which will also alleviate comigration problems by providing sequence data that discriminate variants based on single nucleotide polymorphism patterns. This will permit the clearer distinction of dominant variants of PE clades, based on much larger numbers of variants observed in a much larger number of habitats, and allow us to determine if the single sequences predicted to be ecotypes represent additional rare, ecologically distinct populations. We also are using barcode analyses to examine the possibility of coexisting PEs that are differently adapted to temporally varying environmental parameters. For instance, cultivated Synechococcus strains A and B′ can only use Fe3+, whereas there is evidence that other mat Synechococcus populations can use Fe2+ (5, 17). These forms of Fe are expected to be available at different times of the day, when the mat is oxic or anoxic. Since spatial cooccurrence does not test whether the members of PEs are ecologically interchangeable, we also are currently conducting population dynamic studies to observe whether or not PE populations change as an ecological unit in response to environmental perturbations. Finally, we are investigating the alternative explanation that horizontal gene exchange caused more than one dominant allele to occur within individual ecological populations (M. M. Melendrez, F. M. Cohan, and D. M. Ward, unpublished data).
Supplementary Material
ACKNOWLEDGMENTS
This research was supported by the National Science Foundation Frontiers in Integrative Biology Research Program (EF-0328698), the National Aeronautics and Space Administration Exobiology Program (NAG5-8807), the Danish Natural Science Research Council (to M.K. and S.I.J.), and the U.S. Department of Energy (DOE) Office of Biological and Environmental Research (BER), as part of BER's Genomic Science Program 395 (GSP). This contribution originates from the GSP Foundational Scientific Focus Area (FSFA) at the Pacific Northwest National Laboratory (PNNL) under contract 112443.
This study was conducted under Yellowstone National Park research permits YELL-0129 and 5494 (D.M.W.) and YELL-02058 (M.K.), and we appreciate the assistance from National Park Service personnel. We also thank Alex Koeppel for his assistance in answering questions and troubleshooting protocols for ecotype simulation, Jason Wood for his optimization of ecotype simulation, Lawrence David for the development of the AdaptML program, and Jane Wiedenbeck for assistance with the interpretation of AdaptML results.
Footnotes
Supplemental material for this article may be found at http://aem.asm.org/.
Published ahead of print on 2 September 2011.
REFERENCES
- 1. Allewalt J. P., Bateson M. M., Revsbech N. P., Slack K., Ward D. M. 2006. Effect of temperature and light on growth of and photosynthesis by Synechococcus isolates typical of those predominating in Octopus Spring microbial mat community of Yellowstone National Park. Appl. Environ. Microbiol. 72:544–550 [DOI] [PMC free article] [PubMed] [Google Scholar]
- 2. Altschul S. F., Gish W., Miller W., Myers E. W., Lipman D. J. 1990. Basic local alignment search tool. J. Mol. Biol. 215:403–410 [DOI] [PubMed] [Google Scholar]
- 3. Andersson A. F., et al. 2008. Comparative analysis of human gut microbiota by barcoded pyrosequencing. PLoS One 3:e2836. [DOI] [PMC free article] [PubMed] [Google Scholar]
- 4. Béjà O., Spudich E. N., Spudicn J. L., Leclerc M., DeLong E. F. 2001. Proteorhodopsin phototrophy in the ocean. Nature 411:786–789 [DOI] [PubMed] [Google Scholar]
- 5. Bhaya D., et al. 2007. Population level functional diversity in a microbial community revealed by comparative genomic and metagenomic analysis. ISME J. 1:703–713 [DOI] [PubMed] [Google Scholar]
- 6. Cohan F. M., Koeppel A., Krizanc D. 2006. Sequence-based discovery of ecological diversity within Legionella, p. 367–376 In Cianciotto N. P., Kwaik Y. A., Edelstein P. H., Fields B. S., Geary D. F., Harrison T. G., Joseph C. A., Ratcliff R. M., Stout J. E., Swanson M. S. (ed.), Legionella: state of the art 30 years after its recognition. ASM Press, Washington, DC [Google Scholar]
- 7. Cohan F. M., Perry E. B. 2007. A systematics for discovering the fundamental units of bacterial diversity. Curr. Biol. 17:R373–R386 [DOI] [PubMed] [Google Scholar]
- 8. Connor N., et al. 2010. Ecology of speciation in the genus Bacillus. Appl. Environ. Microbiol. 76:1349–1358 [DOI] [PMC free article] [PubMed] [Google Scholar]
- 9. Denef V. J., et al. 2010. Proteogenomic basis for ecological divergence of closely related bacteria in natural acidophilic microbial communities. Proc. Natl. Acad. Sci. U. S. A. 107:2383–2390 [DOI] [PMC free article] [PubMed] [Google Scholar]
- 10. Ferris M. J., Muyzer G., Ward D. M. 1996. Denaturing gradient gel electrophoresis profiles of 16S rRNA-defined populations inhabiting a hot spring microbial mat community. Appl. Environ. Microbiol. 62:340–346 [DOI] [PMC free article] [PubMed] [Google Scholar]
- 11. Ferris M. J., Kühl M., Wieland A., Ward D. M. 2003. Cyanobacterial ecotypes in different optical microenvironments of a 68oC hot spring mat community revealed by 16S-23S rRNA internal transcribed spacer region variation. Appl. Environ. Microbiol. 69:2893–2898 [DOI] [PMC free article] [PubMed] [Google Scholar]
- 12. Ferris M. J., Ward D. M. 1997. Season distributions of dominant 16S rRNA-defined populations in a hot spring microbial mat examined by denaturing gradient gel electrophoresis. Appl. Environ. Microbiol. 63:1375–1381 [DOI] [PMC free article] [PubMed] [Google Scholar]
- 13. Hajibabaei M., Singer G. A. C., Clare E. L., Hebert P. D. N. 2007. Design and applicability of DNA arrays and DNA barcodes in biodiversity monitoring. BMC Biol. 5:24. [DOI] [PMC free article] [PubMed] [Google Scholar]
- 14. Hunt D. E., et al. 2008. Resource partitioning and sympatric differentiation among closely related bacterioplankton. Science 320:1081–1085 [DOI] [PubMed] [Google Scholar]
- 15. Jensen S. I., Steunou A.-S., Bhaya D., Kühl M., Grossman A. R. 2011. In situ dynamics of O2, pH and cyanobacterial transcripts associated with CCM, photosynthesis and detoxification of ROS. ISME J. 5:317–328 [DOI] [PMC free article] [PubMed] [Google Scholar]
- 16. Johnson Z. I., et al. 2006. Niche partitioning among Prochlorococcus ecotypes along ocean-scale environmental gradients. Science 311:1737–1740 [DOI] [PubMed] [Google Scholar]
- 17. Klatt C. G., et al. 2011. Community ecology of hot spring cyanobacterial mats: predominant populations and their functional potential. ISME J. 5:1262–1290 [DOI] [PMC free article] [PubMed] [Google Scholar]
- 18. Koeppel A., et al. 2008. Identifying the fundamental units of bacterial diversity: a paradigm shift to incorporate ecology into bacterial systematics. Proc. Natl. Acad. Sci. U. S. A. 105:2504–2509 [DOI] [PMC free article] [PubMed] [Google Scholar]
- 19. Kühl M. 2005. Optical microsensors for analysis of microbial communities. Methods Enzymol. 397:166–199 [DOI] [PubMed] [Google Scholar]
- 20. Liu Z., et al. 2011. Metatranscriptomic analyses of chlorophototrophs of a hot spring microbial mat. ISME J. 5:1279–1290 [DOI] [PMC free article] [PubMed] [Google Scholar]
- 21. Manning S. D., et al. 2008. Variation in virulence among clades of Escherichia coli O157:H7 associated with disease outbreaks. Proc. Natl. Acad. Sci. U. S. A. 105:4868–4873 [DOI] [PMC free article] [PubMed] [Google Scholar]
- 22. Martiny A. C., Tai A. P. K., Veneziano D., Primeau F., Chisholm S. W. 2009. Taxonomic resolution, ecotypes and the biogeography of Prochlorococcus. Environ. Microbiol. 11:823–832 [DOI] [PubMed] [Google Scholar]
- 23. Melendrez M. C., Lange R. K., Cohan F. M., Ward D. M. 2011. Influence of molecular resolution on sequence-based discovery of ecological diversity among Synechococcus populations in an alkaline siliceous hot spring microbial mat. Appl. Environ. Microbiol. 77:1359–1367 [DOI] [PMC free article] [PubMed] [Google Scholar]
- 24. Ramsing N. B., Ferris M. J., Ward D. M. 2000. Highly ordered vertical structure of Synechococcus populations within the one-millimeter-thick photic zone of a hot spring cyanobacterial mat. Appl. Environ. Microbiol. 66:1038–1049 [DOI] [PMC free article] [PubMed] [Google Scholar]
- 25. Smith N. H., Gordon S. V., Rua-Domenech R. de la, Clifton-Hadley R. S., Hewinson R. G. 2006. Bottlenecks and broomsticks: the molecular evolution of Mycobacterium bovis. Nat. Rev. Microbiol. 4:670–681 [DOI] [PubMed] [Google Scholar]
- 26. Soyer Y., Orsi R. H., Rodriguez-Rivera L. D., Sun Q., Wiedmann M. 2009. Genome wide evolutionary analyses reveal serotype specific patterns of positive selection in selected Salmonella serotypes. BMC Evol. Biol. 9:264. [DOI] [PMC free article] [PubMed] [Google Scholar]
- 27. Steunou A.-S., et al. 2008. Regulation of nif gene expression and the energetics of N2 fixation over the diel cycle in a hot spring microbial mat. ISME J. 2:364–378 [DOI] [PubMed] [Google Scholar]
- 28. Tamura K., Dudley J., Nei M., Kumar S. 2007. MEGA4: molecular evolutionary genetics analysis (MEGA) software version 4.0. Mol. Biol. Evol. 24:1596–1599 [DOI] [PubMed] [Google Scholar]
- 29. Walk S. T., Alm E. W., Calhoun L. M., Mladonicky J. M., Whittam T. S. 2007. Genetic diversity and population structure of Escherichia coli isolated from freshwater beaches. Environ. Microbiol. 9:2274–2288 [DOI] [PubMed] [Google Scholar]
- 30. Walk S. T., et al. 2009. Cryptic lineages of the genus Escherichia. Appl. Environ. Microbiol. 75:6534–6544 [DOI] [PMC free article] [PubMed] [Google Scholar]
- 31. Ward D. M. 1998. A natural species concept for prokaryotes. Curr. Opin. Microbiol. 1:271–277 [DOI] [PubMed] [Google Scholar]
- 32. Ward D. M., et al. 2006. Cyanobacterial ecotypes in the microbial mat community of Mushroom spring (Yellowstone National Park, Wyoming) as species-like units linking microbial community composition, structure and function. Philos. Trans. R. Soc. Lond. Ser. B 361:1997–2008 [DOI] [PMC free article] [PubMed] [Google Scholar]
- 33. Ward D. M., Cohan F. M. 2005. Microbial diversity in hot spring cyanobacterial mats: pattern and prediction, p. 185–201 In Inskeep B., McDermott T. (ed.), Geothermal biology and geochemistry in Yellowstone National Park. Thermal Biology Institute, Bozeman, MT [Google Scholar]
- 34. West N. J., Scanlan D. J. 1999. Niche-partitioning of Prochlorococcus populations in a stratified water column in the eastern North Atlantic Ocean. Appl. Environ. Microbiol. 65:2585–2591 [DOI] [PMC free article] [PubMed] [Google Scholar]
- 35. Zhou D., et al. 2004. DNA microarray analysis of genome dynamics in Yersinia pestis: insights into bacterial genome microevolution and niche adaptation. J. Bacteriol. 186:5138–5146 [DOI] [PMC free article] [PubMed] [Google Scholar]
Associated Data
This section collects any data citations, data availability statements, or supplementary materials included in this article.