

Abstract
Background
Nonsteroidal anti-inflammatory drug-activated gene (NAG-1), a divergent member of the transforming growth factor beta superfamily, has been implicated in many cellular processes, including inflammation, early bone formation, apoptosis, and tumorigenesis. Recent clinical studies suggests that a C to G single nucleotide polymorphism at position 6 (histidine to aspartic acid substitution, or H6D) of the NAG-1 protein is associated with lower human prostate cancer incidence. The objective of the current study is to investigate the activity of NAG-1 H6D variant in prostate cancer tumorigenesis in vivo.
Methods
Human prostate cancer DU145 cells expressing the H6D NAG-1 or wild-type NAG-1 were injected subcutaneously into nude mice and tumor growth was monitored. Serum and tumor samples were collected for subsequent analysis.
Results
The H6D variant was more potent than the wild-type NAG-1 and inhibited tumor growth significantly compared to control mice. Mice with tumors expressing the wild-type NAG-1 have greater reduced both body weight and abdominal fat than mice with H6D variant tumors suggesting different activities of the wild-type NAG-1 and the H6D NAG-1. A significant reduction in adiponectin, leptin and IGF-1 serum levels was observed in the tumor bearing mice with a more profound reduction observed with expression of H6D variant. Cyclin D1 expression was suppressed in the tumors with a dramatic reduction observed in the tumor expressing the H6D variant.
Conclusion
Our data suggest that the H6D variant of NAG-1 inhibits prostate tumorigenesis by suppressing IGF-1 and Cyclin D1 expression but likely additional mechanisms are operative.
Keywords: NAG-1/GDF15, H6D, prostate cancer
Introduction
Prostate cancer is the most commonly diagnosed cancer in men in the US aside from skin cancer, and the second most common cause of cancer death among men after colon cancer. In 2010, an estimated 217,730 new cases of prostate cancer were diagnosed in the US, and approximately 32,050 men are expected to die from this disease [1]. Despite the clinical importance of prostate cancer, the multiple interacting mechanisms underlying the development and progression of this disease remain poorly defined. There are several genetic and environmental factors that contribute to the development of prostate cancer, such as age, family history, ethnic background, diet, and lifestyle. More recently, several lines of evidence have linked chronic inflammation to the development of prostate cancer. Genetic studies have suggested that polymorphisms and mutations in genes regulating the inflammatory process might affect the likelihood of developing prostate cancer [2].
Transforming growth factor-beta (TGF-β) superfamily members are multifunctional cell-cell signaling proteins that play pivotal roles in tissue homeostasis and are implicated in carcinogenesis [3]. TGF-β proteins mediate their biological functions through distinct combinations of type I and type II serine/threonine kinase receptors and their downstream effectors, known as Smad proteins [3]. The non-steroidal anti-inflammatory drug activated gene (NAG-1), also known as macrophage inhibitory cytokine-1 (MIC-1), placental bone morphogenetic protein (PLAB), placental transformation growth factor-β (PTGFB), prostate derived factor (PDF) and growth/differentiation factor 15 (GDF15), is a divergent member of the TGF-β superfamily [4]. NAG-1/GDF15 is synthesized as a 65kDa intracellular dimeric precursor, which is cleaved into a 28 kDa dimeric mature protein by furin-like protease, and then released into the circulation [5]. However, neither the receptors to which NAG-1/GDF15 binds to nor the signaling pathways downstream of NAG-1/GDF15, has been identified. Therefore, neither the exact biological activity of NAG-1/GDF15 nor the molecular mechanism responsible for these functions has been well characterized. NAG-1/GDF15 has also been implicated in many other cellular processes, including early bone formation [6], heart failure rescue [7], and fetal development [8]. Many efforts have been made to establish the role of NAG-1/GDF15 during the early and late stages of carcinogenesis. Data from in vitro and in vivo laboratory studies have shown that NAG-1/GDF15 exhibits anti-proliferative, pro-apoptotic and, thus, anti-tumorigenic activities in several cancer cell lines [4]. The NAG-1/GDF15 transgenic mouse developed in our laboratory is resistant to both genetically- and chemically-induced intestinal tumors [9].
NAG-1/GDF15 is highly expressed in the normal human prostate epithelia suggesting a role for NAG-1/GDF15 in prostate homeostasis [6,10]. NAG-1/GDF15 has been shown to induce growth arrest in DU145 human prostate carcinoma cells [10], and to induce apoptosis involving caspase-3 activation in DU145 cells but not to effect proliferation [11]. Forced expression of NAG-1/GDF15 inhibited the proliferation of PC-3 prostate carcinoma cells as well as the growth of xenografted tumors [12]. While laboratory studies suggested an anti- tumorigenic activity of NAG-1/GDF15 that induces growth arrest or apoptosis, clinical studies demonstrated that NAG-1/GDF15 expression is up-regulated in human prostate cancers, suggesting a role in cancer progression [4]. Thus, NAG-1/GDF15 may play an anti-tumorigenic role during the early stages of carcinogenesis, but a pro-tumorigenic one during cancer progression. The exact mechanism of this apparent dichotomy of the role of NAG-1/GDF15 during prostate carcinogenesis is not clear. As in TGF-β, genetic polymorphisms of NAG-1/GDF15 have been described [13]. A common C to G (Exon 2+2423) substitution resulting in histidine to aspartic acid change at codon 202 of the precursor NAG-1 protein which is commonly called H6D because the amino change is at position 6 of the mature NAG-1/GDF15 protein [13]. A large study of 1340 prostate cancer cases and 765 controls in Sweden suggested the G allele (H6D) is associated with decreased risk of developing prostate cancer [14]. A second large study involving 819 cases and 731 controls in Australia had similar findings , although this finding was not statistically significant [15]. However, results from this study also suggest a higher mortality rate from prostate cancer for patients carrying the G allele relative to men with the CC genotype [15]. Similarly, a case control study (506 controls and 506 cases) in the US found that the G allele is marginally associated with a lower prostate cancer incidence, although statistically insignificant [16]. Unfortunately, very limited studies examined the association of the H6D polymorphism of NAG-1/GDF15 with the incidence and progression of other cancer types. To our knowledge, only one study has identified such an association, and found that the H6D NAG-1 is associated with increased risk of colorectal cancer metastasis, but not with increased colorectal cancer risk [17].
Collectively, the above data suggest that NAG-1/GDF15, and in particular, the nonsynonymous variant H6D NAG-1, may play an important role in prostate cancer development and progression. However, in vivo and in vitro evidence is lacking regarding the biological similarities and/or differences of the anti- or pro-tumorigenic activities of NAG-1/GDF15 and its H6D variant. The objective of the current study was to investigate the activity of H6D NAG-1 (the G allele) in prostate cancer tumorigenesis in comparison to the WT NAG-1 (the C allele) with a xenograft mouse model. To our knowledge, we are the first to examine the role of the H6D varianrt of NAG-1/GDF15 in prostate carcinogenesis in an animal model and determine it can suppress prostate tumor growth.
Materials and Methods
Materials
ELISA kits (Human GDF15/NAG-1, mAdiponectin, mLeptin, and mIGF-1) were purchased from R&D Systems (Minneapolis, MN). Polyclonal Cyclin D1, beta-Actin, and anti-rabbit HRP antibodies were obtained from Cell Signaling (Danvers, MA). Antibody against human NAG-1/GDF15 has been described previously [18]. Primary monoclonal antibody against Cyclin D1 (used for immunochemical staining) was purchased from Dako (Carpinteria, CA). Sulforhodamine B-colorimetric (SRB) proliferation assay kit was purchased from Sigma (St. Louis, MO). Apo-ONE Homogeneous Caspase-Glo 3/7 Assay kit was purchased from Promega (Madison, WI). Retroviral pLXIN vector was purchased from Clontech (Mountain View, CA). Lipofectamine 2000 was purchased from Invitrogen (Carlsbad, CA). RNeasy Mini RNA extraction kit and Qiashredder kit were purchased from Qiagen (Valencia, CA). The iScript cDNA synthesis kit was purchased from Bio-Rad (Hercules, CA). Taqman® Gene Expression Assay kits for Cyclin D1 and beta-Actin primers, and Taqman® Universal PCR Mastermix were purchased from Applied Biosystems (Foster City, CA). The bicinchoninic acid (BCA) assay kit was purchased from Pierce (Rockford, IL). The Western LighteningTM Plus-ECL Enhanced Chemiluminescence Substrate assay kit was purchased from PerkinElmer (Waltham, MA).
Generation of WT NAG-1- and H6D NAG-1-expressing DU145 cells
Human prostate DU145 cells were purchased from the American Type Culture Collection (ATCC, VA). The φNX cells were cultured in RPMI medium plus 10% fetal bovine serum and transfected with pLXIN (Clontech) by Lipofectamine 2000 (Invitrogen) according to the manufacturer's protocol. Virus-containing medium was collected from φNX cell cultures three times, 6 h apart, filtered through a 0.45-μm filter, and overlaid onto DU145 cells with 10 μg/ml Polybrene (Sigma). Cultures were maintained with virus-containing medium overnight, and 24 h later cells were shifted to a selection medium containing 500 μg/ml G418. A pool of G418-resistant DU145 cells was infected with virus-containing medium from φNX cells that were transfected with pLXIN-control vector, pLXIN-WT NAG-1 (full length), or pLXIN-H6D NAG-1. Cells were subjected to a selection with 250 μg/ml G418. G418-resistant cells were pooled and used for subsequent experiments. The expression of WT NAG-1 and H6D NAG-1 was confirmed by qRT–PCR, western blot, and sequencing analysis. Cells carrying control vector and different forms of NAG-1/GDF15 were maintained in a humidified atmosphere with 5% CO2 at 37°C in RPMI medium supplemented with 10% fetal bovine serum and 200μg/ml of G418.
SRB proliferation assay
Growth rate of the three stably transfected cell lines was measured by sulforhodamine-B (SRB) proliferation assay according to manufacturer’s instruction (St. Louis, MO). Briefly, cells were seeded in 96-well plates at 1×10⁴ cells/well. After 24 h of cell attachment, cells were incubated for additional 24, 48, or 72 h for proliferation measurement. Incubation at each time point was terminated by replacing the medium with 50% trichloroacetic acid followed by incubation at 4 C for 1 h. Subsequently, the plates were washed four times with water. After being air dried, the plates were stained with 100 μl of 0.4% SRB in 1% acetic acid for 30 min at room temperature. Unbound dye was removed by washing five times with 1% acetic acid. After air-drying and re-solubilization of the protein-bound dye in 10 mM Tris-HCl (pH 8.0), absorbance was read at 565nm on a Synergy HT plate reader from BioTek Instruments (Winooski, VT). All measurements were carried out in triplicate in three independent experiments for each cell line.
Caspase 3/7 enzyme activity
Enzyme activity of capspase 3/7 was analyzed using Apo-ONE homogeneous caspase-Glo 3/7 assay kit (Promega, Madison, WI, USA) according to the manufacturer’s protocol. Briefly, the three cell lines were seeded at 5 ×10⁴/well in 96-well plate. Upon assay (48 h after seeding), a volume of Caspase-Glo 3/7 Reagent equal to the volume of cell culture medium was added to the 96 well plate and incubated at room temperature in the dark for 1 h. The luminescence was measured using a Synergy HT plate reader from BioTek Instruments (Winooski, VT).
In vivo tumor xenograft study
Experiments were performed in accordance with the “NIH Guidelines for the Use and Care of Laboratory Animals” at the National Institute of Environmental Health Sciences (NIEHS) animal facility under an approved animal protocol. All three stably transfected DU145 cells were grown in culture, detached by trypsinization, washed and resuspended in PBS. Athymic (BALB/c, nu/nu) female nude mice were obtained from the Jackson Laboratory (Bar Harbor, Maine). Six-week old nude mice were randomized by weights ranging from 17 to 22 grams into three groups (15 mice/group). DU145 cells (3×10⁶) suspended in 200 μl of PBS carrying control vector, WT NAG-1, or the H6D NAG-1 were injected s.c. into the right flank of the nude mice. All mice were fed autoclaved chow diet and water ad libitum. Each animal was observed and weighed once a week. Palpable tumors were measured in two dimensions (L1, L2) using a digital vernier caliper (0.01 mm) once a week. Tumor volume was calculated using the formula “0.5236 L1 (L2)2”, where L1 and L2 represent the long and short axis of tumor, respectively. Eight weeks after injection, all mice were sacrificed. At necropsy, the xenograft tumor and abdominal fat were carefully excised and weighed. Half of all tumors were fixed in 10% neutral formalin and processed for H&E and immunohistochemical staining. The rest of the tumor tissue was snap frozen in liquid nitrogen and stored at −80 °C for future biological analysis. Terminal blood was collected by cardiac puncture for the analysis of the expression of NAG-1/GDF15and other biomarkers.
ELISA
Blood samples were stored at room temperature for 1 h after collection at necropsy. Mouse serum was isolated using a standard method. Circulating human NAG-1/GDF15and mouse leptin, adiponectin and IGF-1 in the serum were measured by ELISA according to manufacturer’s instruction (R&D Systems).
RNA Extraction and Real-Time PCR
Total RNA was isolated from tumor samples using Qiashredder and RNeasy® Mini kit as described by Qiagen. Both the quantity and quality of total RNA were analyzed by the Agilent Bioanalyzer 2100 system. Total RNA was reverse transcribed with an iScript cDNA synthesis kit. qRT-PCR was performed on an iCycler IQ qRT-PCR detection system (Bio-Rad) using a 1:10 dilution of cDNA with Taqman® gene expression primers and ABI master mix according to the manufacturer's instructions. Beta-Actin was used as the reference gene for all samples.
Western Blot
Total proteins were isolated from xenograft tumors. A total of 40 μg protein was analyzed by electrophoresis on a 4–15% SDS-polyacrylamide Tris-Hcl gel (Bio-Rad) at 170V for 1 h. Separated proteins were transferred onto a PVDF membrane at 100 V for 30 min on ice. After transfer, membranes were blocked with 5% non-fat dry milk in 1× TBST (50Mm Tris pH 7.5, 150 mM NaCl, 0.1% Tween-20) at room temperature for 1 h. The membrane was probed with NAG-1/GDF15 primary antibody as described previously [9]. Cyclin D1 expression in xenograft tumor samples was determined by western blot according to manufacturer’s instruction. The membrane was stripped using Restore Western Blot Stripping Buffer according to manufacturer’s instruction. After stripping, the membrane was re-probed for beta-Actin as a loading control. The signals were detected using the western lightning Plus-ECL enhanced chemiluminescence substrate according to manufacturer’s instruction.
Immunohistochemistry and staining quantification
Immunohistochemical staining was done as described previously [19]. Primary monoclonal antibody against Cyclin D1 was used at a dilution of 1:75 according to manufacturer’s instruction (Dako). After the staining, quantification of Cylcin D1 staining in samples was performed by Image Analysis Core at NIEHS using image analysis (IA) techniques. Slides were digitally scanned on the Scanscope XT (Aperio Technologies, Vista, CA). Using the Pen tool, regions of a defined, fixed size (480 mm2) were randomly selected to cover the entire surface area of the xenografts. Image analysis (IA) was performed using the Aperio IHC Nuclear algorithm on the selected regions. The algorithm measures the area, number of positive-stained nuclei, number of counter-stained nuclei and the total number of nuclei. The percentage of positive-stained nuclei with Cyclin D1 was then calculated by dividing the number of stained nuclei by the total number of nuclei. The mean and standard deviation (SD) was then calculated for each group.
Molecular Modeling
A homology model was developed for WT and H6D mutant forms o human NAG-1/GDF15 using the homology modeling computer program MODELLER [20,21] as implemented in the Accelrys DS 2.5 software package. The model was developed for the mature secreted form of NAG-1/GDF15, after cleavage from the N terminal 196 residues leaving the mature human 112 amino acid protein. The NAG-1/GDF15 human WT sequence was blasted against the PDB (protein databank) sequence database to select template protein structures. The crystal structure coordinates for bone morphogenetic protein -6 (BMP-6) (PDB files: 2QCW, 2R53), and the crystal structure coordinates from bone morphogenetic protein-7 (BMP-7) (PDB files: 1M4U, 1BMP) were employed as templates in the homology modeling of the NAG1 monomer. The matrix from the crystal structure coordinates was used to obtain a model for the NAG-1/GDF15 homodimer.
Statistical Analysis
Comparisons among multiple groups were performed by one-way analysis of variance (ANOVA) with Tukey’s post-hoc comparisons. A p-value of <0.05 was considered statistically significant. All the analyses were performed with the use of SAS Enterprise Guide software (Cary, NC).
Results
Characterization of the cell lines
To study the effects of prostate cancer-derived NAG-1/GDF15 on the development of prostate tumorigenesis, we stably transfected the DU145 cells that are devoid of NAG-1/GDF15 expression with a cDNA encoding the full length wild type NAG-1 or the H6D variant of NAG-1. Expression of NAG-1 was confirmed by Western blot and ELISA. Results from ELISA demonstrated the concentrations of NAG-1/GDF15 in cell cultured medium from WT NAG-1 and H6D NAG-1 DU145 cells, were 17.9 ± 0.9 (SD), and 11.4 ± 1.5 (SD) ng/ml, respectively, after 24 h incubation. We also measured the expression of NAG-1/GDF15 in the cell lysates by Western Blots and found the expression correlated well with the ELISA analysis of secreted NAG-1. As expected, we only detected NAG-1/GDF15 expression in DU145 cells that were stably transfected with the WT or the H6D NAG-1 cDNA, but not in the empty vector control cells (data not shown). To characterize the growth property of the three cell lines, both proliferation and apoptosis were measured in the three stably transfected cell lines. The three DU145 cells stably transfected with control vector, WT NAG-1, and H6D NAG-1 genes at the same initial cell number were incubated for 24, 48, and 72 h followed by SRB assay. We found no differences of the proliferation rate among the three cell lines (Fig. 1A). We further compared apoptosis by measuring Caspase3/7 activity using a fluorescent assay. Similarly, there was no difference in the Caspase3/7 activity among the three cell lines (Fig. 1B). Microscopic observation revealed no differences in cell morphology or density of floating cells in the medium among the cell lines. Thus, there is no difference in the proliferation rate or apoptosis rate among the three stably transected cell lines.
Figure 1. There is no difference in proliferation and apoptosis potential between the three cell lines.
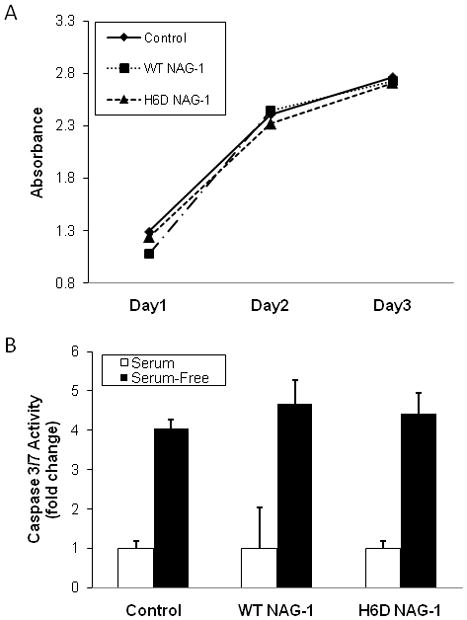
A: SRB proliferation assay demonstrates that the three cell lines, upon equal initial number of cells, had similar rates of proliferation. Cells (1×10⁴/well) were incubated for 24, 48, or 72 h for proliferation measurement (n=3). B: Caspase 3/7 enzyme activity assay demonstrates no difference of apoptosis between the three cell lines (n=3).
H6D NAG-1 significantly inhibits DU145 xenograft growth in athymic nude mice
After characterizing the three stably transfected DU145 cell lines, we examined the tumor inhibitory activity of the wild type NAG-1/GDF15 and the H6D variant of NAG-1/GDF15 in athymic nude mice. The expression of the H6D variant of NAG-1/GDF15 significantly inhibited DU145 xenograft growth and decreased the final tumor volume by 67% (p<0.05) compared to the vector control cells (Fig. 2A). The H6D NAG-1 expressing tumors were significantly smaller than the tumors not expressing NAG-1/GDF15 as observed from wk 4 to wk 8. In contrast, the volume of the tumors expressing the WT NAG-1 was slightly, but not significantly, reduced compared to the control tumors (Fig. 2A). In addition, the H6D NAG-1 significantly reduced the final tumor weight by 59% compared to the control tumors (Fig. 2B). However, the WT NAG-1 tumors were only slightly smaller but not significantly reduced in final tumor weight. Thus, the expression of the H6D variant protein caused a dramatic reduction in tumor growth whereas the wild type NAG-1 protein appeared to weakly inhibit the growth of the xenografts. NAG-1/GDF15 is secreted protein present in human blood and the concentrations are frequently increased in cancer and other diseases [4,22]. The serum concentrations of hNAG-1/GDF15 and the variant protein were measured by an ELISA assay. The concentration of the wild type protein was approximately 3–4 times higher than the levels of the variant protein (Fig. 2C). The wild type NAG-1/GDF15 and variant expressing cells secreted similar concentration of the mature dimer into the media when growing in culture. The serum concentrations of NAG-1/GDF15 proteins in the mice with tumors appear to be directly proportional to the weight of the tumors. R2 equals to 0.89 according to a linear regression model that calculated by Excel (Fig. 2D). Thus, the levels of circulating NAG-1/GDF15 in blood correlated with tumor sizes of the WT NAG-1 mice and the H6D NAG-1 mice.
Figure 2. The H6D variant of NAG-1/GDF15 significantly inhibited DU145 xenograft tumor growth in vivo.
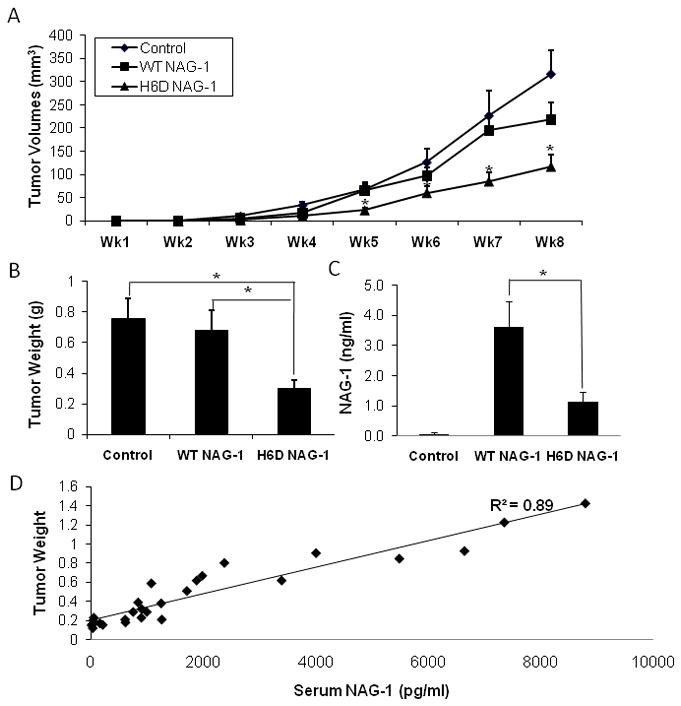
A: Xenograft tumor growth measured by volume. DU145 cells (3×10⁶) carrying control vector, wild type GDF15/NAG-1, or the H6D variant were injected s.c. into nude mice (n=15 per group). Tumor growth was recorded by measuring the dimensions of tumors and presented as volume (mm3) every week for 8 wks. * p<0.05. B: Tumor weight (g) at necropsy. * p<0.01. C: Serum level of GDF15/NAG-1 (ng/ml). At necropsy, serum was collected and the circulating serum level of NAG-1/GDF15 was measured by ELISA. Data in control samples represent the background value. * p<0.01. All data are presented as mean ± SE (standard error) (n=15). D: Linear regression model indicates that the serum level of NAG-1/GDF15 (wild type or H6D) correlates with tumor sizes in WT NAG-1 and H6D NAG-1 mice. R2=0.89.
The wild type NAG-1/GDF15 significantly reduced body and abdominal fat weight of the athymic nude mice
Previously, we reported that the body weight of the NAG-1/GDF15 transgenic mice, which overexpress the human wild type NAG-1/GDF15 gene, is significantly reduced compared to the wild type littermates [9]. We examined whether the body weight and abdominal fat was decreased in the mice bearing WT NAG-1 and/or H6D NAG-1 xenografts compared to control mice that have no circulating hNAG-1/GDF15. Interestingly, the rate of body weight increase in the WT NAG-1 and H6D NAG-1 expressing mice was significantly reduced in comparison to the control mice (Fig. 3A). In addition, the abdominal fat content was significantly lowered in the mice expressing WT NAG-1 and H6D NAG-1 proteins as compared to the control mice (Fig. 3B, C). However, the wild type NAG-1/GDF15 was more effective in lowering both the body weight and fat content of the nude mice than the H6D variant of NAG-1 (Fig. 3). The changes in body weight and abdominal fat may be a reflection of the different serum concentrations of NAG-1/GDF15 protein and its variant but could also suggest that the wild type NAG-1/GDF15 and the H6D variant of NAG-1/GDF15 have different biological functions. The wild type NAG-1/GDF15 may play a more important role in the inhibition of the increase of body weight and abdominal fat weight than the H6D NAG-1.
Figure 3. The wild type GDF15/NAG-1 most significantly reduced body weight and abdominal fat weight of the nude mice.
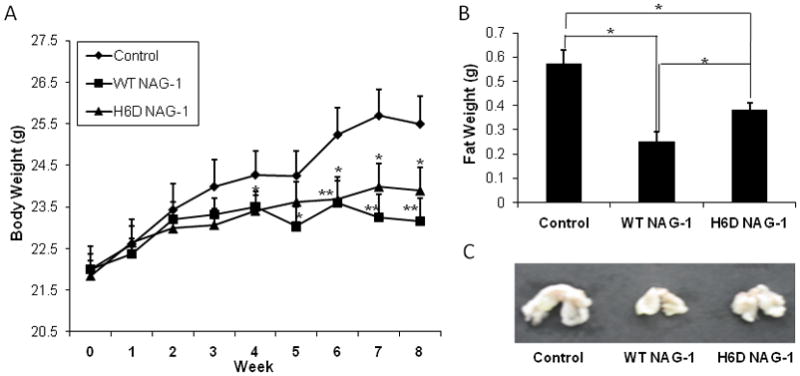
A: Body weight (g) changes of mice during experiment were measured for 8 wks. * p<0.05; ** p<0.01. B: Weight of abdominal fat (g) was measured at necropsy. * p<0.05; ** p<0.01. C, Representative image of the mean weight of abdominal fat from each group. All data are presented as mean ± SE (n=15).
H6D variant of NAG-1/GDF15 significantly reduced serum leptin and adiponectin levels
Adipokines are either pro- or anti-inflammatory cytokines primarily synthesized in adipose tissue [23]. Leptin and adiponectin are two major adipokines. Leptin level is positively related with fat content while the level of adiponectin is negatively related with fat content [24]. Due to the reduction of abdominal fat in the nude mice bearing tumors expressing WT NAG-1 or H6D NAG-1, we measured the serum levels of mouse leptin and adiponectin by ELISA. The levels of leptin were significantly reduced in the mice with tumors expressing WT NAG-1 or H6D NAG-1 compared to the control mice (Fig. 4A, 4B). Interestingly, leptin levels were more significantly reduced in the nude mice expressing H6D NAG-1. The serum adiponectin level was also significantly reduced in the H6D NAG-1-expressing mice compared to the control mice, but less reduction was observed in mice expressing the WT NAG. Thus, the reduction in leptin and adiponectin serum levels does not correlate with the reduction in adipose tissue in the NAG-1/GFD15 tumor bearing mice suggesting a direct effect on the expression of these two cytokines by the NAG-1 proteins.
Figure 4. The serum level of mLeptin, mAdiponectin, and mIGF-1 were most significantly reduced in H6D of NAG-1 group.
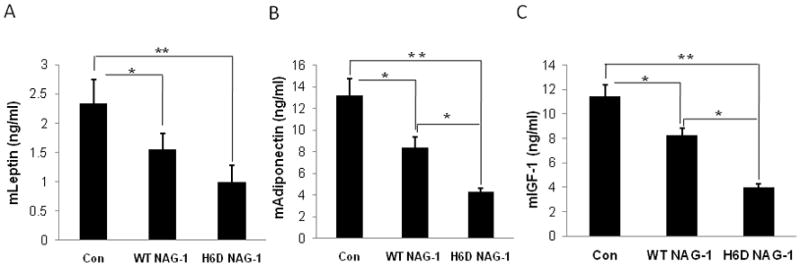
At necropsy, serum samples were collected and subjected to ELISA for the analysis of serum level of mLeptin, mAdiponectin, and mIGF-1. All data are presented as mean ± SE (n=15). * p<0.05; ** p<0.01.
Because the reduction of leptin and adiponectin in the H6D NAG-1-expressing DU145 xenograft mice correlates with tumor reduction, we examined the downstream molecular pathways of leptin and adiponectin in the xenograft tumors and serum. However, molecular targets including VEGF, CD34, Glut4, AMPK, STAT3, P38, and inflammatory cytokines TNF-α, and IL1-β were not different among the three tumor groups (data not shown). In addition, treating DU145 cells in culture with recombinant leptin or adiponectin did not alter DU145 cell proliferation or apoptosis (data not shown). These results suggest that the reduced levels of leptin and adiponectin may not play a role in tumor inhibition by the variant protein.
The H6D variant of NAG-1/GDF15 significantly reduced serum IGF-1 levels
Insulin-like growth factor-1 (IGF-1) is a mitogen for prostate epithelial cells. IGF-1 is a potent stimulator of prostate cancer cell growth, and its signaling cascade is involved in prostate carcinogenesis [25]. In addition, IGF-1 has mitogenic activity in DU145 cells in vitro [26]. Clinical studies reveal that elevated serum IGF-1 level is associated with an increased risk of prostate cancer [27,28]. Interestingly, serum mIGF-1 level was significantly reduced 3-fold (11.3 ± 0.9 vs. 3.6 ± 0.3 ng/ml) in the nude mice expressing H6D NAG-1 compared to the control vector mice (Fig. 4C). IGF-1 level was also significantly reduced in the mice expressing WT NAG-1 compared to control mice, but to a lesser extent (11.3 ± 0.9 vs. 8.1 ± 0.6 ng/ml). Our data suggest the H6D variant of NAG-1 may inhibit tumor growth through the inhibition of IGF-1 production.
The H6D variant of NAG-1 reduced Cyclin D1 level in the DU145 xenograft
We next examined the mitotic and apoptotic indices of the tumor samples histologically. The mitotic index is slightly different (14.6, 12.3 and 11.6 in the control, WT NAG-1 and H6D NAG-1 groups, respectively), but not at a significant level. The apoptotic index in the three groups is 11.6, 11.8, and 12.0 respectively, indicating no difference among the groups. In addition, there was no significant difference in necrosis or lymphocytic infiltration among the groups, as determined by histological analysis (data not shown). Cyclin D1 is a key regulator of the G1 phase progression of the cell cycle. Overexpression of Cyclin D1 has been related to the tumorigenesis of prostate cancer [29]. Since Cyclin D1 is highly expressed in DU145 cells and is a potential target for prostate cancer chemoprevention by many agents [30], we measured Cyclin D1 expression. Although there are no differences in proliferative and apoptotic indices determined by histological examination, we found that Cyclin D1 expression was significantly reduced in xenograft tumors isolated from H6D NAG-1 tumor bearing mice at both mRNA and protein level as determined by qRT-PCR, Western Blot, and immunohistochemistry methods, respectively (Fig. 5A, B, C). This reduction in expression correlates with reduction in tumor growth. Neither the mRNA nor the protein level of Cyclin D1 was significantly different from the WT NAG-1 tumor bearing mice compared to control mice. Our data suggest that the H6D variant of NAG-1 may inhibit tumor growth also through the inhibition of Cyclin D1 expression.
Figure 5. The expression of Cyclin D1 was inhibited in xenograft samples from the H6D of GDF15/NAG-1 mice.
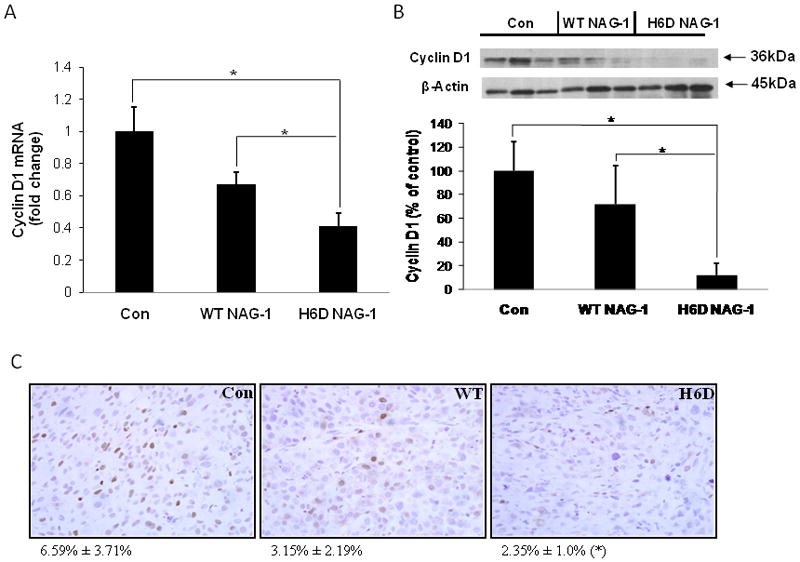
A: mRNA level of Cyclin D1 in the xenograft tumors. Total RNA was extracted and Cyclin D1 expression was analyzed by qRT-PCR. Beta-Actin was used as control. All data are presented as SE ± SD (n=15). * p<0.05. B: Western blot of Cyclin D1 expression in the xenograft tumors. Total protein was extracted from three randomly selected xenograft tumor samples of each experimental group. Cell lysates were examined for Cyclin D1 expression by western blot analysis. Beta-Actin was used for loading control. Relative expression level of Cyclin D1 was analyzed by densitometric method. All data are presented as mean ± SD (n=3). * p<0.05. C: Immunohistochemical staining of Cyclin D1 in xenograft tumor samples (40×). The quantification of Cyclin D1 staining was analyzed by Image Analysis Core at NIEHS using image analysis techniques. Data is represented as % positive nuclei staining ± SD (n=6). * p<0.05 compared to control.
Discussion
Despite strong evidence linking NAG-1/GDF15 to prostate cancer, differences between NAG-1/GDF15 and its H6D variant, their importance in prostate cancer development and the underlying molecular mechanisms by which these proteins influence tumor development are not well understood. In this study, we attempt to address some of these questions by using prostate cancer cells designed to express the wild type and variant NAG-1 proteins and by studying their growth in a nude mouse xenograft model. Our findings clearly demonstrate that the H6D NAG-1 protein variant dramatically inhibited DU145 prostate xenograft growth, while WT NAG-1 only slightly inhibited tumor growth and is the first study to demonstrate an anti-tumorigenic activity of the H6D NAG-1 variant in an animal model. Our results are in agreement with clinical data showing the H6D NAG-1 polymorphism is associated with a reduced risk of developing prostate cancer. Furthermore, in tumors expressing the H6D variant a reduction in the expression of IGF-1 and a decrease in the expression of Cyclin D1 were observed while only a modest changes were observed in the tumors expressing the wild-type protein. This finding coupled with the reduction in IGF-1 provides rational mechanisms for the inhibition of tumor growth by NAG-1/GDF15 variant in the nude mouse model.
The results present in this report and the investigations with the NAG-1 transgenic mouse point to an antitumorigenic role for NAG-1/GDF15. However, a substantial number of clinical studies report increased serum NAG-1/GDF15 levels with the progression of several cancer types to metastasis [31]. Increasing serum NAG-1/GDF15 levels are associated with the progression of metastatic prostate cancer [22,32] and some in vitro experiment suggest a pro-tumorigenic role for NAG-1/GDF15. Indeed, such apparently contradictory effects on tumor growth and development are typical for many members of the TGF-β superfamily [33]. Tumor progression is often associated with accumulated genetic alterations that can change responses to activation of signaling pathways. This apparent dichotomy in NAG-1/GDF15 during prostate cancer carcinogenesis has not been adequately explained and raises the possibility that NAG-1/GDF15 plays distinctly different roles at different stages of tumor progression. More recent studies suggest that this is very likely a function of the tumor stage, immune status, and the interaction of the tumor with its local microenvironment [17]. An interesting finding from this study is that tumor weight correlates with the circulating levels of NAG-1/GDF15. A likely explanation is the NAG-1/GDF15 serum level is proportional to cell number/tumor size. NAG-1/GDF15 may play a more important tumor suppressing role during the early stage of tumorigenesis. However, as the tumor progress it is no longer under the control of NAG-1/GDF15 and serum levels increase as the number of tumor cells increase. Alternatively, subsets of tumor cells are not inhibited by NAG-1/GDF15 expand, yielding larger tumors and increased total expression of NAG-1/GDF15. Results from recent clinical data suggest that the H6D NAG-1 may be associated with a high mortality rate in prostate cancer [15] and an increased risk of colorectal cancer metastasis [17]. Although we observed that the H6D NAG-1 significantly reduced the DU145 xenograft tumor growth, it is possible at a more advanced tumor stage the H6D NAG-1 can become pro-tumorigenic. However, we were unable to study the effects of H6D NAG-1 on metastasis in the DU145 xenograft model, as DU145 cells does not metastasize to any significant extent in the nude mice [34].
Previously, we have shown that the human wild-type protein expressed in NAG-1/GDF15 transgenic mice inhibited both genetically- and chemically-induced colorectal tumorigenesis [9]. NAG-1/GDF15 transgenic mice have significantly reduced body weight and lower total abdominal fat compared to the wild type littermates. In the current study, we found a similar effect in the nude mice carrying NAG-1/GDF15 expressing tumors. We observed a significant reduced body weight and abdominal fat weight compared to control mice. Strikingly, mice with the WT NAG-1 expressing tumors showed a greater reduced body weight and fat content compared to the mice with the H6D variant of, suggesting a difference between the two proteins on altering body weight and abdominal fat content. Thus, the wild type protein appears to have a more dramatic effect on body weight and abdominal fat content than the H6D variant, but the H6D variant had a more potent effect on inhibition of tumorigenesis in the DU145 xenograft model.
Adipose tissue produces and releases a variety of pro-inflammatory and anti-inflammatory factors, including the adipokines leptin, adiponectin, resistin, and visfatin, as well as cytokines and chemokines, such as TNF-alpha, IL-6, monocyte chemoattractant protein 1 (MCP-1), and others [35,36]. Leptin and adiponectin are the most extensively studied adipokines. The major factor influencing plasma leptin concentration is adipose tissue mass. Numerous studies reported a positive role of leptin acting as mitogen/survival factor during cancer development and progression [37]. In particular, leptin has been shown to have an important carcinogenic effects during prostate cancer tumorigenesis [38,39]. In contrast, circulating adiponectin levels in humans are in general inversely related with body fat [40]. Compared to leptin, the role of adiponectin in carcinogenesis is not well known. In the current study, we found that the plasma levels of leptin and adiponectin are significantly reduced by the H6D NAG-1 in the nude mice but we did not find differences in the leptin and adiponectin signaling pathways in the tumors suggesting the inhibition of tumor growth may not be mediated by these cytokines. In mice with the WT NAG-1 tumors, a more significant reduced abdominal fat content was observed compared to mice bearing H6D NAG-1 expressing tumors or the control mice. However, only marginally reduced leptin and adiponectin levels were detected in these mice while in the mice with H6D NAG-1 expressing tumors a more robust reduction in leptin and adiponectin expression was found. Our data suggest that the H6D variant of NAG-1/GDF15 may directly regulate circulating leptin and adiponectin levels. At present, we are not sure whether body weight and fat content reduction and the lower levels of adipokines contribute to the inhibition of tumor growth by the H6D NAG-1 or the WT NAG-1 in DU145 xenograft model. Nevertheless, the biological significance and mechanisms involved in modulation of body weight and fat content by the wild type NAG-1/GDF15 need to be addressed in future studies.
Although our data show that the H6D variant of NAG-1/GDF15 has a more potent anti-tumorigenic activity in suppressing DU145 xenograft growth compared to the WT NAG-1, the molecular mechanisms responsible for this activity are not fully understood. Although H6D variant suppressed both leptin and/or adiponectin, we could not establish a link to tumor inhibition because the molecular pathways of the downstream of leptin and/or adiponectin signaling were not altered in the xenografts. The wild type NAG-1/GDF15 causes induction of apoptosis via both p53-dependent and p53-independent mechanisms [4]. NAG-1/GDF15 induced a loss of adhesion and induced apoptosis in DU145 cells mediated by a reduction in the expression of antiapoptotic gene metallothionein 1E and genes RhoE and catenin δ1 [11] but changes in apoptosis was not detected in the xenografts. Graichen et al. reported that NAG-1/GDF15 inhibits the expression of the cell cycle regulator Cyclin D1 oncogene that promotes mammary carcinoma cell growth [41]. In this study only the H6D variant of NAG-1/GDF15, and not the WT NAG-1, significantly reduced Cyclin D1 mRNA and protein expression in the xenograft tumor samples. The changes in the expression of Cyclin D1 correlated with the reduction of tumor xenograft growth.
IGF-1 is a well-known survival factor for both normal and malignant cells in many tissues, including the prostate [42]. IGF-1 stimulates the proliferation of human prostate epithelial cells in vitro and is necessary for normal growth and development of the rat and mouse prostate [43]. The association between serum circulating IGF-1 and prostate cancer risk is well established [43,44], and other studies have implicated the IGF-1 signaling network in the early stages of prostate carcinogenesis [25,27]. IGF-1 expression is increased during prostate cancer development in the prostate basal epithelial layer of the transgenic adenocarcinoma of mouse prostate (TRAMP) model that is similar to human disease [45]. Thus, IGF-1 appears to be important for prostate cancer initiation. In this study, the H6D variant of NAG-1/GDF15 inhibited DU145 xenograft tumor growth and reduced plasma IGF-1 level to a greater extent than the WT NAG-1 in comparison to the control vector. Thus, the H6D variant of NAG-1 may inhibit DU145 xenograft tumor growth by a lowering circulating IGF-1 production in vivo. Results from this study provide two possible mechanisms for the inhibition of tumor growth by the H6D variant protein; the lower expression of Cyclin D1 and the lower levels of IGF-1.
Why does the change of a single amino acid from basic histidine (H) to aspartic acid (D) cause these changes in biological activity? The H to D substitution is close to the typical RXXR cleavage site and could alter the formation of the mature dimer from the dimeric precursor of NAG-1/GDF15 but there is no evidence for this on examination of NAG-1/GDF15 formation in the cell expressing the wild-type or variant (data not shown). This H to D change is at the close proximity to the critical stabilizing cysteine residue at position 7 which may play an important role in NAG-1/GDF15 stability and therefore may affect its function [33]. We have modeled the molecular structure of the H6D NAG-1 in comparison to WT NAG-1 based on the solved crystal structure of BMP6 [46–48]. NAG-1/GDF15 most likely has the characteristic “butterfly” protein fold and the cysteine knot structure characteristic of the TGF-β superfamily [49]. The substitution occurs at the sixth amino acid from the N-terminal end of the secreted mature NAG-1/GDF15 protein and could potentially affect its interaction with the type I and type II receptors of the TGF-β pathway. In the structure of a BMP ligand-receptor complex, (dimeric BMP2 in complex with the BMP receptor IA extracellular domain), the N-terminal amino acids of the BMP ligand are at the interface between the ligand and receptor, and interact with loop 1 of the type I receptor [50]. The volume change and conversion from a positive to a negative charge between the histidine and aspartic residues are likely to alter the chemical and structural properties of this binding interface and therefore interactions with Type I receptors. These structural differences could ultimately alter the NAG-1/GDF15 signaling pathway interactions and thus may elicit a different role in prostate cancer development and progression.
Conclusion
In summary, we are the first to show that the H6D variant of NAG-1/GDF15 and the wild type NAG-1/GDF15 may have different biological activities. The H6D NAG-1 is an excellent inhibitor of prostate tumor growth as investigated with mouse xenograft model, while the WT NAG-1 protein has a more dramatic effect on reducing body weight and abdominal fat. The variant protein also suppresses the expression of IGF-1 and Cyclin D1, a finding that provides a suitable mechanism for the inhibition of xenograft tumor growth. However, for a better understanding of the H6D NAG-1 and the WT NAG-1 in prostate cancer carcinogenesis and other physiological molecular pathways further studies are required. Identification of the signaling pathway of NAG-1/GDF15 and characterization of the NAG-1/GDF15 receptor may provide clues to these problems. How these changes in WT NAG-1 and H6D NAG-1 expression and functions, and the role the two protein plays at different stages of prostate tumor progression, remain to be determined.
Figure 6. Model of WT Human NAG-1 (GDF15) (blue) compared with H6D mutant Human NAG-1(red).
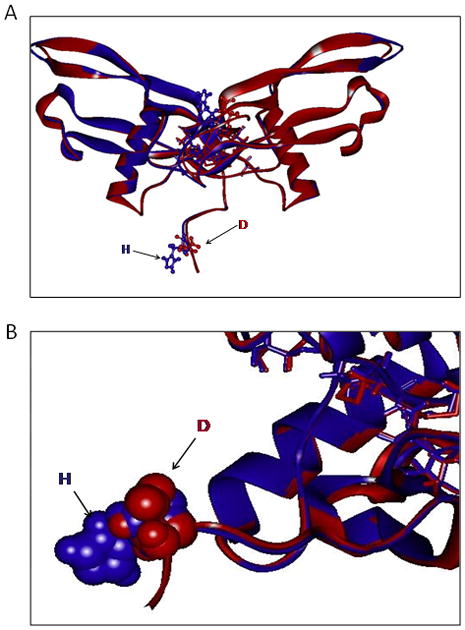
The modeled NAG-1structure is based largely on the solved crystal structure of BMP6 (PDB: 2QCW,2R53) with which NAG-1 shares 34% sequence identity and 53% sequence similarity, also based on crystal structures of BMP7 (33% sequence identity; 52% similarity) and GDF5 (28% identity; 52% similarity). The difference in size between the N-terminal basic positively charged histidine residue in the wildtype is contrasted with the Smaller, acidic negatively charged mutant aspartic acid.
Acknowledgments
We thank Dr. Gordon Flake (NIEHS) for analyzing pathology primarily apoptosis and mitosis indexes of the xenograft tissues. We thank Julie Foley and Norris Flagler at the NIEHS Image Analysis Core for performing quantification analysis of Cyclin D1 immunohistochemical staining. We thank Dr. Paul Wade and Dr. John Roberts (NIEHS) for their critical reading of this manuscript. This research was supported by the intramural Research Program of the NIH, National Institute of Environmental Health Sciences.
References
- 1.Cancer Facts and Figures. 2010. [Google Scholar]
- 2.De Marzo AM, Platz EA, Sutcliffe S, Xu J, Gronberg H, Drake CG, Nakai Y, Isaacs WB, Nelson WG. Inflammation in prostate carcinogenesis. Nature reviews. 2007;7(4):256–269. doi: 10.1038/nrc2090. [DOI] [PMC free article] [PubMed] [Google Scholar]
- 3.Piek E, Heldin CH, Ten Dijke P. Specificity, diversity, and regulation in TGF-beta superfamily signaling. Faseb J. 1999;13(15):2105–2124. [PubMed] [Google Scholar]
- 4.Eling TE, Baek SJ, Shim M, Lee CH. NSAID activated gene (NAG-1), a modulator of tumorigenesis. J Biochem Mol Biol. 2006;39(6):649–655. doi: 10.5483/bmbrep.2006.39.6.649. [DOI] [PubMed] [Google Scholar]
- 5.Bauskin AR, Zhang HP, Fairlie WD, He XY, Russell PK, Moore AG, Brown DA, Stanley KK, Breit SN. The propeptide of macrophage inhibitory cytokine (MIC-1), a TGF-beta superfamily member, acts as a quality control determinant for correctly folded MIC-1. The EMBO journal. 2000;19(10):2212–2220. doi: 10.1093/emboj/19.10.2212. [DOI] [PMC free article] [PubMed] [Google Scholar]
- 6.Paralkar VM, Vail AL, Grasser WA, Brown TA, Xu H, Vukicevic S, Ke HZ, Qi H, Owen TA, Thompson DD. Cloning and characterization of a novel member of the transforming growth factor-beta/bone morphogenetic protein family. The Journal of biological chemistry. 1998;273(22):13760–13767. doi: 10.1074/jbc.273.22.13760. [DOI] [PubMed] [Google Scholar]
- 7.Xu J, Kimball TR, Lorenz JN, Brown DA, Bauskin AR, Klevitsky R, Hewett TE, Breit SN, Molkentin JD. GDF15/MIC-1 functions as a protective and antihypertrophic factor released from the myocardium in association with SMAD protein activation. Circulation research. 2006;98(3):342–350. doi: 10.1161/01.RES.0000202804.84885.d0. [DOI] [PubMed] [Google Scholar]
- 8.Moore AG, Brown DA, Fairlie WD, Bauskin AR, Brown PK, Munier ML, Russell PK, Salamonsen LA, Wallace EM, Breit SN. The transforming growth factor-ss superfamily cytokine macrophage inhibitory cytokine-1 is present in high concentrations in the serum of pregnant women. The Journal of clinical endocrinology and metabolism. 2000;85(12):4781–4788. doi: 10.1210/jcem.85.12.7007. [DOI] [PubMed] [Google Scholar]
- 9.Baek SJ, Okazaki R, Lee SH, Martinez J, Kim JS, Yamaguchi K, Mishina Y, Martin DW, Shoieb A, McEntee MF, Eling TE. Nonsteroidal anti-inflammatory drug-activated gene-1 over expression in transgenic mice suppresses intestinal neoplasia. Gastroenterology. 2006;131(5):1553–1560. doi: 10.1053/j.gastro.2006.09.015. [DOI] [PubMed] [Google Scholar]
- 10.Tan M, Wang Y, Guan K, Sun Y. PTGF-beta, a type beta transforming growth factor (TGF-beta) superfamily member, is a p53 target gene that inhibits tumor cell growth via TGF-beta signaling pathway. Proceedings of the National Academy of Sciences of the United States of America. 2000;97(1):109–114. doi: 10.1073/pnas.97.1.109. [DOI] [PMC free article] [PubMed] [Google Scholar]
- 11.Liu T, Bauskin AR, Zaunders J, Brown DA, Pankhurst S, Russell PJ, Breit SN. Macrophage inhibitory cytokine 1 reduces cell adhesion and induces apoptosis in prostate cancer cells. Cancer research. 2003;63(16):5034–5040. [PubMed] [Google Scholar]
- 12.Lambert JR, Kelly JA, Shim M, Huffer WE, Nordeen SK, Baek SJ, Eling TE, Lucia MS. Prostate derived factor in human prostate cancer cells: gene induction by vitamin D via a p53-dependent mechanism and inhibition of prostate cancer cell growth. Journal of cellular physiology. 2006;208(3):566–574. doi: 10.1002/jcp.20692. [DOI] [PubMed] [Google Scholar]
- 13.Fairlie WD, Russell PK, Wu WM, Moore AG, Zhang HP, Brown PK, Bauskin AR, Breit SN. Epitope mapping of the transforming growth factor-beta superfamily protein, macrophage inhibitory cytokine-1 (MIC-1): identification of at least five distinct epitope specificities. Biochemistry. 2001;40(1):65–73. doi: 10.1021/bi001064p. [DOI] [PubMed] [Google Scholar]
- 14.Lindmark F, Zheng SL, Wiklund F, Bensen J, Balter KA, Chang B, Hedelin M, Clark J, Stattin P, Meyers DA, Adami HO, Isaacs W, Gronberg H, Xu J. H6D polymorphism in macrophage-inhibitory cytokine-1 gene associated with prostate cancer. Journal of the National Cancer Institute. 2004;96(16):1248–1254. doi: 10.1093/jnci/djh227. [DOI] [PubMed] [Google Scholar]
- 15.Hayes VM, Severi G, Southey MC, Padilla EJ, English DR, Hopper JL, Giles GG, Sutherland RL. Macrophage inhibitory cytokine-1 H6D polymorphism, prostate cancer risk, and survival. Cancer Epidemiol Biomarkers Prev. 2006;15(6):1223–1225. doi: 10.1158/1055-9965.EPI-06-0063. [DOI] [PubMed] [Google Scholar]
- 16.Cheng I, Krumroy LM, Plummer SJ, Casey G, Witte JS. MIC1 and IL1RN genetic variation and advanced prostate cancer risk. Cancer Epidemiol Biomarkers Prev. 2007;16(6):1309–1311. doi: 10.1158/1055-9965.EPI-07-0165. [DOI] [PubMed] [Google Scholar]
- 17.Brown DA, Ward RL, Buckhaults P, Liu T, Romans KE, Hawkins NJ, Bauskin AR, Kinzler KW, Vogelstein B, Breit SN. MIC-1 serum level and genotype: associations with progress and prognosis of colorectal carcinoma. Clin Cancer Res. 2003;9(7):2642–2650. [PubMed] [Google Scholar]
- 18.Baek SJ, Kim KS, Nixon JB, Wilson LC, Eling TE. Cyclooxygenase inhibitors regulate the expression of a TGF-beta superfamily member that has proapoptotic and antitumorigenic activities. Mol Pharmacol. 2001;59(4):901–908. [PubMed] [Google Scholar]
- 19.Klein RD, Van Pelt CS, Sabichi AL, Dela Cerda J, Fischer SM, Furstenberger G, Muller-Decker K. Transitional cell hyperplasia and carcinomas in urinary bladders of transgenic mice with keratin 5 promoter-driven cyclooxygenase-2 overexpression. Cancer research. 2005;65(5):1808–1813. doi: 10.1158/0008-5472.CAN-04-3567. [DOI] [PubMed] [Google Scholar]
- 20.Eswar N, Webb B, Marti-Renom MA, Madhusudhan MS, Eramian D, Shen MY, Pieper U, Sali A. Comparative protein structure modeling using Modeller. In: Baxevanis Andreas D, et al., editors. Current protocols in bioinformatics / editoral board. Unit 5. Chapter 5. 2006. p. 6. [DOI] [PMC free article] [PubMed] [Google Scholar]
- 21.Marti-Renom MA, Stuart AC, Fiser A, Sanchez R, Melo F, Sali A. Comparative protein structure modeling of genes and genomes. Annual review of biophysics and biomolecular structure. 2000;29:291–325. doi: 10.1146/annurev.biophys.29.1.291. [DOI] [PubMed] [Google Scholar]
- 22.Mimeault M, Batra SK. Divergent molecular mechanisms underlying the pleiotropic functions of macrophage inhibitory cytokine-1 in cancer. Journal of cellular physiology. 224(3):626–635. doi: 10.1002/jcp.22196. [DOI] [PMC free article] [PubMed] [Google Scholar]
- 23.Baker R, Dauner JG, Rodriguez AC, Williams MC, Kemp TJ, Hildesheim A, Pinto LA. Increased plasma levels of adipokines and inflammatory markers in older women with persistent HPV infection. Cytokine. 53(3):282–285. doi: 10.1016/j.cyto.2010.11.014. [DOI] [PMC free article] [PubMed] [Google Scholar]
- 24.van Kruijsdijk RC, van der Wall E, Visseren FL. Obesity and cancer: the role of dysfunctional adipose tissue. Cancer Epidemiol Biomarkers Prev. 2009;18(10):2569–2578. doi: 10.1158/1055-9965.EPI-09-0372. [DOI] [PubMed] [Google Scholar]
- 25.Papatsoris AG, Karamouzis MV, Papavassiliou AG. Novel insights into the implication of the IGF-1 network in prostate cancer. Trends in molecular medicine. 2005;11(2):52–55. doi: 10.1016/j.molmed.2004.12.005. [DOI] [PubMed] [Google Scholar]
- 26.Putz T, Culig Z, Eder IE, Nessler-Menardi C, Bartsch G, Grunicke H, Uberall F, Klocker H. Epidermal growth factor (EGF) receptor blockade inhibits the action of EGF, insulin-like growth factor I, and a protein kinase A activator on the mitogen-activated protein kinase pathway in prostate cancer cell lines. Cancer research. 1999;59(1):227–233. [PubMed] [Google Scholar]
- 27.Nam RK, Trachtenberg J, Jewett MA, Toi A, Evans A, Emami M, Narod SA, Pollak M. Serum insulin-like growth factor-I levels and prostatic intraepithelial neoplasia: a clue to the relationship between IGF-I physiology and prostate cancer risk. Cancer Epidemiol Biomarkers Prev. 2005;14(5):1270–1273. doi: 10.1158/1055-9965.EPI-04-0430. [DOI] [PubMed] [Google Scholar]
- 28.Roddam AW, Allen NE, Appleby P, Key TJ, Ferrucci L, Carter HB, Metter EJ, Chen C, Weiss NS, Fitzpatrick A, Hsing AW, Lacey JV, Jr, Helzlsouer K, Rinaldi S, Riboli E, Kaaks R, Janssen JA, Wildhagen MF, Schroder FH, Platz EA, Pollak M, Giovannucci E, Schaefer C, Quesenberry CP, Jr, Vogelman JH, Severi G, English DR, Giles GG, Stattin P, Hallmans G, Johansson M, Chan JM, Gann P, Oliver SE, Holly JM, Donovan J, Meyer F, Bairati I, Galan P. Insulin-like growth factors, their binding proteins, and prostate cancer risk: analysis of individual patient data from 12 prospective studies. Annals of internal medicine. 2008;149(7):461–471. W483–468. doi: 10.7326/0003-4819-149-7-200810070-00006. [DOI] [PMC free article] [PubMed] [Google Scholar]
- 29.Drobnjak M, Osman I, Scher HI, Fazzari M, Cordon-Cardo C. Overexpression of cyclin D1 is associated with metastatic prostate cancer to bone. Clin Cancer Res. 2000;6(5):1891–1895. [PubMed] [Google Scholar]
- 30.Hu H, Zhang J, Lee HJ, Kim SH, Lu J. Penta-O-galloyl-beta-D-glucose induces Sand G(1)-cell cycle arrests in prostate cancer cells targeting DNA replication and cyclin D1. Carcinogenesis. 2009;30(5):818–823. doi: 10.1093/carcin/bgp059. [DOI] [PMC free article] [PubMed] [Google Scholar]
- 31.Dumont N, Arteaga CL. Targeting the TGF beta signaling network in human neoplasia. Cancer cell. 2003;3(6):531–536. doi: 10.1016/s1535-6108(03)00135-1. [DOI] [PubMed] [Google Scholar]
- 32.Wiklund FE, Bennet AM, Magnusson PK, Eriksson UK, Lindmark F, Wu L, Yaghoutyfam N, Marquis CP, Stattin P, Pedersen NL, Adami HO, Gronberg H, Breit SN, Brown DA. Macrophage inhibitory cytokine-1 (MIC-1/GDF15): a new marker of all-cause mortality. Aging cell. 9(6):1057–1064. doi: 10.1111/j.1474-9726.2010.00629.x. [DOI] [PMC free article] [PubMed] [Google Scholar]
- 33.Bauskin AR, Brown DA, Kuffner T, Johnen H, Luo XW, Hunter M, Breit SN. Role of macrophage inhibitory cytokine-1 in tumorigenesis and diagnosis of cancer. Cancer research. 2006;66(10):4983–4986. doi: 10.1158/0008-5472.CAN-05-4067. [DOI] [PubMed] [Google Scholar]
- 34.Chang YM, Bai L, Liu S, Yang JC, Kung HJ, Evans CP. Src family kinase oncogenic potential and pathways in prostate cancer as revealed by AZD0530. Oncogene. 2008;27(49):6365–6375. doi: 10.1038/onc.2008.250. [DOI] [PMC free article] [PubMed] [Google Scholar]
- 35.Fantuzzi G. Adipose tissue, adipokines, and inflammation. The Journal of allergy and clinical immunology. 2005;115(5):911–919. doi: 10.1016/j.jaci.2005.02.023. quiz 920. [DOI] [PubMed] [Google Scholar]
- 36.Kim JH, Kim KY, Jeon JH, Lee SH, Hwang JE, Lee JH, Kim KK, Lim JS, Kim KI, Moon EY, Lee HG, Ryu JH, Yang Y. Adipocyte culture medium stimulates production of macrophage inhibitory cytokine 1 in MDA-MB-231 cells. Cancer letters. 2008;261(2):253–262. doi: 10.1016/j.canlet.2007.11.020. [DOI] [PubMed] [Google Scholar]
- 37.Garofalo C, Surmacz E. Leptin and cancer. Journal of cellular physiology. 2006;207(1):12–22. doi: 10.1002/jcp.20472. [DOI] [PubMed] [Google Scholar]
- 38.Huang CY, Yu HS, Lai TY, Yeh YL, Su CC, Hsu HH, Tsai FJ, Tsai CH, Wu HC, Tang CH. Leptin increases motility and integrin up-regulation in human prostate cancer cells. Journal of cellular physiology. doi: 10.1002/jcp.22455. [DOI] [PubMed] [Google Scholar]
- 39.Singh SK, Grifson JJ, Mavuduru RS, Agarwal MM, Mandal AK, Jha V. Serum leptin: a marker of prostate cancer irrespective of obesity. Cancer Biomark. 7(1):11–15. doi: 10.3233/CBM-2010-0136. [DOI] [PubMed] [Google Scholar]
- 40.Barb D, Pazaitou-Panayiotou K, Mantzoros CS. Adiponectin: a link between obesity and cancer. Expert opinion on investigational drugs. 2006;15(8):917–931. doi: 10.1517/13543784.15.8.917. [DOI] [PubMed] [Google Scholar]
- 41.Graichen R, Liu D, Sun Y, Lee KO, Lobie PE. Autocrine human growth hormone inhibits placental transforming growth factor-beta gene transcription to prevent apoptosis and allow cell cycle progression of human mammary carcinoma cells. The Journal of biological chemistry. 2002;277(29):26662–26672. doi: 10.1074/jbc.M109931200. [DOI] [PubMed] [Google Scholar]
- 42.Wahdan-Alaswad RS, Song K, Krebs TL, Shola DT, Gomez JA, Matsuyama S, Danielpour D. Insulin-Like Growth Factor I Suppresses Bone Morphogenetic Protein Signaling in Prostate Cancer Cells by Activating mTOR Signaling. Cancer research. 70(22):9106–9117. doi: 10.1158/0008-5472.CAN-10-1119. [DOI] [PMC free article] [PubMed] [Google Scholar] [Retracted]
- 43.Roberts CT., Jr IGF-1 and prostate cancer. Novartis Foundation symposium. 2004;262:193–199. discussion 199–204, 265–198. [PubMed] [Google Scholar]
- 44.Lima GA, Correa LL, Gabrich R, Miranda LC, Gadelha MR. IGF-I, insulin and prostate cancer. Arquivos brasileiros de endocrinologia e metabologia. 2009;53(8):969–975. doi: 10.1590/s0004-27302009000800010. [DOI] [PubMed] [Google Scholar]
- 45.Kaplan PJ, Mohan S, Cohen P, Foster BA, Greenberg NM. The insulin-like growth factor axis and prostate cancer: lessons from the transgenic adenocarcinoma of mouse prostate (TRAMP) model. Cancer research. 1999;59(9):2203–2209. [PubMed] [Google Scholar]
- 46.Kotzsch A, Nickel J, Seher A, Sebald W, Muller TD. Crystal structure analysis reveals a spring-loaded latch as molecular mechanism for GDF-5-type I receptor specificity. The EMBO journal. 2009;28(7):937–947. doi: 10.1038/emboj.2009.37. [DOI] [PMC free article] [PubMed] [Google Scholar]
- 47.Nickel J, Kotzsch A, Sebald W, Mueller TD. A single residue of GDF-5 defines binding specificity to BMP receptor IB. Journal of molecular biology. 2005;349(5):933–947. doi: 10.1016/j.jmb.2005.04.015. [DOI] [PubMed] [Google Scholar]
- 48.Schreuder H, Liesum A, Pohl J, Kruse M, Koyama M. Crystal structure of recombinant human growth and differentiation factor 5: evidence for interaction of the type I and type II receptor-binding sites. Biochemical and biophysical research communications. 2005;329(3):1076–1086. doi: 10.1016/j.bbrc.2005.02.078. [DOI] [PubMed] [Google Scholar]
- 49.Allendorph GP, Isaacs MJ, Kawakami Y, Izpisua Belmonte JC, Choe S. BMP-3 and BMP-6 structures illuminate the nature of binding specificity with receptors. Biochemistry. 2007;46(43):12238–12247. doi: 10.1021/bi700907k. [DOI] [PubMed] [Google Scholar]
- 50.Kirsch T, Sebald W, Dreyer MK. Crystal structure of the BMP-2-BRIA ectodomain complex. Nature structural biology. 2000;7(6):492–496. doi: 10.1038/75903. [DOI] [PubMed] [Google Scholar]