Abstract
To study the direct effects of photosynthesis on allocation of biomass by altering photosynthesis without altering leaf N or nitrate content, phosphoribulokinase (PRK) activity was decreased in transgenic tobacco (Nicotiana tabacum L.) with an inverted tobacco PRK cDNA and plants were grown at different N levels (0.4 and 5 mm NH4NO3). The activation state of PRK increased as the amount of enzyme was decreased genetically at both levels of N. At high N a 94% decrease in PRK activity had only a small effect (20%) on photosynthesis and growth. At low N a 94% decrease in PRK activity had a greater effect on leaf photosynthesis (decreased by up to 50%) and whole-plant photosynthesis (decreased by up to 35%) than at high N. These plants were up to 35% smaller than plants with higher PRK activities because they had less structural dry matter and less starch, which was decreased by 3- to 4-fold, but still accumulated to 24% to 31% of dry weight; young leaves contained more starch than older leaves in older plants. Leaves had a higher ion and water content, and specific leaf area was higher, but allocation between shoot and root was unaltered. In conclusion, low N in addition to a 94% decrease in PRK by antisense reduces the activity of PRK sufficient to diminish photosynthesis, which limits biomass production under conditions normally considered sink limited.
The relationship between photosynthesis and growth is a complex one, with growth rate not being well correlated with the rate of photosynthesis on a leaf-area basis (Poorter et al., 1990). This is because growth also depends on the investment of biomass in growing sinks and investment in leaf area (Chapin et al., 1990; Poorter and Remkes, 1990). There have been many thorough investigations of the relationship between photosynthesis, growth, environment, and genotype, but they have not provided definitive information on the relationship between photosynthesis and growth. This is because of the complex interaction between factors, so it has not been easy to decide whether changes in sink growth result from changes in photosynthesis or vice versa. The elucidation of the relationship between photosynthesis and growth requires specific changes in photosynthesis or sink growth independent of other changes. Genetic manipulation of enzymes involved in photosynthesis and/or sink processes provides a means to achieve this. The use of transgenic plants with altered amounts of Rubisco revolutionized the analysis of photosynthesis and its interaction with the whole plant (Quick et al., 1991b; Stitt and Schulze, 1994). However, because Rubisco constitutes such a large proportion of the protein in a leaf (up to 40%; Woodrow and Berry, 1988), a decrease in amounts of Rubisco substantially disrupts the N balance of the plant, making it difficult to establish direct links between photosynthesis and growth and allocation than if there were a more specific alteration in the rate of photosynthesis. What is required is genetic modification of a photosynthetic enzyme that accounts for a fraction of the N content in the leaf.
PRK is one such enzyme, accounting for less than 1% of the protein in a leaf (Evans, 1989). Tobacco (Nicotiana tabacum L.) plants were transformed with an inverted cDNA encoding tobacco PRK (Knight and Gray, 1994). First, it was determined that the effect of this modification on photosynthesis under standard growth-chamber conditions was minimal until there was a large decrease in PRK activity (greater than 85%), and even then the effects were small (Paul et al., 1995). Later, down-regulation of PSII activity and electron transport (Habash et al., 1996) and the possible contribution of differences in amounts of tight-binding inhibitors to differences in activation of Rubisco in these plants (Paul et al., 1996) were documented.
Here we use these plants to study the direct effects of photosynthesis on allocation of biomass. To test the hypothesis that a genetic decrease in photosynthesis would have less effect on growth under strongly sink-limited conditions, we grew the plants at low-N (sink-limited) and high-N levels. Measurements were carried out on four lines of plants with activities of PRK between 6% and 100% of the wild type. To demonstrate predictable effects of antisense during the course of plant development and with N nutrition, measurements of a number of parameters were made on leaves and plants of different ages. These data are plotted against developmental stage (number of leaves per plant). Where measurements are made at just one stage of development, the data are plotted against PRK activity.
MATERIALS AND METHODS
Plant Material
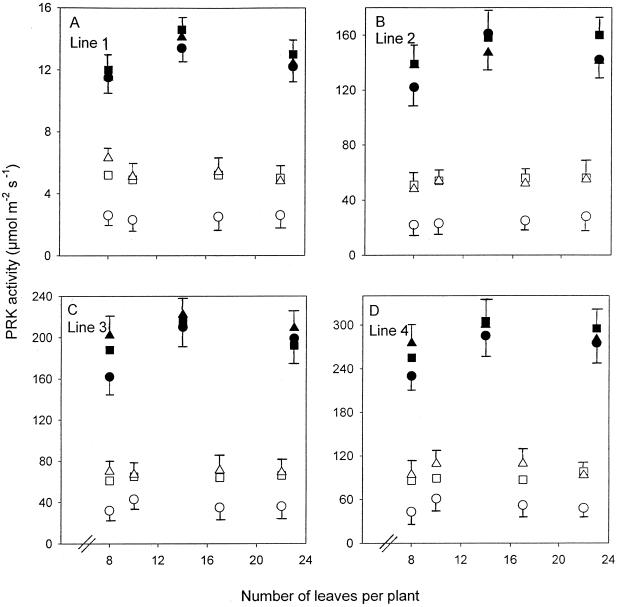
Tobacco (Nicotiana tabacum L.) plants were transformed by Agrobacterium tumefaciens-mediated leaf-disc transformation. Tobacco PRK cDNA was subcloned into the binary vector pROK8, a derivative of pBIN19, with a tobacco rbcS promoter and nos terminator. Of the 11 homozygous lines originally characterized (Paul et al., 1995) four were used in the experiments. Line 4 was transformed in the same way as the others, but with the PRK sequence omitted from the construct, which gave wild-type activities of PRK. These plants served as the control plants. Line 1 had activities of PRK that were on average 6% of the wild type; line 2, 54%; and line 3, 73%. These activity differences between the lines were maintained at both high and low N, in leaves of different ages, and in plants of different ages (Fig. 1, A–D). Plants were T2 progeny of selfed T1 obtained from the independent transformants T0. During the experiments we took care to ensure that plants did not shade each other during growth. Seeds were sown on filter paper and transferred to pots of Bedfordshire silver sand when seedlings were 10-d-old (Joseph Arnold, Leighton Buzzard, UK). Then they were irrigated to field capacity with nutrient medium containing either (final concentrations) 5 mm NH4NO3 (high N) or 0.4 mm NH4NO3 (low N) and 3 mm KH2PO4, 1 mm MgSO4, 1 mm CaSO4, 20 μm Fe-EDTA, 50 μm KCl, 25 μm H3BO3, 1.5 μm MnSO4, 2 μm ZnSO4, 0.5 μm CuSO4, and 0.5 μm H2MoO4. Aluminum foil was placed on the surface of the sand when the plants were young to prevent algal growth. Plants were cultivated in a controlled-environment chamber providing 330 μmol photons m−2 s−1, a 14-h photoperiod, and a constant temperature of 25°C with 70% RH. Samples were taken from plants between the 8-leaf and the 23-leaf stage. For plants grown at high N, this was over a period of 28 d, and for plants at low N, this was over a period of 69 d. The 8-leaf stage was 55 d from sowing for both sets of plants. Samples for PRK, Rubisco, starch, and gas-exchange measurements were taken from leaves of different ages. These were the most recently fully expanded leaf (mid-leaf), which was then used as a reference point for old leaves, taken two leaves below this one, and young leaves, taken two leaves above it. These leaves represented the most photosynthetically active part of the plant. Samples were taken 7 h into the photoperiod. At the 22-leaf stage, the element content and enzyme activation states were also determined.
Figure 1.
Maximum catalytic activities of PRK in lines 1 (A), 2 (B), 3 (C), and 4 (D) grown at high N (•, ▪, ▴) and low N (○, □, ▵). Points are means of four replicates taken during the middle of the photoperiod from the most recently fully expanded leaves (▪, □), two leaves below these leaves (old leaves; •, ○), and two leaves above these leaves (young leaves; ▴, ▵). Error bars represent the maximum se of the different-aged leaves.
Measurement of PRK and Rubisco Activities
To determine PRK and Rubisco activities, leaf samples were freeze clamped using tongs with aluminum clamps precooled in liquid N2. PRK and Rubisco were extracted from 3 cm2 of leaf in 1 mL of 100 mm Hepes-KOH, pH 8.0, 10 mm MgCl2, 0.4 mm EDTA, 0.1% Triton X-100, and 15 mm 2-mercaptoethanol in a Potter homogenizer at 4°C. For the assay of PRK, aliquots were diluted 20-fold in extraction buffer and assayed immediately at 25°C by coupling the formation of ADP to the oxidation of NADH using pyruvate kinase and lactate dehydrogenase in the presence of 20 mm DTT to ensure full activation of PRK (Kagawa, 1982). Initial activities of PRK were measured as described by Leegood (1990), except that the reaction was allowed to proceed for just 30 s in the absence of 20 mm DTT. After 30 s the reaction was quenched with 5% perchloric acid and the amount of ADP was measured as in the assay for maximum activity. Rubisco was assayed in 100 mm Bicine, pH 8.2, containing 20 mm MgCl2, 100 mm NaH14CO3 (0.5 μCi μmol−1), and 33 mm ribulose-1,5-bisphosphate. Initial activities were determined from 20 μL of undiluted extract and assayed for 1 min before quenching with 100 μL of 10 n formic acid. Maximum Rubisco activity was determined after preincubation of extract in assay buffer minus ribulose-1,5-bisphosphate for 3 min. The assay was then started with ribulose-1,5-bisphosphate and quenched with 10 n formic acid after 1 min. The incorporation of 14C label was determined by scintillation counting.
Measurement of Photosynthesis
Rates of net photosynthesis of individual leaves were measured in the laboratory under the conditions in which the plants had been grown (330 μmol photons m−2 s−1, 350 μmol CO2 mol−1, 25°C, 70% RH, and 1 kPa vapor pressure deficit). Measurements were carried out using a six-chamber open-circuit gas-exchange system with automatic data handling. The partial pressure of CO2 was controlled by a gas blender (Signal Instruments Co., Croydon, UK) and measured with an IR gas analyzer (Mark 3, ADC, Hoddesdon, UK). The humidity of the air before and after passage over the leaf was determined with capacitance sensors (Vaisala, Helsinki, Finland). All measurements were made on 10-cm2 areas of the most recently fully expanded leaves attached to 6-week-old plants in leaf chambers with forced ventilation. The flow rate to each leaf chamber was 9 cm3 s−1. The CO2 concentration within the leaf was calculated as described by von Caemmerer and Farquhar (1981). Leaves were allowed to equilibrate to conditions within the chambers for 30 min before measurement. Rates of photosynthesis of whole plants were measured in a Perspex chamber (70 cm high, 40 cm wide, and 40 cm deep) connected to the gas-exchange system described above, with all conditions the same. The flow rate to the chamber was 194 cm3 s−1 and RH in the chamber was 50%. Whole plants were allowed to equilibrate to the conditions for 90 min before measurement. The gas exchange of the roots in sand was also determined and taken into account in the final calculation of whole-plant photosynthesis.
Determination of Growth Parameters
Leaf area was measured using an automated planimeter (Delta-T Devices, Ltd., Burwell, Cambridge, UK). Dry weight was measured after plant material was dried in an oven at 70°C. SLA was calculated as the amount of leaf area generated per unit dry weight invested in the leaf, and LAR was calculated as the amount of leaf area per unit total dry weight.
Measurements of Carbohydrates
Discs were cut with a cork borer and extracted in 100 mm imidazole-HCl buffer, pH 6.9, and an aliquot was immediately added to 80% ethanol at 70°C for 20 min. Samples were then kept at −20°C until analysis. Glc, Fru, and Suc were measured through the reduction of NADP by Glc-6-P dehydrogenase after the sequential addition of hexokinase, phosphoglucose isomerase, and invertase (Jones et al., 1977). The method was adapted for use on an ELISA plate, using reduced volumes and a microplate reader to measure absorbance changes. Starch was measured after breakdown of starch to Glc in the insoluble pellet using α-amylase and amyloglucosidase (Sonnewald et al., 1991) after extraction of soluble components from leaf discs. The Glc was then measured as described above.
Measurement of Elements and Nitrate
Leaves were dried and ground to a fine powder in a mill. C and N contents were measured by combustion in a LECO C, N, and S analyzer (model CNS-2000, LECO Instruments, Ltd., Stockport, Cheshire, UK). Macronutrients (S, K, Mg, Na, P, and Ca) were extracted from dried leaf material by digestion with a nitric/perchloric acid mixture and quantified by inductively coupled plasma emission spectroscopy (Maxim, Applied Research Laboratories, Ecublens, Switzerland). Nitrate was extracted from dried leaf material in boiling water and converted to nitrite with nitrate reductase, and the nitrite was quantified with sulfanilic acid and N-(1-naphthyl)ethylenediamine dihydrochloride (Greiss reagent). A550 was measured on a microplate reader (model MR5000, Dynatech Laboratories, West Sussex, UK) (Misko et al., 1993; Verdon et al., 1995).
RESULTS
Activities of PRK and Rubisco
The activity of PRK was affected in a uniform way by antisense in the four transgenic lines under low and high N and in leaves and plants of different ages (Fig. 1, A–D). Activity of PRK in line 1 was 6% of wild-type PRK activity irrespective of plant or leaf age or nutrition; line 2, 54%; and line 3, 73%. Low N compared with high N decreased activities of PRK between 2- and 3-fold in the most recently fully expanded and young leaves and by 4- to 5-fold in older leaves. The effects of leaf age on PRK activity were more pronounced at low N than at high N, with older leaves of low-N plants containing one-half of the activity of younger leaves. At high N the effects of leaf age on PRK activity were small. There was a small in-crease and then a decrease in PRK activity with plant age in plants grown at high N, but little effect in plants grown at low N.
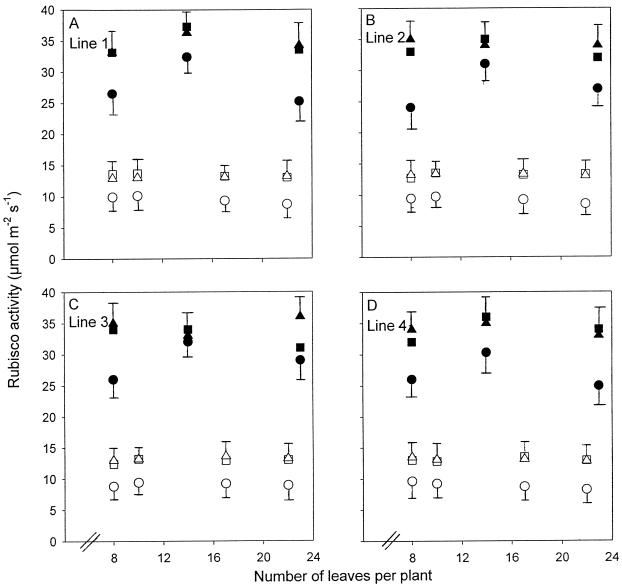
Activities of Rubisco were also affected similarly in all lines by N nutrition and by leaf and plant age (Fig. 2, A–D). Low N compared with high N decreased Rubisco activities by about 3-fold. The effects of leaf age on Rubisco activities at high N were more pronounced than the effects of leaf age on PRK activities, with older leaves containing activities up to one-third lower than younger leaves. The effect of leaf age at low N was similar to the effect at high N and somewhat less pronounced than the effect of leaf age on PRK activities at low N. There was a small increase and then a decrease in Rubisco activity with plant age in plants grown at high N, and little effect of plant age on Rubisco activity at low N.
Figure 2.
Maximum catalytic activities of Rubisco in lines 1 (A), 2 (B), 3 (C), and 4 (D) grown at high N (•, ▪, ▴) and low N (○, □, ▵). Points are means of four replicates from the most recently fully expanded leaves (▪, □), two leaves below these leaves (old leaves; •, ○), and two leaves above these leaves (young leaves; ▴, ▵). Error bars represent the maximum se of the different-aged leaves.
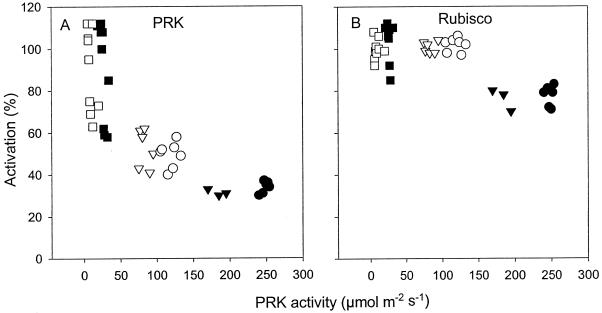
The activation states of PRK increased in response to a decrease in the amounts of PRK (P ≤ 0.02; Fig. 3A). The activation state of Rubisco also increased when PRK was decreased genetically (P ≤ 0.001; Fig. 3B), except at low N, at which Rubisco was fully active at all PRK activities.
Figure 3.
Activation state (initial activity as a percentage of maximum activity) of PRK (A) and Rubisco (B) in leaves of plants grown at high N (▪, ▴, •) and low N (□, ▵, ○). Line 1 (▪, □), line 3 (▴, ▵), and line 4 (•, ○). Each point represents a measurement on a different plant of each line from the most recently fully expanded leaves at the 22-leaf stage. Statistically significant differences in PRK activation were recorded between line 1 and lines 3 and 4 at high and low N (P ≤ 0.02). Statistically significant differences in Rubisco activation were recorded between line 1 and lines 3 and 4 at high N (P ≤ 0.001).
CO2 Assimilation
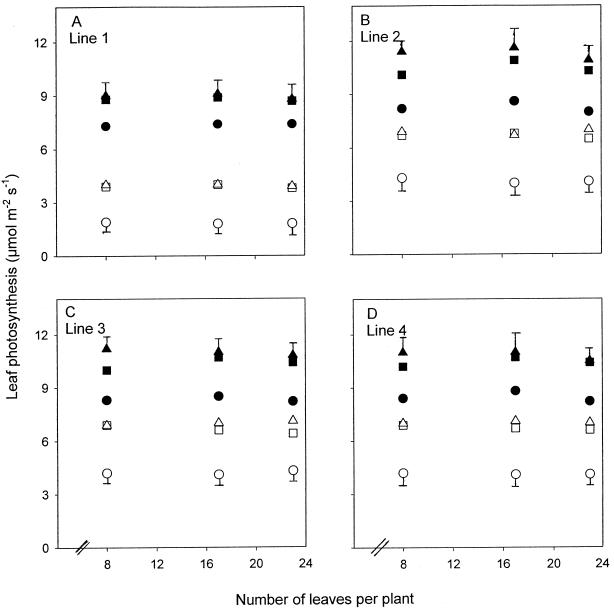
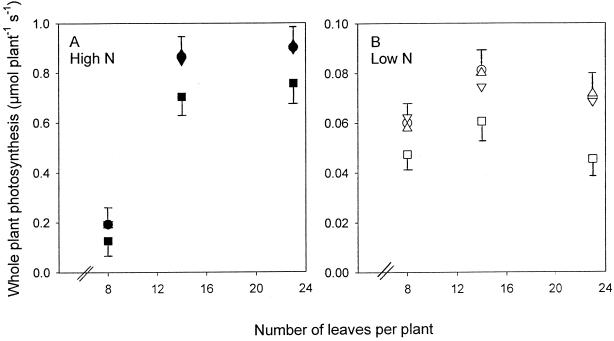
A decrease in PRK activity had an effect on CO2 assimilation only in line 1 (Figs. 4, A–D, and 5). At high N the rates of CO2 assimilation of individual leaves and plants of line 1 were 20% lower than those of the other lines when measured under the growing conditions (Figs. 4, A–D, and 5A). However, at low N the difference in CO2 assimilation between line 1 and the other lines was much greater and was greatest in older leaves, in which rates of photosynthesis in line 1 were one-half of the rates in the other lines (Fig. 4, A–D). In younger leaves photosynthesis in line 1 was about 60% of that in the other lines. Measured at the whole plant, photosynthesis per plant of line 1 was 65% that of the other lines at low N at the end of the experiment, the difference having increased as the plants aged (Fig. 5B). At low N net CO2 uptake actually decreased per plant beyond the 14-leaf stage because of a large number of photosynthetically inactive older leaves.
Figure 4.
Leaf photosynthesis in lines 1 (A), 2 (B), 3 (C), and 4 (D) grown at high N (•, ▪, ▴) and low N (○, □, ▵). Points are means of four replicates from the most recently fully expanded leaves (▪, □), two leaves below these leaves (old leaves; •, ○), and two leaves above these leaves (young leaves; ▴, ▵). Error bars represent the maximum se of the different-aged leaves. .
Figure 5.
Whole-plant photosynthesis in lines 1 (▪, □), 2 (▴, ▵), 3 (▾, ▿), and 4 (•, ○) grown at high N (▪, ▴, ▾, •) and low N (□, ▵, ▿, ○). Error bars represent the maximum se of lines 2, 3, and 4, and the se of line 1.
Growth and Allocation
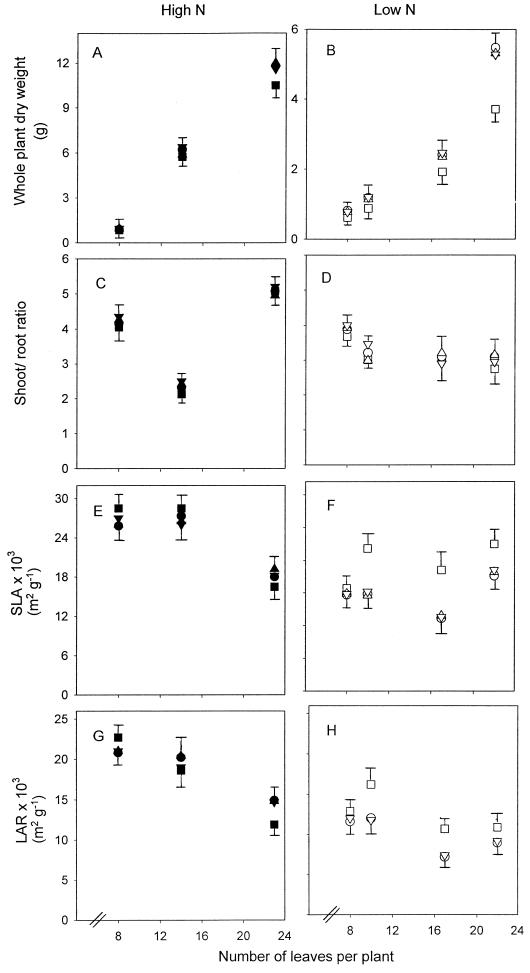
Low N compared with high N produced smaller plants, which took 69 d from the 8-leaf stage to reach the 23-leaf stage, compared with 28 d at high N. Dry weight at the 23-leaf stage was 2-fold lower at low N compared with high N. The effect of a decrease in PRK activity on growth and allocation at high N was minimal (Fig. 6, A, C, E, and G). At high N, plants of line 1 were 10% smaller than plants of the other lines and there was no consistent effect on the shoot-to-root ratio, SLA, and LAR. At low N, however, stronger effects on growth of line 1 compared with the other lines were observed (Fig. 6, B, D, F, and H). Plants with the lowest PRK activities were 30% to 35% smaller by the end of the experiment than the other lines (P ≤ 0.05; Fig. 6B), a difference that became clear at the 10-leaf stage. This was because of smaller shoots and roots, yet the shoot-to-root ratio was unaltered (Fig. 6D). From the 10-leaf stage, the SLA and the LAR of line 1 at low N were up to 50% higher than in the other lines (Fig. 6, F and H) and almost prevented the normal decrease of these parameters because of low N (Fig. 6, E–H).
Figure 6.
Growth parameters of plants grown at high N (▪, ▴, ▾, •) and low N (□, ▵, ▿, ○) in lines 1 (▪, □), 2 (▴, ▵), 3 (▾, ▿), and 4 (•, ○). Whole-plant dry weight (A and B), shoot-to-root ratio (C and D), SLA (leaf area per unit leaf dry weight; E and F), and LAR (leaf area per whole-plant dry weight; G and H). Error bars represent the maximum se of all of the lines except for whole-plant dry weight, SLA, and LAR at low N, for which the se of line 1 is also shown.
To explain these differences in dry weight and in investment in leaf area, we measured the water, nutrient, and carbohydrate contents of the leaves.
Water and Element Content of Leaves
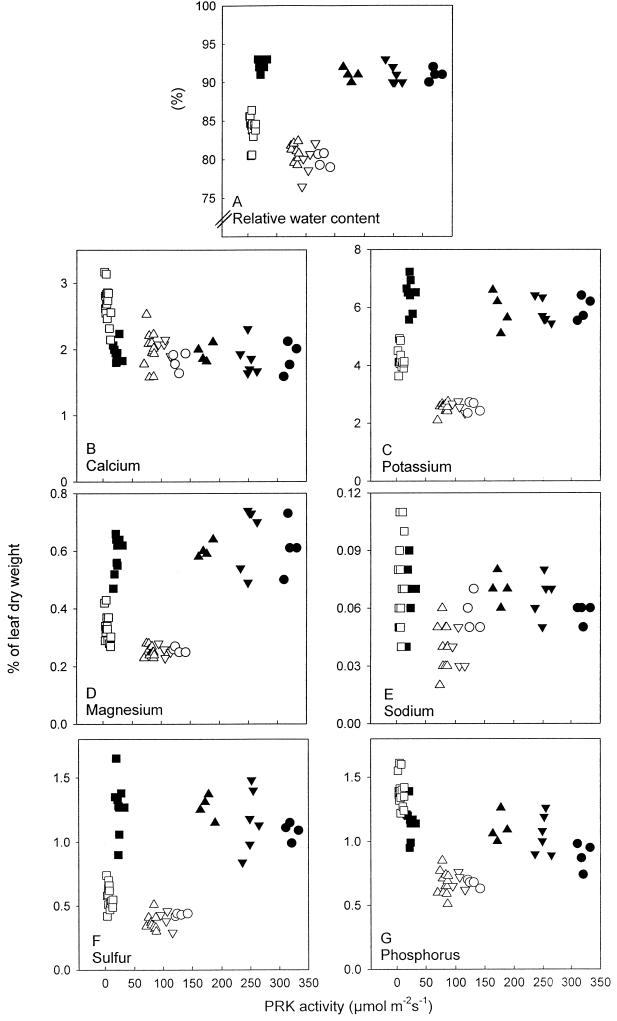
Growth at low N compared with high N resulted in a lower relative water content and lower amounts of K, Mg, and S as a proportion of dry weight (Fig. 7, A, C, D, and F). There was little effect of N nutrition on Ca and Na, and amounts of P were slightly higher in line 1 at low N compared with high N (Fig. 7, B, E, and G). There were no clear effects of PRK activity on relative water content and inorganic ion content of plants grown at high N (Fig. 7, A–G). At low N, however, there was a clear effect of PRK activity on these parameters. The relative water content of leaves of plants with the lowest activities of PRK grown at low N was 5% higher than in plants with higher PRK activities (P ≤ 0.02; Fig. 7A). The inorganic element content of these leaves (Ca, K, Mg, S, and P, but not Na) was also higher (P ≤ 0.01) when expressed per unit dry weight (Fig. 7, B–G). The effects were most pronounced on K and P, which were 2-fold higher in line 1 than in the other lines. Differences persisted when data were expressed per unit leaf water (P ≤ 0.01) or per unit structural dry weight (starch subtracted from dry weight; P ≤ 0.05; data not presented in these forms).
Figure 7.
Water and element content in leaves of plants grown at high N (▪, ▴, ▾, •) and low N (□, ▵, ▿, ○) in lines 1 (▪, □), 2 (▴, ▵), 3 (▾, ▿), and 4 (•, ○). Relative water content (A), Ca (B), K (C), Mg (D), Na (E), S (F), and P (G) in lines 1 (▪, □), 2 (▴, ▵), 3 (▾, ▿), and 4 (•, ○). Each point represents a measurement on a different plant of each line from the most recently fully expanded leaves at the 22-leaf stage. Statistically significant differences in relative water content in plants grown at low N were recorded between line 1 and lines 2, 3, and 4 (P ≤ 0.02) and for all elements except Na of plants grown at low N between line 1 and lines 2, 3, and 4 (P ≤ 0.01).
N, Nitrate, and C Content of Leaves
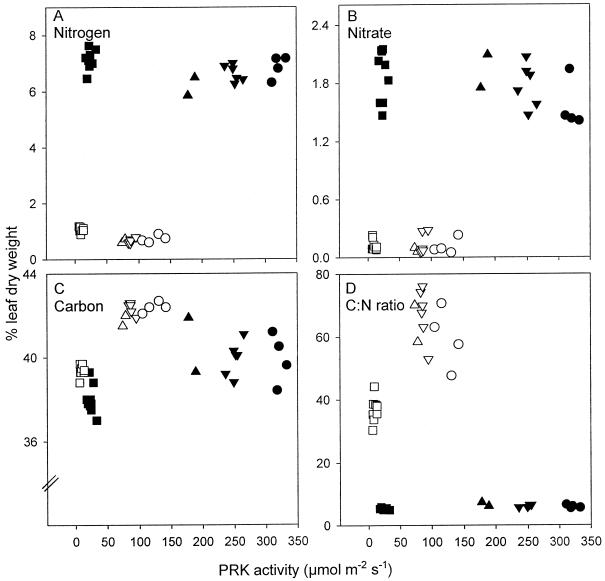
The antisense decrease in PRK activity had no effect on leaf N or nitrate content, although low N significantly decreased by up to 10-fold the amounts of both (Fig. 8, A and B). Amounts of C were decreased in line 1 compared with the other lines at both N supplies, but the effect was more clear at low N (Fig. 8C). The C:N ratio was decreased by low PRK activity at low N (P ≤ 0.01) but was unaffected at high N (Fig. 8D).
Figure 8.
Amounts of N (A), nitrate (B), and C (C), and C:N ratio (D), in leaves of plants grown at high N (▪, ▴, ▾, •) and low N (□, ▵, ▿, ○) in lines 1 (▪, □), 2 (▴, ▵), 3 (▾, ▿), and 4 (•, ○). Each point represents a measurement on a different plant of each line from the most recently fully expanded leaves at the 22-leaf stage. Statistically significant differences in the C content of plants grown at high N were recorded between lines 1 and 3 (P ≤ 0.01) and between line 1 and lines 2, 3, and 4 at low N (P ≤ 0.001). Statistically significant differences in the C:N ratio of plants grown at low N were recorded between line 1 and lines 2, 3, and 4 (P ≤ 0.01).
Carbohydrate Content
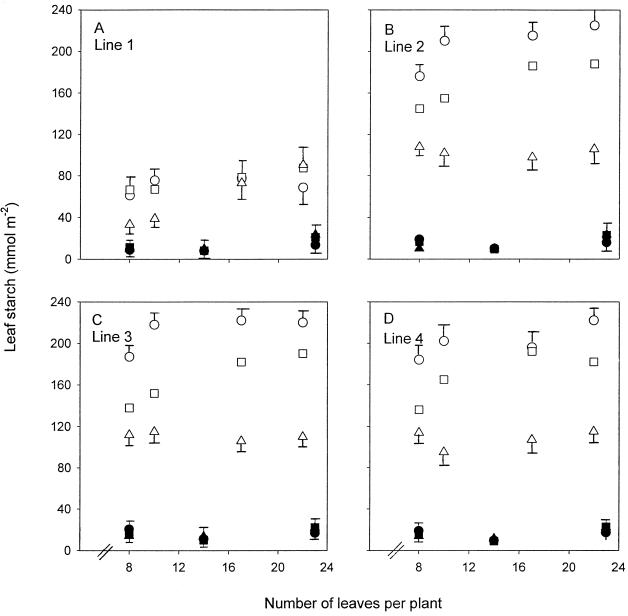
There were only small effects of N nutrition and PRK activity on the soluble carbohydrate content of leaves (data not presented). However, the effects of N and PRK activity on starch content were more apparent (Fig. 9, A–D). At high N starch was 20% to 50% lower in line 1 than in the other lines. There were no large effects of leaf or plant age on starch content at high N. Low N compared with high N increased starch content by up to 10-fold, and the amounts of starch were more markedly affected by PRK activity than at high N. In line 1 starch was 3- to 4-fold lower than in the other lines. Furthermore, the normal pattern of starch accumulation (highest in older leaves and lowest in young leaves) was reversed in line 1 beyond the 10-leaf stage. In lines 2, 3, and 4 there was a 2-fold difference in starch content between young (lowest starch) and old (highest starch) leaves. Line 1 followed this pattern up to the 10-leaf stage and then the starch content of the older leaves of line 1 decreased, whereas that of the younger leaves continued to increase with plant age. By the 22-leaf stage, old leaves of line 1 had less starch than the young leaves.
Figure 9.
Amounts of starch (mmol hexose equivalents m−2) for lines 1 (A), 2 (B), 3 (C), and 4 (D) grown at high N (•, ▪, ▴) and low N (○, □, ▵). Points are means of four replicates taken during the middle of the photoperiod from the most recently fully expanded leaves (▪, □), two leaves below these leaves (old leaves; •, ○), and two leaves above these leaves (young leaves; ▴, ▵). Error bars represent the maximum se of the different-aged leaves.
To determine whether differences in starch content could account for the differences in dry weight observed, starch and dry weight were measured in the same leaf part in plants harvested at the 22-leaf stage. Starch accounted for between 30% and 55% of the difference in leaf dry weight, meaning that differences in dry weight were also caused by differences in structural dry matter (Table I).
Table I.
Contribution of starch to dry weight of leaves in lines 4 and 1 in plants grown at low N at the 22-leaf stage
| Leaf Stage | Dry Wt | Starch | Starch | Dry Wt Minus Starch |
|---|---|---|---|---|
| mg cm−2 | % dry wt | mg cm−2 | ||
| Line 4 | ||||
| Young leaves | 6.78 ± 0.11 | 1.86 ± 0.28 | 27 | 4.92 |
| Mid-leaves | 8.47 ± 0.22 | 3.42 ± 0.12 | 40 | 5.05 |
| Old leaves | 9.15 ± 0.11 | 4.03 ± 0.56 | 44 | 5.12 |
| Line 1 | ||||
| Young leaves | 5.76 ± 0.23 | 1.39 ± 0.03 | 24 | 4.37 |
| Mid-leaves | 5.42 ± 0.20 | 1.67 ± 0.27 | 31 | 3.75 |
| Old leaves | 5.08 ± 0.46 | 1.22 ± 0.19 | 24 | 3.86 |
The mid-leaf is the most recently fully expanded leaf; young leaf is two leaves above it, and old leaf is two leaves below the mid-leaf. Data are means ± se of four replicates.
DISCUSSION
Genetic Decrease in PRK Does Not Disrupt N Balance
Our data demonstrate a genetic alteration of photosynthesis independent of the effects on N or nitrate (Fig. 8, A and B). This is an important consideration because disruption of plant N balance may in itself produce large effects on growth and allocation. Nitrate in particular is an important signal metabolite, regulating shoot-to-root ratio and C allocation (Scheible et al., 1997). PRK therefore represents a good target for studies of this nature and a more ideal one than Rubisco, for which large changes in whole-plant N balance in plants expressing Rubisco antisense were reported (Quick et al., 1991a). Furthermore, PRK activity was affected predictably by antisense in different transgenic lines in leaves of different ages and under different N regimes (Fig. 1, A–D) further validating the use of the plant material to examine direct effects between photosynthesis, growth, and allocation.
The 94% Decrease in PRK Activity Affects Photosynthesis Most at Low N
At high N the effect of the genetic decrease of PRK on photosynthesis, even in line 1 with a 94% decrease in PRK activity, was small (Figs. 4, A–D, and 5). At low N there were larger differences in rates of CO2 assimilation between line 1 and the other lines (Figs. 4, A–D, and 5B). The explanation for this is that low N decreases the expression of PRK in itself by 3- to 4-fold compared with high N. A further 94% decrease in PRK by antisense decreases the activity of PRK sufficiently to impinge more significantly on the rate of photosynthesis. This effect was then exaggerated further in older leaves, in which the activities of PRK and the rates of photosynthesis were very low (Figs. 1A and 4A). An increase in the activation state of PRK in line 1 (Fig. 3A) was insufficient to prevent the decrease in photosynthesis. An increase in activation state, which is a common response to the genetic decrease of enzymes of different activating mechanisms, e.g. Rubisco (Quick et al., 1991b), NADP-malate dehydrogenase (Trevanion et al., 1997), and Suc-P synthase (K.-P. Krause, personal communication), would occur in the case of PRK because of changes in electron transport and consumption of reducing power within the Calvin cycle (Habash et al., 1996), which would alter the redox state of thioredoxin and facilitate the activation of PRK. The increase in Rubisco activation state in these plants (Fig. 3B) is discussed elsewhere (Paul et al., 1996).
PRK-Limited Photosynthesis at Low N Alters Growth and Allocation
Low photosynthesis in line 1 at low N resulted in plants that were smaller than the other lines (Fig. 6B). PRK-limited photosynthesis at low N not only resulted in smaller plants, but altered allocation of dry matter within shoots, as measured by higher SLA and LAR, with no effect on the shoot-to-root ratio (Fig. 6, D, F, and H). Our data suggest that it is unlikely that photosynthesis has any direct effects on the shoot-to-root ratio. The changes observed by Fichtner et al. (1993) in the shoot-to-root ratio in plants with altered Rubisco content were probably caused by the general disruption of plant N balance and, particularly, nitrate, which has been shown to be an important regulator of the shoot-to-root ratio (Scheible et al., 1997). The inorganic-element content of leaves increased in PRK-limited plants at low N (Fig. 7, B–G). Accumulation of ions would be facilitated in slow-growing plants, in which transpiration is relatively insensitive to a decrease in PRK activity (hence, reduction in water use efficiency; data not presented). An accumulation of ions would provide the opportunity for osmotic expansion of leaves and accords with the data of Fichtner et al. (1993) in establishing a relationship between SLA and leaf-element content. At the level of the whole plant, increased SLA could potentially attenuate the effect of decreased photosynthesis and is associated with changes in the aerial environment, e.g. light and CO2, which affect the rate of photosynthesis (Bjorkman, 1981; Garbutt et al., 1990). However, leaf area per se was unchanged, the increase in SLA reflecting a decrease in the dry matter of the leaves. This is confirmed by measurements of whole-plant photosynthesis in line 1 (Fig. 5B), which was 30% to 35% lower than in the other lines (the same as the difference in dry weight), demonstrating that changes in leaf architecture did not prevent an overall decrease in whole-plant photosynthesis.
Source/Sink Balance and Accumulation of Starch
Accumulation of starch at low N is a well-established phenomenon (Rufty et al., 1988; Paul and Stitt, 1993; Paul and Driscoll, 1997) and is interpreted as being a symptom of sink-limited growth, i.e. the capacity to produce assimilate outweighs the capacity to use it, with surplus assimilate accumulating as starch. Therefore, following this logic, a decrease in the rate of photosynthesis should be less important to overall biomass production under sink-limited conditions at low N, at which there is much C. However, the opposite was true with PRK-limited photosynthesis at low N, which had a larger effect on growth than at high N (Fig. 6, A and G). This was partly because the interaction of low N plus antisense pushed PRK activity lower than at high N, which more markedly affected photosynthesis, but it also indicates that source and sink are less out of balance at low N than was assumed in our hypothesis. A decrease in photosynthesis in line 1 at low N resulted in a decrease in starch content, particularly in older leaves, which beyond the 10-leaf stage contained less starch than young leaves, in marked contrast to the normal situation in the wild type and in the other lines (Fig. 9, A–D). However, starch was still present in large amounts despite the plants being clearly source limited by low PRK. This seems anomalous, but it is only so if one assumes that source and sink are out of balance at this stage of N deficiency and that high starch is indicative of the current source/sink balance. A large source/sink imbalance is probably only true of the early stages of N deficiency at the onset of sugar-induced repression of photosynthetic activity (Paul and Driscoll, 1997). High starch may be more a reflection of this period of imbalance than of the current status, and starch persists simply because of low sink activity rather than an ongoing large source/sink imbalance.
It is worth comparing our results with those of similar experiments carried out on Rubisco transgenic plants (Quick et al., 1991a; Fichtner et al., 1993). Here there was almost complete allocation of C away from starch in transgenic plants with decreased Rubisco activity at low N. Starch content responded more strongly to the changed source/sink balance because of Rubisco antisense. Allocation of C away from starch probably accounted for the observation that structural dry weight did not differ between the wild-type and the Rubisco transgenic plants. In line 1 of the PRK transgenic plants structural dry weight was lower than in the other lines. A possible explanation for the difference in C allocation may be that a decrease in Rubisco content, at least in the early phase of N defi-ciency, releases a large amount of N for use elsewhere in the plant (Paul and Stitt, 1993). A decrease in the amount of PRK, however, will not result in a large redistribution of N because PRK accounts for only a fraction of the N within a leaf (Evans, 1989). Thus, decreased photosynthesis in PRK antisense plants occurs without any N redistribution. Strong interactions between starch metabolism and nitrate and N metabolism have been demonstrated (Scheible et al., 1997). N balance was clearly perturbed in Rubisco transgenic plants, which in itself may have affected starch metabolism. It is also possible that internal N signals generated through mobilization of Rubisco influence the way long-term C stores are managed, and the extension of this in Rubisco transgenic plants may have ensured the more effective partitioning of C away from starch in these plants. In conclusion, genetic decrease of PRK goes beyond the normal acclimation of plants to low N, and the resulting decrease in photosynthesis limits biomass production under conditions normally regarded as sink limited.
ACKNOWLEDGMENTS
We thank Steven Dunn for help and advice on the determination of nitrate; Maureen Birdsey, Jeanne Day, and Adrian Crosland for performing the analysis of elements; and Roger Leigh and Steve Trevanion for their comments on a draft of the manuscript.
Abbreviations:
- LAR
leaf area ratio
- PRK
phosphoribulokinase
- SLA
specific leaf area
Footnotes
IACR receives grant-aided support from the Biotechnology and Biological Sciences Research Council (BBSRC) of the United Kingdom. This work was supported by a grant from the BBSRC Clean Technology Initiative.
LITERATURE CITED
- Bjorkman O. Responses to different quantum flux densities. In: Lange OL, Nobel PS, Osmond CB, Ziegler H, editors. Encyclopedia of Plant Physiology, Vol 12A: Physiological Plant Ecology. I. Responses to the Physical Environment. Berlin: Springer-Verlag; 1981. pp. 57–107. [Google Scholar]
- Chapin FS, Schulze ED, Monney HA. The ecology and economics of storage in plants. Annu Rev Ecol Syst. 1990;21:423–447. [Google Scholar]
- Evans JR. Photosynthesis and nitrogen relationships in leaves of C3 plants. Oecologia. 1989;78:9–19. doi: 10.1007/BF00377192. [DOI] [PubMed] [Google Scholar]
- Fichtner K, Quick WP, Schulze E-D, Mooney HA, Rodermel SR, Bogorad L, Stitt M. Decreased ribulose-1,5-bisphosphate carboxylase-oxygenase in transgenic tobacco transformed with antisense rbcS. V. Relationship between photosynthetic rate, storage strategy, biomass allocation and vegetative plant growth at three different nitrogen supplies. Planta. 1993;190:1–9. [Google Scholar]
- Garbutt K, Williams WE, Bazzaz FA. Analysis of the differential response of five annuals to elevated CO2 during growth. Ecology. 1990;71:1185–1194. [Google Scholar]
- Habash DZ, Parry MAJ, Parmar S, Paul MJ, Driscoll S, Knight J, Gray JC, Lawlor DW. The regulation of component processes of photosynthesis in transgenic tobacco with decreased phosphoribulokinase activity. Photosynth Res. 1996;49:159–167. doi: 10.1007/BF00117666. [DOI] [PubMed] [Google Scholar]
- Jones MGK, Outlaw WH, Lowry OH. Enzymic assay of 10−7 to 10−4 moles of sucrose in plant tissues. Plant Physiol. 1977;60:379–383. doi: 10.1104/pp.60.3.379. [DOI] [PMC free article] [PubMed] [Google Scholar]
- Kagawa T (1982) Isolation and purification of ribulose-5-phosphate kinase from Nicotiana glutinosa.In M Edelman, KB Hallick, N-H Chua, eds, Methods in Chloroplast Molecular Biology. Elsevier Biomedical Press, Amsterdam, pp 695–705
- Knight JS, Gray JC (1994) Transgenic Plants as a Tool for the Study of Photosynthetic Carbon Assimilation: Trends in Photosynthesis Research. Intercept, Andover, UK, pp 267–277
- Leegood RC. Enzymes of the Calvin cycle. In: Lea PJ, editor. Methods in Plant Biochemistry, Vol 3. London: Academic Press; 1990. pp. 16–20. [Google Scholar]
- Misko TP, Schilling RJ, Salvemini D, Moore WM, Currie MG. A fluorometric assay for the measurement of nitrate in biological samples. Anal Biochem. 1993;214:11–16. doi: 10.1006/abio.1993.1449. [DOI] [PubMed] [Google Scholar]
- Paul MJ, Andralojc PJ, Banks FM, Parry MAJ, Knight JS, Gray JC, Keys AJ. Altered Rubisco activity and amounts of a daytime tight-binding inhibitor in transgenic tobacco expressing limiting amounts of phosphoribulokinase. J Exp Bot. 1996;47:1963–1966. [Google Scholar]
- Paul MJ, Driscoll SP. Sugar repression of photosynthesis: the role of carbohydrates in signalling nitrogen deficiency through source/sink imbalance. Plant Cell Environ. 1997;20:110–116. [Google Scholar]
- Paul MJ, Knight JS, Habash D, Parry MAJ, Lawlor DW, Barnes SA, Loynes A, Gray JC. Reduction in phosphoribulokinase activity by antisense RNA in transgenic tobacco: effect on CO2 assimilation and growth in low irradiance. Plant J. 1995;7:535–542. [Google Scholar]
- Paul MJ, Stitt M. Effects of nitrogen and phosphorus deficiencies on levels of carbohydrates, respiratory enzymes and metabolites in seedlings of tobacco and their response to exogenous sucrose. Plant Cell Environ. 1993;16:1047–1057. [Google Scholar]
- Poorter H, Remkes C. Leaf area ratio and net assimilation rate of 24 wild species differing in relative growth rate. Oecologia. 1990;83:855–859. doi: 10.1007/BF00317209. [DOI] [PubMed] [Google Scholar]
- Poorter H, Remkes C, Lambers H. Carbon and nitrogen economy of 24 wild species differing in relative growth rate. Plant Physiol. 1990;73:553–559. doi: 10.1104/pp.94.2.621. [DOI] [PMC free article] [PubMed] [Google Scholar]
- Quick WP, Schurr U, Fichtner K, Schulze E-D, Rodermel SR, Bogorad L, Stitt M. The impact of decreased Rubisco on photosynthesis, growth and storage in tobacco plants which have been transformed with antisense rbcS. Plant J. 1991a;1:51–58. [Google Scholar]
- Quick WP, Schurr U, Scheibe R, Schulze E-D, Rodermel SR, Bogorad L, Stitt M. Decreased ribulose-1,5-bisphosphate carboxylase-oxygenase in transgenic tobacco transformed with antisense rbcS. I. Impact on photosynthesis in ambient growth conditions. Planta. 1991b;183:542–554. doi: 10.1007/BF00194276. [DOI] [PubMed] [Google Scholar]
- Rufty TW, Huber SC, Volk RJ. Alterations in leaf carbohydrate metabolism in response to nitrogen stress. Plant Physiol. 1988;88:725–730. doi: 10.1104/pp.88.3.725. [DOI] [PMC free article] [PubMed] [Google Scholar]
- Scheible W-R, Lauerer M, Schulze E-D, Caboche M, Stitt M. Accumulation of nitrate in the shoot acts as a signal to regulate shoot-root allocation in tobacco. Plant J. 1997;11:671–691. [Google Scholar]
- Sonnewald U, Brauer M, von Schawaen A, Stitt M, Willmitzer L. Transgenic tobacco plants expressing yeast-derived invertase in either cytosol, vacuole or apoplast: a powerful tool for studying sucrose metabolism and sink/source interactions. Plant J. 1991;1:95–100. doi: 10.1111/j.1365-313x.1991.00095.x. [DOI] [PubMed] [Google Scholar]
- Stitt M, Schulze D. Does Rubisco control the rate of photosynthesis and plant growth? An exercise in molecular ecophysiology. Plant Cell Environ. 1994;17:465–487. [Google Scholar]
- Trevanion SJ, Furbank RT, Ashton AR. NADP-malate dehydrogenase in the C4 plant Flaveria bidentis. Plant Physiol. 1997;113:1153–1165. doi: 10.1104/pp.113.4.1153. [DOI] [PMC free article] [PubMed] [Google Scholar]
- Verdon CP, Burton BA, Prior RL. Sample pretreatment with nitrate reductase and glucose-6-phosphate dehydrogenase quantitatively reduces nitrate while avoiding interference by NADP+ when the Griess reaction is used to assay for nitrate. Anal Biochem. 1995;224:502–508. doi: 10.1006/abio.1995.1079. [DOI] [PubMed] [Google Scholar]
- von Caemmerer S, Farquhar GD. Some relationships between the biochemistry of photosynthesis and the gas exchange of leaves. Planta. 1981;153:376–387. doi: 10.1007/BF00384257. [DOI] [PubMed] [Google Scholar]
- Woodrow IE, Berry JA. Enzymatic regulation of photosynthetic carbon dioxide fixation in C3 plants. Annu Rev Plant Physiol Plant Mol Biol. 1988;39:533–594. [Google Scholar]


