Abstract
As important drug targets for a variety of human diseases, cyclic nucleotide phosphodiesterases (PDEs) are a superfamily of enzymes sharing a similar catalytic site. We have performed pseudobond first-principles quantum mechanical/molecular mechanical-free energy perturbation (QM/MM-FE) and QM/MM-Poisson-Boltzmann surface area (PBSA) calculations to uncover the detailed reaction mechanism for PDE4-catalyzed hydrolysis of adenosine 3',5'-cyclic monophosphate (cAMP). This is the first report on QM/MM reaction-coordinate calculations including the protein environment of any PDE-catalyzed reaction system, demonstrating a unique catalytic reaction mechanism. The QM/MM-FE and QM/MM-PBSA calculations revealed that the PDE4-catalyzed hydrolysis of cAMP consists of two reaction stages: cAMP hydrolysis (stage 1) and bridging hydroxide ion regeneration (stage 2). The stage 1 includes the binding of cAMP in the active site, nucleophilic attack of the bridging hydroxide ion on the phosphorous atom of cAMP, cleavage of O3'-P phosphoesteric bond of cAMP, protonation of the departing O3' atom, and dissociation of hydrolysis product (AMP). The stage 2 includes the binding of solvent water molecules with the metal ions in the active site and regeneration of the bridging hydroxide ion. The dissociation of the hydrolysis product is found to be rate-determining for the enzymatic reaction process. The calculated activation Gibbs free energy of ≥16.0 and reaction free energy of -11.1 kcal/mol are in good agreement with the experimentally derived activation free energy of 16.6 kcal/mol and reaction free energy of -11.5 kcal/mol, suggesting that the catalytic mechanism obtained from this study is reliable and provides a solid base for future rational drug design.
Introduction
Adenosine and guanosine 3',5'-cyclic monophosphate (cAMP and cGMP) are important intracellular second messengers that are essential in vision, muscle contraction, neurotransmission, exocytosis, cell growth, and differentiation.1In vivo cAMP and cGMP are synthesized by the receptor-linked enzymes (adenylyl and guanylyl cylcases) and metabolized to 5'-nucleotides (e.g. AMP and GMP) by cyclic nucleotide phosphodiesterases (PDEs).2-3 PDEs are a superfamily of enzymes. Hence, PDEs are clinical targets for a series of biological disorders such as retinal degeneration, congestive heart failure, depression, asthma, erectile dysfunction, and inflammation.4-6 Based on amino acid sequences, substrate specificities, regulatory properties, pharmacological properties, and tissue distribution, PDEs can be classified into 11 families, namely PDE1 to PDE11.3 Each family has its own regulatory regions and substrate specificity. However, the catalytic site is found to be highly conserved across all the PDE families, implying a similar hydrolysis mechanism for all PDE enzymes.3 Knowledge of the hydrolysis mechanism of PDEs will help the rational design of potential therapeutics to treat many of above-mentioned disorders.
PDE42 is the major cAMP-metabolizing enzyme found in inflammatory and immune cells. PDE4 inhibitors have proven as potential anti-inflammatory drugs, especially for the treatment of inflammatory pulmonary diseases such as asthma, COPD, and rhinitis. The first X-ray crystal structure of PDE4 catalytic domain was reported by Xu in 2000.2 Presently about 37 different structures from difference PDE4 species are available from the Protein Data Bank. The catalytic site of PDE42, 7-8 is located at a deep pocket in the center of C-terminal sub-domain. The catalytic site consists of four sub-sites, i.e. a metal-binding site (M site), core pocket (Q pocket), hydrophobic pocket (H pocket), and lid region (L region). The Q pocket accommodates the adenine group of cAMP. An asparagine (Q369, PDE4D labeling from ref. 7 is used throughout this report), which is located in the Q-pocket, forms a bidendrate hydrogen bond with the purine ring of cAMP.2, 7 The M site is situated at the bottom of the catalytic site, binding with two divalent metal ions. Xu suggested that a bridging ligand connecting both metal ions in the M site may serve as the nucleophile for the hydrolysis of the cAMP phosphodiester bond.2 According to our previous results of first-principles quantum chemical calculations, this critical bridging ligand should be a hydroxide ion.9 Similar conclusions have also been obtained for other families of PDE enzymes.10-13
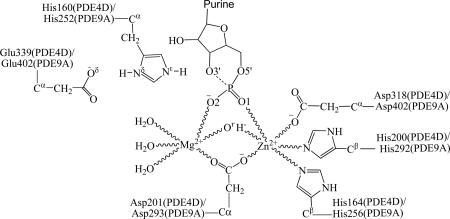
Extensive experimental and theoretical studies have been performed on PDEs to study the structure and mechanism for the catalytic hydrolysis of cyclic nucleotides.7, 9, 11-12, 14-16 A binuclear catalytic mechanism (Scheme 1) was proposed based on the X-ray crystal structure of PDE4D in complex with AMP.7 It was suggested that when substrate cAMP binds with PDE4D, the O3' atom of cAMP forms a hydrogen bond with the side chain of His160 and the phosphoryl oxygen atom of cAMP will coordinate one or both metal ions in the M site. These interactions polarize the phosphodiester bond and confer a partial positive charge to the phosphorus atom. A hydroxide ion bridging two metal ions serves as the nucleophile for the hydrolysis of the cAMP phosphodiester bond. Asp318 serves as a general base to activate a bridging water into a hydroxide ion for nucleophilic attack.7 His160 donates a proton to O3' of cAMP for the completion of phosphodiester bond hydrolysis. Salter et al. computationally studied the PDE4-catalyzed hydrolysis reaction by using a truncated PDE4 active site model.14 Based on their calculations on the simplified PDE4 model system, they suggested that His160 played a key role in activating the bridging water molecule.14 However, Salter et al. used a trigonal bipyramidal complex as reactant structure for the cAMP hydrolysis, in which the hydroxide ion had already bonded with the phosphorous atom at a P−Ohyd distance of 1.95 Å.14 The phosphorous atom was pentacoordinated in their model structure.14 Obviously, the pentacoordinated phosphate structure with a partially formed P−Ohyd bond (i.e. 1.95Å for the length of P−Ohyd) is not expected to be thermodynamically stable. In fact, in the reported crystal structure of cGMP-PDE9 Michaelis-Menten complex (PDB ID: 3DYL),15 the P−Ohyd distance is 2.47 Å and the phosphorous atom of cGMP is tetracoordinated, demonstrating that the bridging hydroxide ion should not automatically get bonded with the phosphorous atom in the enzyme-substrate (ES) complex. Since the catalytic site of PDE9 resembles the one of PDE4, it is likely that the computational study reported by Salter et al. missed the reaction step of the nucleophilic attack of hydroxide ion on phosphorous atom of cAMP, which is critical for PDE4-catalyzed cAMP hydrolysis. Furthermore, because their calculations14 were based on a simplified model of PDE4D active site, the effects of the protein environment were not accounted for appropriately. Therefore, it is essential and necessary to re-examine the fundamental reaction pathway for this important enzymatic hydrolysis by appropriately including the protein environment in the reaction coordinate calculations.
Scheme 1.
The catalytic mechanism proposed by Huai et al.7 for cAMP hydrolysis in the PDE4D active site. In the proposed mechanism, the bridging hydroxide ion will attack the phosphorous atom of cAMP, followed by the opening of phosphate ring and proton transferring from the side chain of His160 to the departing O3' atom. ES represents the cAMP-PDE4D Michaelis-Menten complex. E'P represents the complex between the enzyme and hydrolysis product AMP. The role of residue Glu339 (not shown in this scheme) was not addressed. It was unclear whether or not any intermediate(s) will be generated during the reaction.
To the best of our knowledge, there has been no report of studies on the detailed reaction pathway for the complete cycle of a PDE-catalyzed cAMP hydrolysis and no report of reaction-coordinate calculations on a PDE-catalyzed cAMP hydrolysis accounting for effects of the protein environment. Herein we report the complete cycle of the cAMP hydrolysis catalyzed by PDE4, including both cAMP hydrolysis and hydroxide ion regeneration stages. In the present study, we have carried out first-principles quantum mechanical/molecular mechanical-free energy perturbation (QM/MM-FE) calculations17-20 and first-principles quantum mechanical/molecular mechanical-Poisson-Boltzmann surface area (QM/MM-PBSA)12 calculations to study the detailed reaction pathway and the corresponding free energy profile for PDE4-catalyzed cAMP hydrolysis. In the QM/MM-FE calculations, first-principles QM/MM reaction coordinate calculations were followed by free energy perturbation (FEP) calculations to account for the dynamic effects of the protein environment on the energy barriers for the enzymatic reaction. The QM/MM-PBSA calculations were performed to estimate the binding/dissociation free energy of ES/E'P complex, in which ES stands for the Michaelis-Menten-type of enzyme-substrate complex and E'P stands for the enzyme with the hydrolysis product (P) staying in the active site. Our QM/MM simulations are based on the pseudobond first-principles QM/MM approach,17-18, 20-21 which has been demonstrated to be a powerful tool in simulating a variety of enzymes,19, 22-26 and some theoretical predictions25-26 were subsequently confirmed by experimental studies.27-29 In our current study, the computational results clearly reveal the detailed reaction pathway and the corresponding free energy profile for the PDE4-catalyzed cAMP hydrolysis reaction process. The rate-determining reaction step is thereby identified, and the roles of essential residues are discussed on the basis of the QM/MM-optimized geometries of key states of the enzymatic reaction system.
Computational methods
The X-ray crystal structure of PDE4D16 (PDB ID: 1TB7) and the structure of cAMP in its trans conformation were used to construct the initial Michaelis-Menten complex structure of PDE4-cAMP complex. In the initial structure, the adenosine ring of cAMP was placed in the Q pocket of PDE4D and the negatively charged phosphate ring of cAMP was placed in the metal binding site. The initial molecular geometry of cAMP was optimized by performing ab initio quantum chemical calculation using Gaussian03 program30 at the HF/6-31G* level. The optimized geometry was used to calculate the electrostatic potential on the molecular surface at the same HF/6-31G* level. The calculated electrostatic potential was used to determine partial atomic charges with the standard restricted electrostatic potential (RESP) fitting procedure.31-32 The determined RESP charges were used for the MD simulations. The constructed Michaelis–Menten complex was solvated in a rectangle box of TIP3P water molecules,33 with a minimum solute wall distance of 10 Å. Counter ions were added to neutralize the negative charges of the reaction system. Then the constructed system was relaxed by performing ~2 ns MD simulation.
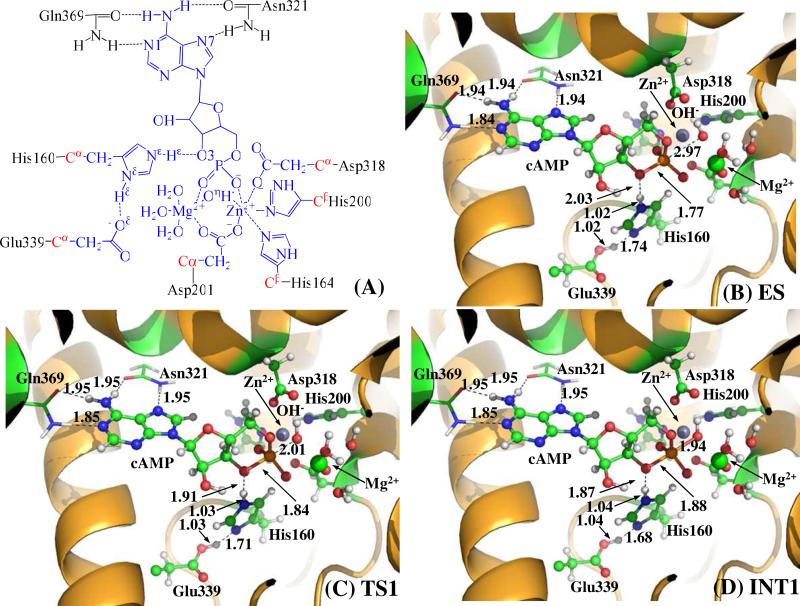
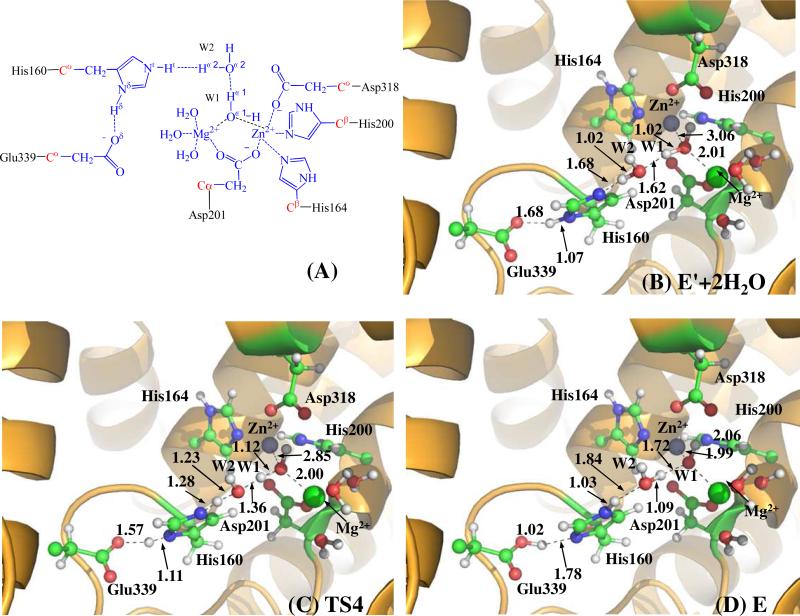
The last snapshots of MD simulations were used to prepare the pseudobond first-principles QM/MM calculations, as the structure of the last snapshot was close to the average structure simulated. Since we are interested in the reaction center, the water molecules beyond 50 Å of the phosphorous atom of cAMP were removed. The QM/MM interface was dealt with by using a pseudobond approach.17-18, 21 The boundary of the QM-MM system depicted in Figures 1A and 4A are for the cAMP hydrolysis (stage 1) and the bridging hydroxide ion regeneration (stage 2), respectively. Prior to the QM/MM geometry optimizations, each initial reaction system was energy-minimized with the MM method by using our revised version34 of the AMBER8 program, where the convergence criterion is a root-mean-square deviation (rmsd) of the energy gradient of less than 0.1 kcal·mol-1·Å-1.
Figure 1.
(A) Division of the QM-MM systems for simulating the reaction stage 1 of PDE4-catalyzed cAMP hydrolysis. Atoms in blue are treated by the QM method. Six boundary carbon atoms (Cα, colored in red) are treated with the improved pseudobond parameters. All other atoms belong to the MM subsystem. (B to D) QM/MM-optimized geometries of key states of the reaction system for step 1, the nucleophilic attack of bridging hydroxide ion on the phosphorous atom of the cAMP. The geometries were optimized at the QM/MM(B3LYP/6-31G*:AMBER) level. The key distances in the figures are in angstrom. Carbon, oxygen, nitrogen and hydrogen atom are colored in greed, red, blue and white, respectively. The backbone of the protein is rendered in orange. The QM atoms are present as balls and sticks and the surrounding residues are rendered as sticks or lines.
Figure 4.
(A) Division of the QM/MM systems for simulating the reaction stage 2. (B to D) QM/MM-optimized geometries of key states of the reaction system for the bridging hydroxide ion regeneration reaction in the active site of substrate-free PDE4. The geometries were optimized at QM/MM(B3LYP/6-31G*:AMBER) level. See caption of Figure 1 for the color codes for various types of atoms.
Minimum-Energy Path of the Enzymatic Reaction
With a reaction coordinate driving method and an iterative energy minimization procedure,20 the enzymatic reaction path was determined by the pseudobond QM/MM reaction-coordinate calculations at the B3LYP/6-31G*:AMBER level, in which the QM calculations were performed at the B3LYP/6-31G* level of theory by using a modified version of Gaussian03 program,30 and the MM calculations were performed by using a modified version34 of the AMBER8 program. Normal mode analyses were performed to characterize the reactants, intermediates, transition sates, and final products. In addition, single-point energy calculations were carried out at the QM/MM(B3LYP/6-31+G*:AMBER) level on the QM/MM-optimized geometries. In all of the QM/MM calculations, the boundary carbon atoms were treated with improved pseudobond parameters.17 No cutoff for non-bonded interactions was used in the QM/MM calculations. For the QM subsystem, the convergence criterion for geometry optimizations follows the original Gaussian03 defaults. For the MM subsystem, the geometry optimization convergence criterion is when the root-mean-square deviation (rmsd) of energy gradient is less than 0.1 kcal·mol-1·Å-1. Prior to QM/MM calculations, the MM subsystem was relaxed by performing ~500 steps of energy minimization using the AMBER8 program. Then atoms within 20 Å of the phosphate atom (P) of cAMP were allowed to move while the other atoms outside this range were frozen in all QM/MM calculations.
Free Energy Perturbation
After the minimum-energy path was determined by the QM/MM calculations, the free energy changes associated with the QM-MM interactions were determined by using the FEP method.20 The FEP calculations started from the QM/MM-optimized geometries of the reaction system (without periodic boundary condition for both QM/MM and FEP calculations). In the FEP calculations, sampling of the MM subsystem was carried out with the QM subsystem frozen at different states along the reaction path. The reaction path was divided into 64 windows. The point charges on the frozen QM atoms used in the FEP calculations were those determined by fitting the electrostatic potential (ESP) for the QM part of the QM/MM single-point calculations. The FEP calculations were performed in both the forward and backward directions along the reaction path. The total free energy difference between the transition state and the reactant was calculated with the same procedure used in our previous work on other reaction systems.23 The FEP calculations enabled us to more reasonably determine relative free energy changes due to the QM-MM interaction. Technically, the final (relative) free energy determined by the QM/MM-FE calculations is the QM part of the QM/MM energy (excluding the Coulombic interaction energy between the point charges of the MM atoms and the ESP charges of the QM atoms) plus the relative free energy change determined by the FEP calculations. In the FEP calculations, the time step used was 2 fs, and bond lengths involving hydrogen atoms were constrained. In sampling of the MM subsystem by MD simulations, the temperature was maintained at 298.15 K. Each FEP calculation in each window consisted of 50 ps for the equilibration and 300 ps for the production sampling (as there was no significant difference between the results associated with 300 ps and those associated with 250 ps). The free energy difference was the average of the forward and backward FEP results. The difference between the forward and backward FEP results for each reaction step was within ~0.3 kcal/mol.
Binding/Dissociation Free Energy Calculations
The obtained ES and E'P structures from the QM/MM calculations were used to estimate the binding free energies (ΔGbind) of cAMP with PDE4D and the dissociation free energy of the hydrolysis product AMP with PDE4D. The binding/dissociation free energies between PDE4D and cAMP/AMP were calculated by using the quantum mechanics/molecular mechanics (QM/MM) and Poisson-Boltzmann surface area model (PBSA) approach, which may be denoted by QM/MM-PBSA. All of the QM/MM-PBSA calculations were done as the single-point calculations by using the QM/MM-optimized geometries of the complexes.
In the QM/MM-PBSA method, the free energy of the ligand binding with the protein, ΔGbind, is calculated from the difference between the free energy of the receptor-ligand complex (Gcom) and the sum of the free energies of the unbound receptor (Grec) and ligand (Glig) as follows:
| (1) |
Dissociation is the reverse process of binding and, thus, the dissociation free energy can be calculated with the following equation:
| (2) |
The binding free energy ΔGbind was evaluated as a sum of the changes in the QM/MM binding energy (ΔEQM/MM), solvation free energy (ΔGsolv), and entropy contribution (-TΔS).
| (3) |
| (4) |
The QM/MM gas-phase binding energy ΔEQM/MM is partitioned into three terms: EQM/MM(com), E QM/MM(rec), and EQM(lig). EQM/MM(rec) and EQM(lig) represent the energies of MM and QM subsystems, respectively. EQM/MM(com) is calculated at the QM/MM(B3LYP/6-31+G*:AMBER) level using the combined software of the revised Gaussian03 and AMBER8 programs developed in our own lab.22,23 The QM part contains the ligand, two metal ions, the residues coordinated the metal ions, one histidine and glutamate residues. EQM/MM(rec) was calculated at the same level. The receptor was optimized again after the ligand was deleted from the optimized complex structure. The QM part for the receptor system contains the same atoms as those for the complex system except that the ligand molecule is absent in the receptor system. The free energies of the free ligands used in the binding free energy calculations were calculated at the B3LYP/6-31+G* level by using the geometries optimized at the B3LYP/6-31G* level.
Added to the QM/MM-calculated energy change, ΔEQM/MM , is the solvation free energy change, ΔGsolv , which is the sum of the contributions from the electrostatic solvation free energy (ΔGPB) and nonpolar solvation energy (ΔGnp):
| (5) |
| (6) |
| (7) |
ΔGPB was calculated from the finite-difference solvation to the Poisson-Boltzmann (PB) equation implemented in the Delphi program,35-36 in which the atomic charges used in the calculations for the receptor are the RESP charges used in the MD simulations and the quantum mechanically calculated RESP charges for the ligands. The dielectric constants used for the solute and solvent (water) were 1 and 80, respectively. The MSMS program37 was used to calculate the solvent-accessible surface area (SASA) from which the nonpolar solvation energy is determined, as described in Eq. 7. The standard parameter values (γ = 0.00542 kcal/Å2 and β = 0.92 kcal/mol)37 were used in our calculations. The standard van der Waals radii built into the AMBER program were also used in the solvation calculations.
The entropy contribution (-TΔS) to the binding free energy was obtained by using a local program developed in our laboratory.38 In this method, the entropy contribution (ΔS) is attributed to two terms, solvation free entropy (ΔSsolv) and conformational free entropy (ΔSconf).
| (8) |
The contribution to the binding free energy from the conformational free energy change is proportional to the number of rotatable bonds (ΔNrot) that are lost during the binding,39
| (9) |
The adjustable parameter, w, was calibrated to be 0.7952 kcal/mol (when four effective digits were kept) by fitting the calculated ΔGbind value for the cAMP-PDE4D binding to the corresponding experimental ΔGbind value of –8.0 kcal/mol determined by the KM value of 1.5 μM. Thus, w = 0.7952 kcal/mol was used in all of our QM/MM-PBSA calculations in this study. We noticed that the w value of 0.7952 kcal/mol calibrated in the present study is slightly smaller than 0.845238 and 139 kcal/mol obtained in previous studies. The difference may be attributed to the possibility that different protein systems may need slightly different w values that best fit the individual systems. Nevertheless, the use of a different value of w would not qualitatively change the relative binding free energies for a protein binding with different ligands, as a slight change of the w value will only systematically (and almost uniformly) change the entropic contributions to the binding free energies for all of the ligands.
| (10) |
The MD simulations and QM/MM-FE and QM/MM-PBSA calculations were performed on supercomputers (e.g. an IBM X-series cluster and a Dell cluster) at the University of Kentucky Center for Computational Sciences.
Results and Discussion
Fundamental reaction pathway for stage 1 – hydrolysis of cAMP
The MD simulation led to a dynamically stable Michaelis–Menten (ES) complex. Our QM/MM reaction coordinate calculation at B3LYP/6-31G*:AMBER level starting from the MD-simulated ES complex revealed that the PDE4-catalyzed hydrolysis of cAMP consists of two reaction stages, i.e. hydrolysis of cAMP (stage 1) and regeneration of hydroxide ion in the substrate-free PDE4 active site (stage 2). The reaction stage 1 includes the binding of cAMP at the active site of PDE4, the nucleophilic attack on phosphorous atom of cAMP by a hydroxide ion, the cleavage of 3'-phosphoesteric bond in cAMP, the protonation of the O3' atom, and the dissociation of hydrolysis product AMP from the active site of PDE4. The reaction stage 2 includes the binding of solvent water molecules with the active site, and finally the regeneration of bridging hydroxide ion in the active site. The optimized geometries of the reactant, intermediates, transition states, and final product are shown in Figures 1 to 3 for stage 1 and Figure 4 for stage 2. Below we discuss each of these reaction steps in detail.
Figure 3.
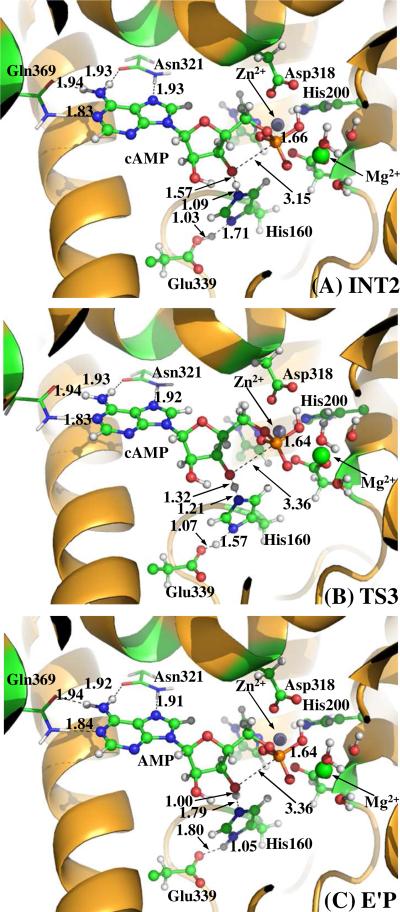
QM/MM-optimized geometries of key states of the reaction system for step 3, the protonation of departing O3' atom. The geometries were optimized at the QM/MM(B3LYP/6-31G*:AMBER) level. See caption of Figure 1 for the color codes for various types of atoms.
Before studying the reaction pathway, the ES complex (see Figure 1B) was optimized at the QM/MM(B3LYP/6-31G*:AMBER) level. In the ES complex, substrate cAMP is in anti conformation. The adenine of cAMP forms four strong hydrogen bonds with the side chains of residues Gln369 and Asn321, and stacks with residue Phe372 (not shown). Residue Gln369 is essential for the Q-pocket, as it is responsible for the selective binding of the adenine.2 This type of interaction has also been observed in the crystal structure of AMP-PDE4D complex,16 suggesting that the orientation of adenine of cAMP is not likely to change during the cAMP hydrolysis stage. In the M site of PDE4, two phosphate oxygen atoms (O1 and O2) of cAMP coordinated to the Zn2+ and Mg2+ ions with a O1−Zn distance of 2.29 Å and a O2−Mg distance of 2.12 Å (Table 1). Upon binding, the Zn2+ and Mg2+ ions help to reduce the negative charge on the phosphate moiety of cAMP, and facilitate the nucleophilic attack of hydroxide ion on the phosphorous atom of cAMP.7 The O3' of cAMP forms a weak hydrogen bond (2.03 Å for O3'−Hε distance) with the side chain of His160, suggesting this histidine is in the right position to donate a proton to the leaving atom O3'. Meanwhile, residue Glu339 attracted a proton from Nδ atom of His160. The distance between Oη atom of hydroxide ion and P atom of cAMP is 2.97 Å, indicating that the hydroxide ion is ready for the nucleophilic attack on the P atom. As seen from table 1, the mode of cAMP interacting with the M site of PDE4 in the optimized ES complex (Figure 1B) resembles that of the cGMP interacting with the M site of PDE9 observed in the X-ray crystal structure of cGMP-PDE9 ES complex (the crystal structure of the cGMP-PDE9 ES complex was prepared successfully in the presence of appropriately chosen concentrations of Zn2+ and Mn2+ ions).15 The phosphate coordination distances (RO1-Zn = 2.29 Å and ROη−Zn = 2.01 Å) are in reasonable agreement with the corresponding experimental values (RO1-Zn = 2.21 Å and ROη−Zn = 1.82 Å).15 As the crystal structure of cGMP-PDE9 ES complex was obtained in the presence of Mn2+ ion,15 the Mg2+ position (ME2) is likely to be occupied by Mn2+ ion.2 Consequently, there are some significant differences between the optimized distances (ROη−Mg = 1.97 Å, RO2-Mg = 2.15 Å, and ROη−P = 2.92 Å) in the present study and the corresponding experimental distances (ROη−Mg = 2.24 Å, RO2-Mg = 1.78 Å, and ROη−P = 2.49 Å). Nevertheless, our calculations clearly show that the hydroxide ion does not form a covalent bond with the phosphorous atom (ROη−P = 2.92 Å) in the optimized ES complex geometry, which is qualitatively consistent with the reported experimental data (ROη−P = 2.49 Å).
Table 1.
Important inter-atomic distances (Å) in the QM/MM(B3LYP/6-31G*:AMBER) optimized structures for the cAMP-PDE4 and AMP-PDE4 complexes.
 | ||||
|---|---|---|---|---|
| Distance | ES complex | E'P complex | ||
| Opt. Distance | Expt.a | Opt. Distance | Expt.a | |
| R(P-Oη) | 2.97 | 2.49 | 1.64 | 1.51 |
| R(Zn-Oη) | 2.01 | 1.82 | 2.94 | 2.34 |
| R(Zn-Oη) | 1.97 | 2.24 | 2.13 | 2.27 |
| R(Zn-O1) | 2.29 | 2.21 | 2.31 | 2.41 |
| R(Mg-O2) | 2.15 | 1.78 | 2.07 | 2.32 |
| R(P-O3') | 1.72 | 1.96 | 3.30 | 3.37 |
| R(Nε-O3') | 3.04 | 2.84 | 2.75 | 2.86 |
| R(Nδ-Oδ) | 2.71 | 2.34 | 2.77 | 2.70 |
Experimental data from the crystal structures of cGMP-PDE9A ES (PDB code: 3DYL) and GMP-PDE9A E'P(PDB code: 3DYS) complexes reported by Liu et al..15
Step 1. Nucleophilic attack of hydroxide ion on phosphorous center
The hydrolysis process proceeds with the nucleophilic attack of hydroxide ion on the phosphorous center of cAMP. With the approaching of the Oη atom of hydroxide to the phosphorous atom, the esteric bond O3'- P is gradually weakened (RO3'- P = 1.77 Å in ES, 1.84 Å in TS1, and 1.88 Å in INT1). In the INT1 structure, cAMP molecule forms a trigonal biopyrimidal complex with the hydroxide ion (Figure 1D). The Oη atom of hydroxide and the O3' atom of cAMP occupy the axial positions of the structure and form two weak bonds with the phosphorous center (RP-Oη = 1.94 Å and R P-O3' = 1.88 Å). Obviously, the trigonal biopyrimidal phosphorous structure in INT1 is unstable due to the existence of the transient bonds P-Oη and P-O3' and is apt to be decomposed into a stable tetrahedral phosphorous structure via the cleavage of P-O3' esteric bond.2, 7, 14 Meanwhile, the strengthening Hε ...O3' hydrogen bond (RHε −O3' = 2.03 Å in ES, 1.87 Å in TS1 and 1.87 Å in INT1) will facilitate the breaking down of the trigonal biopyrimidal phosphorous structure formed in INT1.
Step 2. The cleavage of O3'-P esteric bond
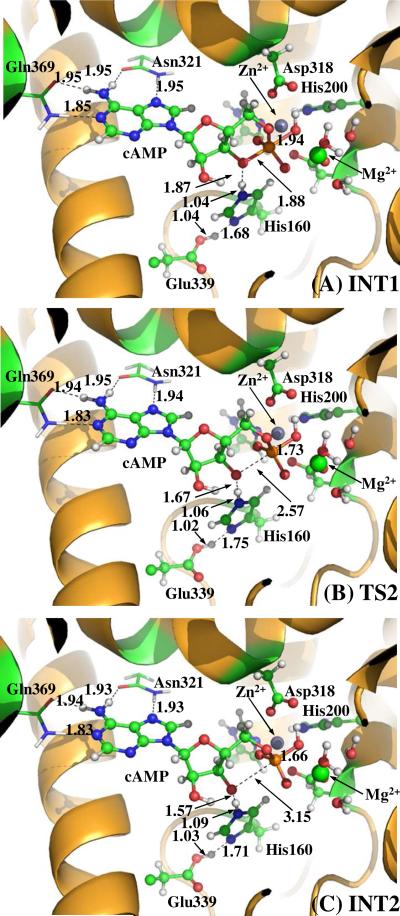
In this step (Figure 2), the O3'-P esteric bond gradually breaks, as reflected by the RO3'-P value increasing from 1.88 Å in INT1 state to 3.15 Å in INT2 state. Meanwhile, the hydrogen bonding interaction between the side chain of His160 and the leaving O3' atom becomes increasingly strong with the RHε− O3' value decreasing from 1.87 Å in INT1 to 1.57 Å in INT2. Residue His160 is apt to donate its proton (Hε) to the departing O3' atom. On the other hand, The Oη−P bond is gradually strengthened with ROη-P distance decreasing from 1.94 Å in INT1 to 1.66 Å in INT2, indicating the trigonal biopyrimidal structure formed in previous step has been completely decomposed into a tetrahedral structure.
Figure 2.
QM/MM-optimized geometries of key states of the reaction system for step 2, the cleavage of O3'−P esteric bond. The geometries were optimized at the QM/MM(B3LYP/6-31G*:AMBER) level. See caption of Figure 1 for the color codes for various types of atoms.
Step 3. Protonation of leaving O3' atom
In this step (Figure 3), the O3' atom extracts the Hε atom from the side chain of His160. A detailed analysis on the imaginary vibration mode of the transition state (TS3 shown in Figure 3B) indicated that the transfer of Hε is accompanied by spontaneous transfer of Hδ from Glu339 to His160. With the protonation of the O3' atom, the bound cAMP molecule is completely converted into the hydrolysis product AMP, which is still in bound with PDE4D. Figure 3C gives the binding mode of AMP with the enzyme, i.e. $$$$E'. It should be noted that the enzyme structure E' differs from the free enzyme structure E in that E' is lacking of a bridging hydroxide ion at the catalytic site and a proton Hε at H160. For the sake of comparison, hereby the complex formed between the hydrolysis product AMP and the enzyme E' is denoted as E'P. Comparing the binding mode of cAMP in ES complex (Figure 1B) with that in E'P (Figure 3C), it can be found in both structures that the binding of the adenine is similar to that of the ribose ring, whereas the binding of the phosphate group at the metal site is remarkably different. As can be seen from Figure 3C and Table 1, in E'P structure, the bound AMP coordinated to the Mg2+ and Zn2+ ions through three phosphoryl oxygen atoms, i.e. O1, O2, and Oη, whereas in ES structure (Figure 1B), cAMP coordinated only to the metal ions through two phosphoryl oxygen atoms (O1 and O2). Hence the electrostatic interactions between the phosphate group and the metal site in the E'P complex should be significantly stronger than that in ES complex. Our present calculations suggest that the binding of AMP in E'P should be significantly stronger than the binding of cAMP in ES.
The E'P structure obtained in this study closely resembles that of GMP in the crystallized GMP-PDE9 E'P complex reported by Liu et al.15 As seen from table 1, the important inter-atomic distances of Oη−P, P−O3', O3'−Nε, and Nδ−Oδ are optimized to be 1.64, 3.30, 2.75, and 2.77 Å, respectively. These values are in good agreement with the experimental values of 1.51, 3.41, 2.86, and 2.70 Å,15 suggesting that the hydrolysis pathway revealed here is reasonable.
It should be noted that the hydrolysis pathway revealed here differs remarkably with the one proposed by Salter et al,14 where a pentacoordinate phosphate complex (denoted here by ESSalter for convenience) was used as the starting structure of PDE4-catalyzed cAMP hydrolysis. Comparing the geometrical parameters in the ESSalter structure with the ones in INT1 obtained in the present study, one can note that the ESSalter structure in Salter's study closely resembles the INT1 structure in the present work. For example, the P-Oη distance of 1.948 Å and P-O3' distances of 1.837 Å in the ESSalter structure are very close to the corresponding ones (1.94 Å for P-Oη and 1.88 Å for P-O3', see Figure 1D) in the INT1 structure in our study. Hence, the ESSalter structure in the simplified model described by Salter et al.14 should actually be a reaction intermediate formed from the nucleophilic attack of the bridging hydroxide ion on the phosphorous center. Hence, the crucial reaction step of the nucleophilic attack was not reflected in the report of Salter et al.. Furthermore, the model study reported by Salter et al. suggested that the hydrolysis of the cyclic nucleotide should be a one-step reaction process, where the ring opening reaction was accompanied by a concerted double proton transfer in which the His234 side chain simultaneous donate a proton to the O3' atom and accept a proton from Glu413 side chain. Our present, more sophisticated computational study, however, reveals that the ring opening reaction and the concerted double proton transfer should occur in a stepwise manner. These remarkable differences in the reaction pathway clearly demonstrate that the protein environment cannot be ignored in the reaction coordinate calculations on enzymatic reactions.
Step 4. Dissociation of the hydrolysis product from the active site
Dissociation of the product from the active site of the enzyme does not involve any covalent bond breaking or formation. Hence, we did not carry out reaction coordinate calculations on the detailed pathway for the dissociation of the hydrolysis product from the active site of PDE4. Instead, QM/MM-PBSA calculations were employed to estimate the dissociation free energy of AMP with PDE4 in the E'P complex. The dissociation free energy of E'P provides the lower limit for the activation free energy of this reaction step. The detailed energetic results will be discussed later in the Energetics section.
Fundamental reaction pathway for stage 2 – regeneration of the bridging hydroxide ion
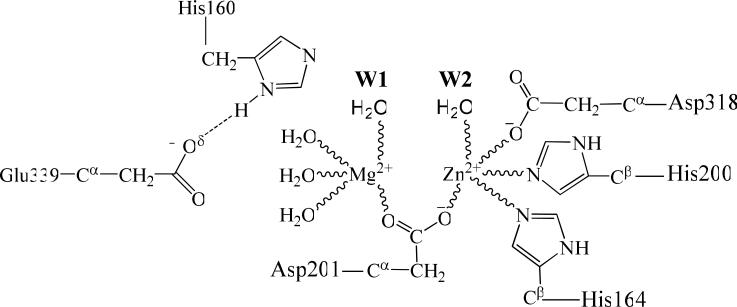
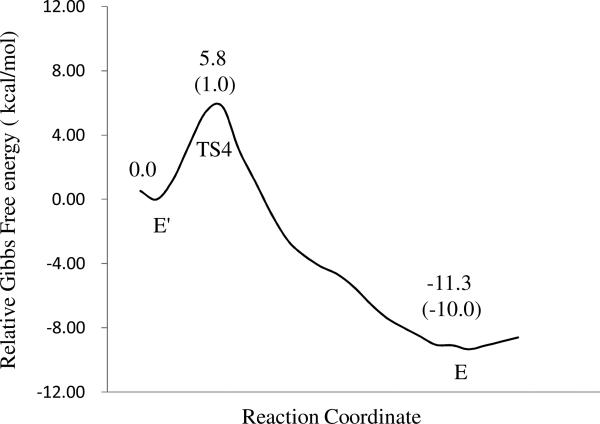
After the hydrolysis product AMP leaves the active site, water molecules from outside will readily occupy the place left by the phosphoryl oxygen of AMP, and get coordinated to the metal ions (i.e. Zn2+ and Mg2+) in the active site. Depicted in scheme 2 is the binding mode in which two water molecules, i.e. W1 and W2, coordinated to the Mg2+ and Zn2+ ions, respectively. Based on the binding mode described in this scheme, we constructed an initial geometry from the E'P complex by replacing the AMP molecule with the water molecules. Then QM/MM optimization at the B3LYP/6-31G*:AMBER level was performed on the constructed geometries. During the energy minimization process, we found that the molecule W1 gradually moved toward Zn2+ ion and became closer to the Zn2+ ion with an Oω1...Zn distance of 3.06 Å (Figure 4B). Meanwhile, water molecule W2 gradually left the Zn2+ ion and moved toward His160 and water molecule W1. Finally, water molecule W2 stayed between the His160 side chain and water molecule W1, forming two strong hydrogen bonds with the Nε atom (Hω2...Nε distance: 1.68 Å) of His160 and with the Hω1 atom (Hω1...Oω2 distance: 1.62 Å) of water molecule W1 (Figure 4B). In the optimized structure of E' (Figure 4B), the Nε atom of His160 shows a strong tendency to extract the Hω2 from water molecule W2 and, in turn, water molecules W2 will extract the Hω1 atom from water molecule W1. The imaginary vibration mode of TS4 (Figure 4C) confirms the existence of such protons transfer. Furthermore, the imaginary mode of the transition state TS4 also indicates that the Nδ atom of His160 gradually donates a proton to the side chain of Glu339 during the reaction step. Water molecule W1 loses a proton after passing TS4 and is converted into a hydroxide ion. The negatively charged hydroxide ion is then attracted by the nearby Zn2+ ion and gradually coordinates to the Zn2+ ion. In the product structure (E, see Figure 4D) of this reaction, the bridging hydroxide ion has been regenerated and, thus, the structure of the enzyme is restored. Our present work demonstrates that a bounded water molecule can be activated into a bridging hydroxide ion in the presence of His160 and another water molecule.
Scheme 2.
Two water molecules bind with the metal ions in the active site after the hydrolysis product leaves.
It should be noted that our present study cannot completely exclude other possible pathways for the generation of hydroxide ion at the bridging position. For example, Asp318 may also extract a proton from the bridging water and pass the proton to His160.10 Nevertheless, in any event, our main interest is to find out the rate-determining step for PDE4-catalyzed cAMP hydrolysis, and in the following section we will demonstrate that the free energy barrier calculated for the hydroxide regeneration reaction according to the pathway investigated above is negligible compared to those calculated for the other steps, which clearly reveals that this reaction stage is rather fast and should not be rate-determining. For this reason, we did not try to explore alternative pathways for the hydroxide regeneration.
Energetics and kinetic parameters
Depicted in Figures 5 and 6 are the free energy profiles for the cAMP hydrolysis and regeneration of hydroxide ion in the active site, determined by the QM/MM-FE calculations at the B3LYP/6-31+G*:AMBER level excluding the zero-point and thermal corrections for the QM subsystem. The values given in parentheses are the corresponding relative free energies including the zero-point and thermal energy corrections for the QM subsystem. The zero-point and thermal energy corrections for the QM subsystem were based on the harmonic vibrational frequency calculations in which the Hessian matrix elements include the contributions from both the QM and MM atoms. In other words, the Hessian matrix calculated for the QM subsystem is a submatrix of the Hessian for all of the QM and MM atoms involved. Figure 5 also gives the binding free energies for the ES and E'P complex, determined by the QM/MM-PBSA calculations. As shown in Figure 5, with the zero-point and thermal corrections for the QM subsystem, the free energy barriers calculated for reaction steps 1 to 3 including nucleophilic attack of hydroxide ion, phosphate ring opening, and protonation of the leaving O3' atom are 6.5, 2.2, and 2.4 kcal/mol, respectively. The low free energy barriers for these steps demonstrate that these reaction steps should be very fast. Similarly, the free energy barrier for the reaction stage 2 (regeneration of bridging hydroxide ion) is as low as 1.0 kcal/mol, which is much lower than ones in reaction stage 1.
Figure 5.
Free energy profile for the cAMP hydrolysis stage of PDE4-catalyzed hydrolysis of cAMP. The relative free energies were determined by the QM/MM-FE calculations at the B3LYP/6-31+G*:AMBER level, excluding the zero-point and thermal corrections for the QM system. Values in the parentheses are the corresponding relative free energies including the zero-point and thermal corrections for the QM subsystem. Value in the bracket is the relative free energy between ES and E'P calculated by using the QM/MM-PBSA method. Binding free energies of ES and E'P complex are estimated with QM/MM(B3LYP/6-31+G*:AMBER)-PBSA method.
Figure 6.
Free energy profile for the bridging hydroxide ion regeneration reaction in the substrate-free PDE4 active site. The relative free energies were determined by the QM/MM-FE calculations at the B3LYP/6-31+G*:AMBER level, excluding the zero-point and thermal corrections for the QM system. Values in the parenthesis are the corresponding relative free energies including the zero-point and thermal corrections for the QM subsystem.
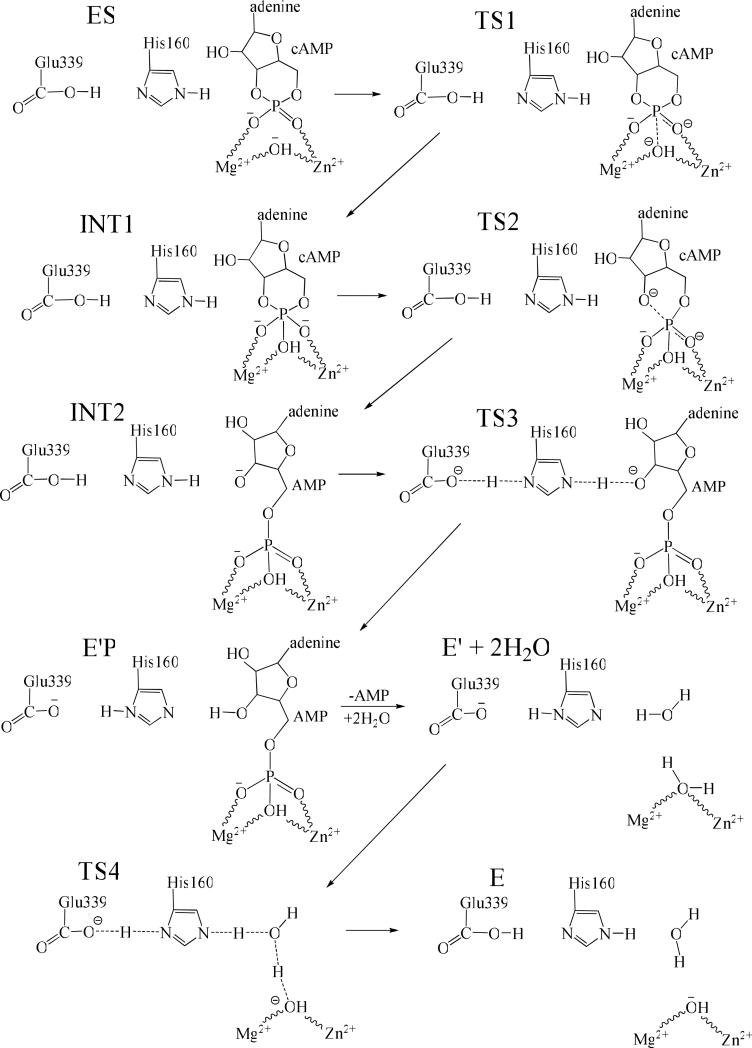
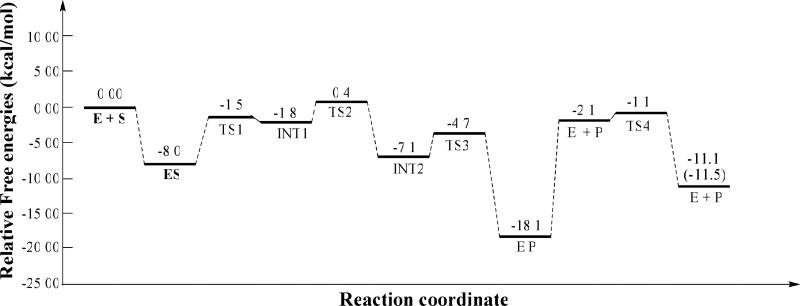
As seen from Figure 5, the dissociation free energy of E'P complex is calculated to be 16.0 kcal/mol. The dissociation free energy of E'P is the free energy difference between the free AMP and the AMP in the bound state, which should not be higher than the free energy barrier for AMP dissociation. Thus, our calculations predict that the free energy barrier for the AMP dissociation should not be lower than 16.0 kcal/mol. Thus, the AMP dissociation will be the rate-determining step for PDE4-catalyzed hydrolysis of cAMP. The conclusion obtained from the present study on PDE4-catalyzed hydrolysis of cAMP is consistent with previously reported kinetic experiment on PDE9-catalyzed hydrolysis of cGMP,15 in which the product dissociation was found to be rate-determining. Depicted in Figure 7 is the detailed reaction pathway for PDE4-catalyzed hydrolysis of cAMP revealed by this study. Figure 8 summaries the energetics for the entire PDE4-catalyzed cAMP hydrolysis process, including both the cAMP hydrolysis and hydroxide regeneration. The data present here illustrate the hydrolysis mechanism of PDE4. As all members of the PDE superfamily share a very similar catalytic site, the computational results obtained in the present study imply that the PDE-catalyzed hydrolysis of cAMP/cGMP by other PDEs could also follow the reaction mechanism uncovered in the present study.
Figure 7.
Reaction mechanism for the complete cycle of PDE4-catalyzed hydrolysis of cAMP. For clarity, residues His164, His200, Asp201, Asp 318, Asn321, and Gln859 are hidden from view.
Figure 8.
Relative Gibbs free energies of all states of the reaction system for PDE4-catalyzed hydrolysis of cAMP. Value (-11.5 kcal/mol) in the parenthesis refers to the experimental reaction free energy reported by Goldberg et al.42
Further, the kinetic experiments reveal that PDE4D has a KM of 1.5 μM and kcat of 3.9 s-1.40 According to the conventional transition state theory (CTST),41 a rate constant of 3.9 s-1 is associated with an activation free energy of 16.6 kcal/mol. The predicted activation free energy of ≥16.0 kcal/mol is in good agreement with the experimentally-derived value of 16.6 kcal/mol. Furthermore, the overall QM/MM-RE results depicted in Figure 8 predict that the reaction free energy for cAMP hydrolysis is -11.1 kcal/mol, which is also in excellent agreement with the experimental value of -11.5 kcal/mol.42
Finally, to validate the results obtained from the QM/MM-FE calculations, we also evaluated the free energy change from E + S (and ES) to E'P based on the aforementioned QM/MM-PBSA calculations. As seen in Figure 5, according to the QM/MM-PBSA calculations, the free energy change from E + S to E'P should be -19.1 kcal/mol, and the free energy change from ES to E'P should be -11.1 kcal/mol which is only 1.0 kcal/mol lower than the corresponding value (-10.1 kcal/mol for the free energy change from ES to E'P) determined by the QM/MM-FE calculations. The cross-validation between the QM/MM-FE and QM/MM-PBSA calculations suggests that the QM/MM-RE and QM/MM-PBSA results presented in the present study are reasonable. On the other hand, the free energy difference (1.0 kcal/mol) between the QM/MM-FE and QM/MM-PBSA results is slightly larger than the difference (0.4 kcal/mol) between the calculated and experimental reaction free energies, which means that the accuracy of the QM/MM-RE and QM/MM-PBSA calculations performed in the present study should not be better than 1.0 kcal/mol. Thus, the exceptionally good agreement between the calculated and experimental reaction free energy values (-11.1 kcal/mol versus -11.5 kcal/mol) might be partially due to certain type of error cancellation. Concerning the possible origin of the observed error cancellation, the reaction free energy for the entire enzymatic reaction is the sum of the free energy changes for multiple steps (including the enzyme-substrate binding, chemical reaction, and product leaving) as depicted in Figure 8. The computational errors for different steps could have different signs. Thus, the overall error of the calculated reaction free energy is subjected to the possible cancellation of computational errors for individual steps.
Conclusion
In the present work, we employed pseudobond first-principles QM/MM-FE approach to study the reaction pathway for PDE4-catalyzed hydrolyses of cAMP and the corresponding free energy profiles. The entire enzymatic reaction process consists of two reaction stages, i.e. the cAMP hydrolysis (stage 1) and regeneration of hydroxide ion in the substrate-free PDE4 active site (stage 2). The reaction stage 1 includes binding of cAMP with the active site of PDE4, nucleophilic attack of a hydroxide ion on phosphorous atom of cAMP in the active site, cleavage of 3'-phosphoesteric bond of cAMP, concerted double-proton transfer from Nε atom of His 160 to O3' atom of cAMP and from Oδ of Glu 339 to Nδ of the His 160, and dissociation of the hydrolysis product AMP from the active site. The reaction stage 2 includes binding of solvent water molecules with the active site and the regeneration of hydroxide ion in the active site. The dissociation of AMP from the active site of PDE4 is found to be rate-determining, which is consistent with kinetic experiment on PDE9-catalyzed hydrolysis of cGMP in which the product dissociation was found to be rate-determining.
Further, the computational results predict the activation free energy and reaction free energy for PDE4-catalyzed cAMP hydrolysis reaction should be ≥16.0 and -11.1 kcal/mol, respectively. The computational predictions are in good agreement with the experimentally-derived activation free energy of 16.6 kcal/mol and reaction free energy of -11.5 kcal/mol, suggesting that the reaction mechanism uncovered in the present computational study is reliable.
Acknowledgments
This work was supported in part by National Institutes of Health (grant RC1MH088480), National Science Foundation (grant CHE-1111761), National Natural Science Foundation of China (grants No. 20602014, 20503008, and 20372023), and the Special Fund for Basic Scientific Research of Central Colleges, South-Central University for Nationalities (grant CZY11004). Chen and Zhao worked in Zhan's laboratory for this project as visiting scientists. The entire research was performed at the University of Kentucky. The authors also acknowledge the Center for Computational Sciences (CCS) at University of Kentucky for supercomputing time on an IBM X-series Supercomputer Cluster with 340 nodes or 1,360 processors and a Dell Supercomputer Cluster consisting of 388 nodes or 4,816 processors.
References
- 1.Callahan SM, Cornell NW, Dunlap PV. J. Biol. Chem. 1995;270(29):17627–17632. doi: 10.1074/jbc.270.29.17627. [DOI] [PubMed] [Google Scholar]
- 2.Xu RX, Hassell AM, Vanderwall D, Lambert MH, Holmes WD, Luther MA, Rocque WJ, Milburn MV, Zhao YD, Ke HM, Nolte RT. Science. 2000;288(5472):1822–1825. doi: 10.1126/science.288.5472.1822. [DOI] [PubMed] [Google Scholar]
- 3.Ke HM, Wang HC. Curr. Top. Med. Chem. 2007;7(4):391–403. doi: 10.2174/156802607779941242. [DOI] [PubMed] [Google Scholar]
- 4.Conti M, Jin SLC, Monaco L, Repaske DR, Swinnen JV. Endocr. Rev. 1991;12(3):218–234. doi: 10.1210/edrv-12-3-218. [DOI] [PubMed] [Google Scholar]
- 5.Teixeira MM, Gristwood RW, Cooper N, Hellewell PG. Trend. Pharmacol. Sci. 1997;18(5):164–170. doi: 10.1016/s0165-6147(97)01049-3. [DOI] [PubMed] [Google Scholar]
- 6.Houslay MD, Sullivan M, Bolger GB. Adv. Pharmacol. 1998;44:225–342. doi: 10.1016/s1054-3589(08)60128-3. [DOI] [PubMed] [Google Scholar]
- 7.Huai Q, Colicelli J, Ke HM. Biochemistry. 2003;42(45):13220–13226. doi: 10.1021/bi034653e. [DOI] [PubMed] [Google Scholar]
- 8.Huai Q, Liu YD, Francis SH, Corbin JD, Ke HM. J. Biol. Chem. 2004;279(13):13095–13101. doi: 10.1074/jbc.M311556200. [DOI] [PubMed] [Google Scholar]
- 9.Zhan C-G, Zheng F. J. Am. Chem. Soc. 2001;123(12):2835–2838. doi: 10.1021/ja005529a. [DOI] [PubMed] [Google Scholar]
- 10.Xiong Y, Lu HT, Li YJ, Yang GF, Zhan C-G. Biophys. J. 2006;91(5):1858–1867. doi: 10.1529/biophysj.106.086835. [DOI] [PMC free article] [PubMed] [Google Scholar]
- 11.Xiong Y, Lu HT, Zhan C-G. J. Comput. Chem. 2008;29(8):1259–1267. doi: 10.1002/jcc.20888. [DOI] [PubMed] [Google Scholar]
- 12.Lu HT, Goren AC, Zhan C-G. J. Phys. Chem. B. 2010;114(20):7022–7028. doi: 10.1021/jp911527y. [DOI] [PMC free article] [PubMed] [Google Scholar]
- 13.Yang GF, Lu HT, Xiong Y, Zhan C-G. Bioorgan. Med. Chem. 2006;14(5):1462–1473. doi: 10.1016/j.bmc.2005.09.073. [DOI] [PubMed] [Google Scholar]
- 14.Salter EA, Wierzbicki A. J. Phys. Chem. B. 2007;111(17):4547–4552. doi: 10.1021/jp066582+. [DOI] [PubMed] [Google Scholar]
- 15.Liu SP, Mansour MN, Dillman KS, Perez JR, Danley DE, Aeed PA, Simons SP, LeMotte PK, Menniti FS. Proc. Natl. Acad. Sci. U.S.A. 2008;105(36):13309–13314. doi: 10.1073/pnas.0708850105. [DOI] [PMC free article] [PubMed] [Google Scholar]
- 16.Zhang KYJ, Card GL, Suzuki Y, Artis DR, Fong D, Gillette S, Hsieh D, Neiman J, West BL, Zhang C, Milburn MV, Kim SH, Schlessinger J, Bollag G. Mol. Cell. 2004;15(2):279–286. doi: 10.1016/j.molcel.2004.07.005. [DOI] [PubMed] [Google Scholar]
- 17.Zhang YK. J. Chem. Phys. 2005;122(2):0241141–0241147. doi: 10.1063/1.1834899. [DOI] [PubMed] [Google Scholar]
- 18.Zhang YK, Lee TS, Yang WT. J. Chem. Phys. 1999;110(1):46–54. [Google Scholar]
- 19.Hu P, Zhang YK. J. Am. Chem. Soc. 2006;128(4):1272–1278. doi: 10.1021/ja056153+. [DOI] [PubMed] [Google Scholar]
- 20.Zhang YK, Liu HY, Yang WT. J. Chem. Phys. 2000;112(8):3483–3492. [Google Scholar]
- 21.Zhang YK. Theor. Chem. Acc. 2006;116(1-3):43–50. [Google Scholar]
- 22.Zheng F, Yang WC, Ko MC, Liu JJ, Cho H, Gao DQ, Tong M, Tai HH, Woods JH, Zhan C-G. J. Am. Chem. Soc. 2008;130(36):12148–12155. doi: 10.1021/ja803646t. [DOI] [PMC free article] [PubMed] [Google Scholar]
- 23.Liu JJ, Hamza A, Zhan C-G. J. Am. Chem. Soc. 2009;131(33):11964–11975. doi: 10.1021/ja903990p. [DOI] [PMC free article] [PubMed] [Google Scholar]
- 24.Liu JJ, Zhang YK, Zhan C-G. J. Phys. Chem. B. 2009;113(50):16226–16236. doi: 10.1021/jp9055335. [DOI] [PMC free article] [PubMed] [Google Scholar]
- 25.Liu HY, Zhang YK, Yang WT. J. Am. Chem. Soc. 2000;122(28):6560–6570. [Google Scholar]
- 26.Zhang YK, Kua J, McCammon JA. J. Am. Chem. Soc. 2002;124(35):10572–10577. doi: 10.1021/ja020243m. [DOI] [PubMed] [Google Scholar]
- 27.Poyner RR, Larsen TM, Wong SW, Reed GH. Arch. Biochem. Biophys. 2002;401(2):155–163. doi: 10.1016/S0003-9861(02)00024-3. [DOI] [PubMed] [Google Scholar]
- 28.Cisneros GA, Wang M, Silinski P, Fitzgerald MC, Yang WT. Biochemistry. 2004;43(22):6885–6892. doi: 10.1021/bi049943p. [DOI] [PubMed] [Google Scholar]
- 29.Metanis N, Brik A, Dawson PE, Keinan E. J. Am. Chem. Soc. 2004;126(40):12726–12727. doi: 10.1021/ja0463841. [DOI] [PubMed] [Google Scholar]
- 30.Frisch MJ, Trucks GW, Schlegel HB, Scuseria GE, Robb MA, Cheeseman JR, Montgomery J,JA, Vreven T, Kudin KN, Burant JC, Millam JM, Iyengar SS, Tomasi J, Barone V, Mennucci B, Cossi M, Scalmani G, Rega N, Petersson GA, Nakatsuji H, Hada M, Ehara M, Toyota K, Fukuda R, Hasegawa J, Ishida M, Nakajima T, Honda Y, Kitao O, Nakai H, Klene M, Li X, Knox JE, Hratchian HP, Cross JB, Bakken V, Adamo C, Jaramillo J, Gomperts R, Stratmann RE, Yazyev O, Austin AJ, Cammi R, Pomelli C, Ochterski JW, Ayala PY, Morokuma K, Voth GA, Salvador P, Dannenberg JJ, Zakrzewski VG, Dapprich S, Daniels AD, Strain MC, Farkas O, Malick DK, Rabuck AD, Raghavachari K, Foresman JB, Ortiz JV, Cui Q, Baboul AG, Clifford S, Cioslowski J, Stefanov BB, Liu G, Liashenko A, Piskorz P, Komaromi I, Martin RL, Fox DJ, Keith T, Al-Laham MA, Peng CY, Nanayakkara A, Challacombe M, Gill PMW, Johnson B, Chen W, Wong MW, Gonzalez C, Pople JA. Gaussian 03, Revision C.02. Gaussian, Inc.; Wallingford CT: 2004. [Google Scholar]
- 31.Cieplak P, Cornell WD, Bayly C, Kollman PA. J. Comput. Chem. 1995;16(11):1357–1377. [Google Scholar]
- 32.Bayly CI, Cieplak P, Cornell WD, Kollman PA. J. Phys. Chem. 1993;97(40):10269–10280. [Google Scholar]
- 33.Jorgensen WL, Chandrasekhar J, Madura JD, Impey RW, Klein ML. J. Chem. Phys. 1983;79(2):926–935. [Google Scholar]
- 34.Case DA, Darden TA, T.E. Cheatham I, Simmerling CL, Wang J, Duke RE, Luo R, Merz KM, Wang B, Pearlman DA, Crowley M, Brozell S, Tsui V, Gohlke H, Mongan J, Hornak V, Cui G, Beroza P, Schafmeister C, Caldwell JW, Ross WS, Kollman PA. AMBER 8. University of California; San Francisco: 2004. [Google Scholar]
- 35.Gilson MK, Sharp KA, Honig BH. J. Comput. Chem. 1988;9(4):327–335. [Google Scholar]
- 36.Jayaram B, Sharp KA, Honig B. Biopolymers. 1989;28(5):975–993. doi: 10.1002/bip.360280506. [DOI] [PubMed] [Google Scholar]
- 37.Sanner MF, Olson AJ, Spehner JC. Biopolymers. 1996;38(3):305–320. doi: 10.1002/(SICI)1097-0282(199603)38:3%3C305::AID-BIP4%3E3.0.CO;2-Y. [DOI] [PubMed] [Google Scholar]
- 38.Pan YM, Gao DQ, Zhan C-G. J. Am. Chem. Soc. 2008;130(15):5140–5149. doi: 10.1021/ja077972s. [DOI] [PMC free article] [PubMed] [Google Scholar]
- 39.Raha K, Merz KM. J. Med. Chem. 2005;48(14):4558–4575. doi: 10.1021/jm048973n. [DOI] [PubMed] [Google Scholar]
- 40.Wang HC, Liu YD, Chen YX, Robinson H, Ke HM. J. Biol. Chem. 2005;280(35):30949–30955. doi: 10.1074/jbc.M504398200. [DOI] [PubMed] [Google Scholar]
- 41.Alvarez-Idaboy JR, Galano A, Bravo-Perez G, Ruiz ME. J. Am. Chem. Soc. 2001;123(34):8387–8395. doi: 10.1021/ja010693z. [DOI] [PubMed] [Google Scholar]
- 42.Goldberg RN, Tewari YB. J. Chem. Thermodyn. 2003;35(11):1809–1830. [Google Scholar]


