The transformation of normally soluble polypeptides and proteins into amyloid fibers has proven a central characteristic of many human diseases, including type II diabetes, Alzheimer’s, Parkinson’s, and Huntington’s disease. A number of studies have suggested parallel mechanisms for fibril formation, and several have implicated intermediate structures such as α-helices and α-sheets in the aggregation process.1–3 To track fiber formation kinetics and identify possible intermediates, experimental studies mostly rely on fluorescence by dyes that bind to the folded amyloid or circular dichroism (CD) spectroscopy.2,3 These techniques offer only limited information about the structural changes that occur over the course of the aggregation process. Furthermore, CD spectroscopy is prone to error because it is necessary to deconvolute the spectra to assess individual secondary structures, as they all absorb in the same wavelength range. Two-dimensional infrared (2D-IR) spectroscopy has the potential to improve our structural knowledge of amyloid formation due to its increased capacity to resolve protein secondary structures and its intrinsically fast time resolution.
Unlike CD spectroscopy, peptide secondary structures generate unique features in 2D-IR spectra that can be used to independently monitor kinetics and discover intermediates. Despite this inherent advantage, there are two impediments to applying 2D-IR spectroscopy to amyloid fiber formation. First, amyloid fibers scatter light, which creates a large background signal. Second, the aggregation kinetics of amyloids are not perfectly reproducible, so that the most common way of collecting transient 2D-IR spectra (in which the signal is averaged over many hundreds of experiments) cannot be applied to amyloids. We overcome these two hurdles by using a mid-infrared pulse shaper to automate data collection.4,5 Our method allows us to subtract scatter from the signal by rotating the phases of the pulses in the pulse train. Furthermore, since our spectrometer has no moving parts, an entire 2D-IR spectrum can be collected in <1 s. Thus, we can now directly follow fiber formation by continuously scanning 2D-IR spectra and then performing a running average for optimal signal-to-noise. In this communication, we apply automated 2D-IR spectroscopy to follow the formation of amyloid fibers in the 37-residue human islet amyloid polypeptide (hIAPP), a peptide associated with type II diabetes.
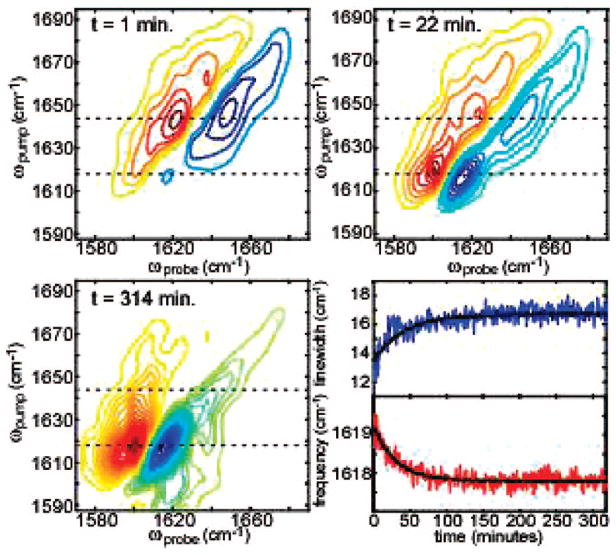
Three representative 2D-IR spectra, generated from many thousands of spectra collected during fibril formation, are shown in Figure 1. In 2D-IR spectra, vibrational modes appear as doublets because both the fundamental frequency and its sequence band are probed. At the earliest times in the aggregation process, the two most intense features in the 2D-IR spectra are a set of out-of-phase doublets with the negative peak at ωpump = ωprobe = 1644 cm−1 and an on-diagonal line width of 22 cm−1. The frequency and broad line width indicate that the peptides are predominantly random coil with a wide distribution of structures. As aggregation proceeds, these features give way to a doublet at ωpump = ωprobe = 1618 cm−1 with a line width of 15 cm−1 that is created by the antisymmetric stretch of the β-sheet amyloids.6 A weak doublet, due to the β-sheet symmetric stretch, appears at 1673 cm−1. Intensity between 1618 and 1673 cm−1 is caused by β-turns and residues 1–8 which do not have regular β-sheet structure in the fully folded fiber.7
Figure 1.
Three representative 2D-IR spectra at times t = 1, 22, and 314 min over the course of the aggregation process. Line width and frequency of the 1618 cm−1 antisymmetric β-sheet feature are shown (bottom right, upper and lower panel, respectively). Red contours are positive.
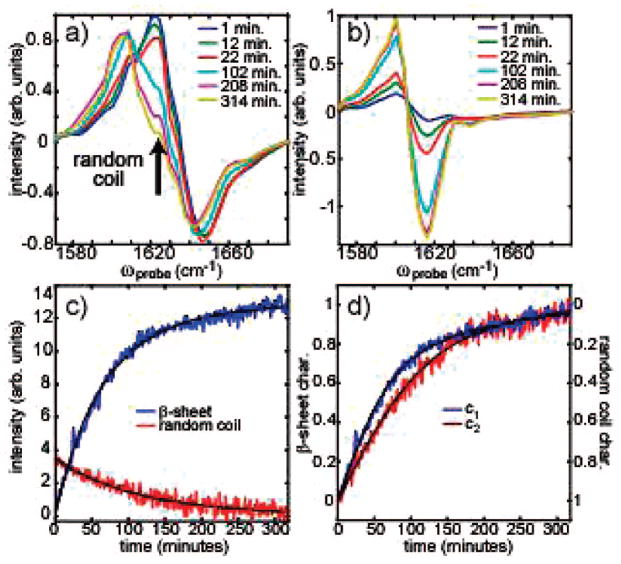
We have identified two features in the 2D-IR spectra that allow the random coil and β-sheet populations to be monitored without the need for deconvolution. In Figure 2, slices along ωpump = 1644 and 1618 cm−1 are shown that best illustrate how one conformation can be monitored independently from the other (dashed lines in Figure 1). To monitor the population of the random coil, we watch its off-diagonal sequence peak, marked with a black arrow in Figure 2a. At this position, β-sheet structures contribute negligibly, as can be seen at t = 314 min, when the fibers are fully formed and the intensity of this off-diagonal peak has gone to zero. The β-sheet population can be monitored by either feature in the doublet that appears in the ωpump = 1618 cm−1 slice (Figure 2b). The kinetics of these two points are shown in Figure 2c. The random coil kinetics fit very well to a single exponential with a time constant of 112 ± 13 min, whereas the β-sheet kinetics require a biexponential fit. When one of the time constants of the biexponential is held at 112 min, the second exponential has a time constant of 44 ± 4 min (with a 60% amplitude). For comparison, we simultaneously measured fluorescence using Thioflavin-T and FTIR spectroscopy (see Supporting Information).
Figure 2.
(a,b) Slices taken through the 2D-IR spectra for ωpump = 1618 and 1644 cm−1, respectively. (c) The absolute intensity of the antisymmetric β-sheet feature is plotted against the absolute intensity of the random coil, sequence band feature (red arrow, panel a) for aggregation at 295 K. (d) Intensities from the two-component fits are plotted as a function of time.
The 2D-IR spectra track β-sheet nucleation and elongation in other ways, as well. Shown in Figure 1 (lower right) is a plot of the frequency and on-diagonal line width of the antisymmetric β-sheet peak. Calculations have shown that the splitting between the symmetric and antisymmetric stretches is indicative of β-sheet size. When the β-sheets first appear in the spectra, the splitting between the symmetric and antisymmetric stretches is about 54 cm−1 and the frequency of the antisymmetric stretch is 1619 cm−1. Over the course of the experiment, the frequency asymptotically approaches 1618 cm−1. According to simulations by Hahn et al.,8 the initial splitting corresponds to β-sheets with 7–8 strands, while the frequency shift indicates that the sheets grow by about one strand. The intensity of the β-sheet doublet continues to grow as the fibers elongate (Figure 2c), but the frequency is not sensitive to larger sizes because the vibrational Hamiltonian is altered very little by additional strands. We attribute the increase in the β-sheet line width to dehydration of the β-sheets in the inner core of the fiber. The hIAPP fibril structure has recently been reported and consists of four stacked β-sheets of about equal size.7 The inner two sheets are protected from solvent and thus will have amide I frequencies 5–10 cm−1 higher in frequency. Because the shift is insufficient to resolve the individual β-sheets, stacking will appear as an increase in the line width. The frequency shift and line width changes both fit to a single exponential of 35 ± 10 min. In principle, the frequency and on-diagonal line width can be extracted from FTIR spectra, as well, but in practice, it is much more difficult because the secondary structure features are not as well resolved (see Supporting Information).
To further investigate the aggregation kinetics, we independently fit 360 of the 2D-IR spectra to test how closely aggregation follows a two-state model. Each spectrum was fit to a weighted sum of the first and last spectra, c1Sfirst + c2Slast. Since the first spectrum is of denatured peptides and the last is of fully formed fibers, Sfirst and Slast represent the random coil and β-sheet secondary structures, respectively. Figure 2d plots the changes in c1 and c2, which were allowed to independently vary between 0 and 1. We have reversed the y-axis of the c1 coefficient to highlight the fact that the β-sheet grows in faster than the random coil disappears and that at intermediate times the coefficients sum to larger than unity.
The larger than unity sum suggests that hIAPP aggregation does not follow two-state kinetics. This conclusion is also supported by the finding that the frequency, line width, and intensity of the β-sheets all have similar time constants that are significantly shorter than the disappearance of the random coil. In this case, one would expect to observe intermediate structures in the spectra. We searched for transient structures by looking at the residuals of the 2D-IR spectra from the two-state fits but did not find any spectral features above the signal-to-noise that were not already accounted for by the frequency or line width changes. We conclude that, if an intermediate with a secondary structure other than β-sheet is present, it cannot have a population larger than about 10% at any time during the fiber formation process.
In this paper, we have identified a number of features in 2D-IR spectra that can be used to track different secondary structural elements during amyloid formation without error-prone deconvolution. We did not see evidence for secondary structures other than β-sheet and random coil, but intermediate structures are probably most populated during the lag phase.3 Under our current sample conditions, we have little or no lag phase. However, we do observe a set of narrow doublets at ωpump = 1660 cm−1 in the earliest 2D-IR spectra (Figure 1a) that are under further investigation. β-Sheets with less than four strands, side chains, α-helices, and α-sheets can in principle all produce similar features. Since 2D-IR spectra can be computed from molecular dynamics simulations,9,10 these experiments provide a way to test simulations and proposed aggregation mechanisms. The comparison will be especially insightful when 2D-IR aggregation experiments have been performed using isotope labels11 to resolve the kinetics of individual residues, when smaller peptide fragments have been studied that are more tractable for MD simulations, and when analogous experiments have been performed in membranes, which catalyze amyloid formation.
Supplementary Material
Acknowledgments
This work was supported by the National Institutes of Health (R01DK79895) and the Packard Foundation.
Footnotes
Supporting Information Available: Sample preparation, data collection, and analysis methods are described in further detail. This material is available free of charge via the Internet at http://pubs.acs.org.
References
- 1.Soto C. Nat Rev Neurosci. 2003;4:49–60. doi: 10.1038/nrn1007. [DOI] [PubMed] [Google Scholar]
- 2.Jayasinghe SA, Langen R. Biochemistry. 2005;44:12113–12119. doi: 10.1021/bi050840w. [DOI] [PubMed] [Google Scholar]
- 3.Knight JD, Hebda JA, Miranker AD. Biochemistry. 2006;45:9496–9508. doi: 10.1021/bi060579z. [DOI] [PubMed] [Google Scholar]
- 4.Shim SH, Strasfeld DB, Fulmer EC, Zanni MT. Opt Lett. 2006;31:838–840. doi: 10.1364/ol.31.000838. [DOI] [PubMed] [Google Scholar]
- 5.Shim SH, Strasfeld DB, Ling YL, Zanni MT. Proc Natl Acad Sci USA. 2007;104:14197–14202. doi: 10.1073/pnas.0700804104. [DOI] [PMC free article] [PubMed] [Google Scholar]
- 6.Demirdoven N, Cheatum CM, Chung HS, Khalil M, Knoester J, Tokmakoff A. J Am Chem Soc. 2004;126:7981–7990. doi: 10.1021/ja049811j. [DOI] [PubMed] [Google Scholar]
- 7.Luca S, Yau WM, Leapman R, Tycko R. Biochemistry. 2007;46:13505–13522. doi: 10.1021/bi701427q. [DOI] [PMC free article] [PubMed] [Google Scholar]
- 8.Hahn S, Kim SS, Lee C, Cho MJ. Chem Phys. 2005:123. doi: 10.1063/1.1997151. [DOI] [PubMed] [Google Scholar]
- 9.Zhuang W, Abrarnavicius D, Voronine DV, Mukarmel S. Proc Natl Acad Sci USA. 2007;104:14233–14236. doi: 10.1073/pnas.0700392104. [DOI] [PMC free article] [PubMed] [Google Scholar]
- 10.Kwac K, Cho MH. J Chem Phys. 2003;119:2256–2263. [Google Scholar]
- 11.Petty SA, Decatur SM. J Am Chem Soc. 2005;127:13488–13489. doi: 10.1021/ja054663y. [DOI] [PubMed] [Google Scholar]
Associated Data
This section collects any data citations, data availability statements, or supplementary materials included in this article.


