Abstract
Binding affinity optimization is critical during drug development. Here we evaluate the thermodynamic consequences of filling a binding cavity with functionalities of increasing van der Waals radii (-H, -F, -Cl and CH3) that improve the geometric fit without participating in hydrogen bonding or other specific interactions. We observe a binding affinity increase of two orders of magnitude. There appears to be three phases in the process. The first phase is associated with the formation of stable van der Waals interactions. This phase is characterized by a gain in binding enthalpy and a loss in binding entropy, attributed to a loss of conformational degrees of freedom. For the specific case presented in this paper, the enthalpy gain amounts to −1.5 kcal/mol while the entropic losses amount to +0.9 kcal/mol resulting in a net 3.5-fold affinity gain. The second phase is characterized by simultaneous enthalpic and entropic gains. This phase improves the binding affinity 25-fold. The third phase represents the collapse of the trend and is triggered by the introduction of chemical functionalities larger than the binding cavity itself (CH(CH3)2). It is characterized by large enthalpy and affinity losses. The thermodynamic signatures associated with each phase provide guidelines for lead optimization.
Keywords: Binding Affinity, Halogens, Enthalpy, Entropy, Thermodynamic Optimization, Isothermal Titration Calorimetry
INTRODUCTION
In drug development, the binding affinity of early leads needs to be improved by five orders of magnitude or more (1-3). This optimization process is usually accomplished by chemically modifying the parent molecule, and evaluating the effects of those modifications on the activity of the resulting compounds. Since chemical compounds can be modified in many different ways, it would be advantageous to anticipate the magnitude of the gains that can be expected at specific locations. In this paper, we consider the affinity gains obtained by filling a binding cavity with chemical functionalities that progressively improve the geometric fit, but without participating in hydrogen bonding or other specific interaction.
The role of halogen substitutions has been extensively discussed in the literature. Different authors have found that Kd or IC50 values improve up to a point in which a further increase in van der Waals radius brings a significant decrease in affinity (4-13). The breaking point occurs at different van der Waals radii (i.e. substituent), depending on the protein suggesting that it may be related with the volume of the binding cavity and its ability to accommodate a larger group without being disrupted. In general, Kd or IC50 values can vary by up to two orders of magnitude.
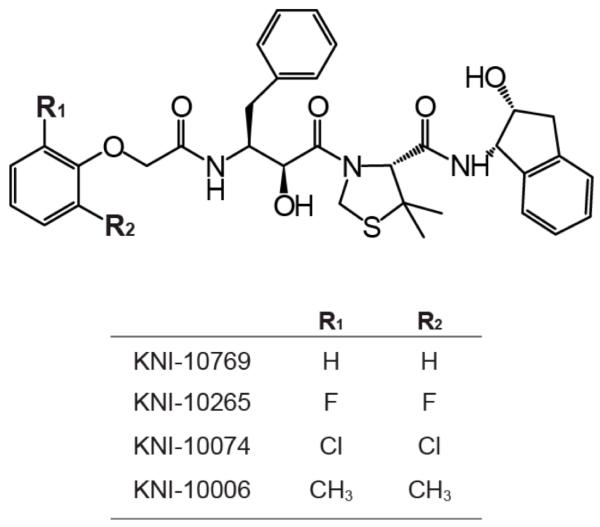
For these studies we have selected a series of aspartic protease inhibitors from the KNI series (14-18) (Figure 1) that differ only by the presence of different ortho substitutions in a benzyl ring. This ring is buried in a cavity of the HIV-1 protease molecule in which the ortho substituents are located in a mostly hydrophobic environment. The cavity was filled by using -H, -F, -Cl and -CH3 as ortho substituents, moieties of progressively increasing van der Waals radii. The binding thermodynamics of the four compounds was determined by isothermal titration calorimetry. The crystallographic structures of the complex of three of the inhibitors (-F, -Cl and -CH3 substituted) with the HIV-1 protease were determined at 1.80 Å, 2.20 Å, and 1.66 Å resolution, respectively.
Figure 1.
The chemical structures of the HIV-1 protease inhibitors used in these studies.
METHODS AND MATERIALS
Protein purification
HIV-1 protease was prepared as described in previous papers (19-21). The gene encoding the HIV-1 protease wild type, with three autocatalytic sites protected (Q7K/L33I/L63I) (22), was placed in the pET24 vector (Novagen, La Jolla, CA, USA). The HIV-1 protease containing these three mutations is referred to as HIV-1 protease pseudo-wild type (pWT) and has been shown to exhibit the same catalytic behavior as the wild type (22). Protease was expressed as inclusion bodies under the control of the P7 promoter in Escherichia coli BL21(DE3) cells. Once an OD600 of the culture reached to 1.5 or greater, the expression was induced by the addition of isopropyl β-D-1-thiogalactopuranoside (IPTG) to a final concentration of 1mM followed by incubation at a temperature of 37°C for at least four hours.
After harvesting cells by centrifugation for 10 min at 8000 × g and 4°C, the cell pellet was resuspended in extraction buffer [20 mM Tris, 1 mM EDTA, and 10 mM β-mercaptoethanol (BME), pH 7.5]. The cells were broken with at least three passes though a French pressure cell (≥ 1600 psi) at 4°C. Cell debris and protease-containing inclusion bodies were then subjected to four cycles of centrifugation (20 000 × g for 20 min at 4°C) and resuspension in buffer with a glass homogenizer. In each cycle a different buffer was applied for resuspension/solubilization: buffer 1 (25 mM Tris, 2.5 mM EDTA, 0.5 M NaCl, 1 mM Gly-Gly, 50 mM BME, pH 7.0); buffer 2 (25 mM Tris, 2.5 mM EDTA, 0.5 M NaCl, 1 mM Gly-Gly, 50 mM BME, 1 M urea, pH 7.0); buffer 3 (25 mM Tris, 1 mM EDTA, 1 mM Gly-Gly, 50 mM BME, pH 7.0). For the fourth cycle, the temperature of centrifugation was raised to 25°C and the pellet was suspended in 25 mM Tris, 1 mM EDTA, 5 mM NaCl, 1 mM Gly-Gly, 50 mM BME, 9 M urea, pH 9.0 (buffer 4). HIV-1 protease present in the supernatant was purified using a Q-sepharose column (Q-Sepharose, Amersham Biosciences AB, Uppsala, Sweden) previously equilibrated with buffer 4. Pooled flow-through fractions containing the protease were acidified by the addition of formic acid to a final concentration of 25 mM. After an overnight incubation at 4°C, precipitated contaminants were removed by centrifugation (20 000 × g for 20 min at 4°C), and the protease was then concentrated by the use of an Amicon Ultra centrifugal filter device (Millipore, Billerica, MA) to a final volume of approximately 2 mL.
The protein refolding was initiated by 20-fold stepwise dilution of the concentrated protease sample into 10 mM formic acid at 0°C. The pH was adjusted to approximately 3.8 with 0.1 M NaOH, and the temperature was then immediately raised to 25 °C. Sodium acetate buffer (2.5 M, pH 5.5) was added to increase the pH to 5.0, and the protein was concentrated to approximately 2.5 mL. The buffer was then exchanged by passing the folded protease solution over PD-10 desalting column (Amersham Bioscience, Uppsala, Sweden) equilibrated with 1 mM sodium acetate, 2 mM NaCl at pH 5.0. The protein was stored at −20 °C at a concentration of ≥ 2.5 mg/ml without loss of activity.
The purity of the enzyme was confirmed by SDS-PAGE, and the active concentration of protein was assessed by active site titration with well-characterized inhibitors (Amprenavir, Atazanavir, and TMC-114) as described previously (19, 23).
Protease Inhibitors
Compounds KNI-10265, KNI-10074, and KNI-10006 and their synthesis have been described before (14, 15, 18). Compound KNI-10769 was synthesized in an similar manner as KNI-10006, −10074 and −10265 (15, 18). Briefly, KNI-10769 was prepared by standard Boc-protected liquid phase peptide synthesis in which (1S,2R)-1-amino-2-indanol was coupled with N-Boc-protected (R)-5,5-dimethyl-1,3-thiazolidine carboxylicacid using benzotriazol-1-yloxy-tris(dimethylamino)phosphonium hexafluorophosphate (BOP) and Et3N in DMF; followed by Boc-deprotection with 4N HCl/dioxane and anisole; coupling with N-Boc-protected (2S,3S)-3-amino-2-hydroxy-4-phenylbutyric acid using N-ethyl-N’-[3-(dimethylamino)propyl]carbodiimide hydrochloride (EDC), 1-hydroxybenzotriazole (HOBt) and Et3N in DMF; subsequent Boc-deprotection with HCl; and BOP coupling with phenoxyacetic acid. After HPLC purification, KNI-10769 was >98% pure by analytical HPLC, and its identity was confirmed by ESI-Q MS and TOF MS.
Isothermal titration calorimetry
Isothermal titration calorimetry (ITC) experiments were performed with a high precision VP-ITC titration calorimetric system (MicroCal LLC, Northampton, MA). Inhibitors (KNI-10769, KNI-10265, KNI-10074, and KNI-10006) and the protein were dissolved in the same buffer.
The buffer used in experiments involving KNI-10769, KNI-10265, and KNI-10074 was 10 mM sodium acetate, pH 5.0, 2% DMSO v/v. For the experiment with KNI-10006, the same buffer with 3% of DMSO was employed because of its limited solubility in 2% DMSO.
The binding enthalpies were obtained by injecting the inhibitors (30-90 μM) into the calorimetric cell containing the protein (final protein concentration 5-10 μM dimer). The solutions were thoroughly degassed under vacuum and each experiment was performed by one injection of 3 μL followed by 28 injections of 10 μL with a 400 s interval between each injection. The inhibitor concentration was adjusted from stoichiometry determination with a standardized protease solution. The heat evolved after each injection was obtained from the integration of the calorimetric signal using ORIGIN 5.0 (Microcal Software, Inc., Northampton, MA), and the data were analyzed as described previously (24).
The binding affinities of KNI-10265, KNI-10074, and KNI-10006 were determined by using the displacement titration method, because of their high-affinities. In this method, the protease prebound to acetyl pepstatin is titrated by inhibitor (19, 25, 26). Data were analyzed by software developed in this laboratory as describedbefore (27).
Crystallization
Crystals were grown by the hanging drop vapor diffusion method. HIV-1 protease at a concentration of 6 mg/mL in 1 mM sodium acetate pH 5.0, 2 mM NaCl, was mixed with the inhibitor dissolved in 100% DMSO at a concentration of 15 mM to a final inhibitor to protease ratio of 2:1. The mixture was incubated on ice for 1 h and then any precipitated inhibitor was removed by centrifugation. Drops were prepared by combining 3 μL protein/inhibitor solution and 3 μL of reservoir solution. The drops were equilibrated against a volume of 1 mL of reservoir solution: citrate buffer pH 7.2, 100 mM DTT, 3mM NaN3 and 250 mM and 750 mM NaCl for the complexes HIV-1 protease pWT/KNI-10265 and pWT/KNI-10074, respectively. Citrate buffer pH 6.2, NaCl 500 mM, 100 mM DTT, 3mM NaN3 were used for the complex with KNI-10006.
Data Collection, Structure Determination and Refinement
The crystals were washed in a cryoprotectant solution of mother liquor made 20-25% in glycerol and then frozen under a liquid nitrogen stream. All data were collected at 100 K, using Cu-Kα radiation from a rotating anode source and an R-AXIS IV image plate detector (Rigaku, The Woodlands, TX, USA). All data were indexed, integrated, and scaled using the HKL software suite (28). The program AMoRe (29) as implemented in the CCP4 crystallographic software suite (30) was used to obtain the initial structures by molecular replacement. The PDB 1MSM (with neither inhibitor nor water molecules) was used as the search model and AMoRe provided a clear solution for all complexes. The program SKETCHER in CCP4 was used to build the initial inhibitors structures and to generate the corresponding library files. The inhibitors structures were placed into the protease initial models and rebuild to fit the electron density using program O (31). The models underwent rounds of rebuilding and refinement using the programs O and REFMAC5 (32). Translation, libration and screw rotation (TLS) anisotropic refinement of rigid bodies was carried out for the pWT/KNI-10074 structure using chains A and B as a TLS groups (33). Waters were added using the program ARP/WARP (34).
Coordinates
Coordinates for structures pWT/KNI-10265, pWT/KNI-10074 and pWT/KNI-10006 from the final cycle of refinements were deposited in the Protein Data Bank (accession numbers 3KDD, 3KDC and 3KDB, respectively).
Structural analysis
Hydrogen atoms were added to the crystallographic structure using the program Chimera (35). The crystallographic structures were minimized with the program MOE using the CHARMM 22 force field (36). All heavy atoms were restrained, and the positions of the hydrogen were minimized until the gradient of the energy was less than 10−3 kcal mol−1 A−1. Program Chimera was used to perform hydrogen bond calculations. For different inhibitors, it has been found that either Asp 25A or Asp 25B in the protease dimer can be protonated (37, 38). Without any priori knowledge of the protonation states for these complexes, both aspartic acid residues were considered protonated for purposes of identifying hydrogen bonds. Both were found to serve as proton donors in hydrogen bond interactions, and hydrogen bonds involving these residues were identical for the three compounds of KNI-10265, KNI-10074, and KNI-10006.
The surface shape complementarity (Sc) of inhibitors and protein was determined by using the program Sc in the CCP4 program suite (30, 39). Because the radii file used by the program does not contain the information of halogen atoms, van der Waals radii of fluorine and chlorine atoms (1.47 Å for F and 1.75 Å for Cl) were inputted in order to calculate the Sc for complexes including halogenated inhibitors (40). Changes in accessible surface area (21) were calculated using the algorithm of Lee and Richards (41). Water molecules buried upon binding and located within 6 Å of the compound were included in the calculation (17, 42).
RESULTS AND DISCUSSION
Binding energetics of inhibitors to HIV-1 protease pWT
The four protease inhibitors, KNI-10769, KNI-10265, KNI-10074, and KNI-10006, are identical except for the ortho substituents in one of the phenyl rings (Figure 1). These substituents are designed to fill a cavity within the protease binding pocket to different extents. The effects of the different substituents on the binding energetics of the inhibitors to the protease were determined by ITC. For KNI-10265, KNI-10074, and KNI-10006, the displacement titration method, using acetyl pepstatin as the weak inhibitor (23), was employed. The affinity of KNI-10769 was sufficiently low and could also be measured by direct titrations. For this inhibitor, KNI-10769, displacement titrations yielded the same results as direct titrations. Table 1 summarizes the binding thermodynamics of the four protease inhibitors.
Table 1.
Binding Thermodynamics of Inhibitors
| R1=R2 | ΔG(cal/mol) | ΔH(cal/mol) | −TΔS(cal/mol) | Kd(nM) | |
|---|---|---|---|---|---|
| KNI-10769 | H | −10815±33 | −4487±182 | −6328±33 | 11.8±0.66 |
| KNI-10265 | F | −11543±110 | −6075±471 | −5440±110 | 3.45±0.69 |
| KNI-10074 | Cl | −12691±284 | −6424±422 | −6181±284 | 0.52±0.24 |
| KNI-10006 | CH3 | −13490±185 | −6475±668 | −7015±185 | 0.14±0.04 |
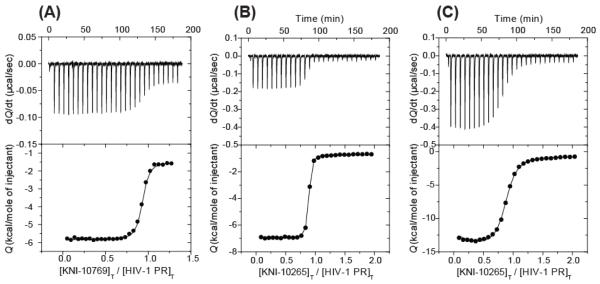
Figure 2A shows a direct titration of KNI-10769 into the protease pWT at 25 °C. The binding of KNI-10769 is characterized by a favorable enthalpy change of −4.5 kcal/mol. Because of its low-affinity, the association constant (Ka) could be determined directly (24), and was equal to 8.5 × 10⁷ M−1 (Kd = 1/Ka = 11.8 nM), corresponding to a binding Gibbs energy of −10.8 kcal/mol. The entropy contribution (-TΔS) to the binding of KNI-10769 is also favorable and equal to −6.3 kcal/mol.
Figure 2.
Typical set of ITC experiments performed at 25°C. The experiment on panel (A) represents the direct titration KNI-10769 (10 μL per injection of 72 μM) into the calorimetric cell (1.4272 mL) containing HIV-1 protease at a concentration of 7 μM. Panel (B) is the direct titration of KNI-10265 (10 μL per injection of 92 μM) into the cell containing HIV-1 protease at a concentration of 10 μM. The experiment on panel (C) is a displacement experiment in which KNI-10265 (10 μL per injection of 105 μM) was injected into the calorimetric cell containing HIV-1 protease pWT at a concentration of 10 μM prebound to acetyl pepstatin at a concentration of 120 μM. The experiments were performed in 10 mM sodium acetate buffer, pH 5.0, and 2% DMSO.
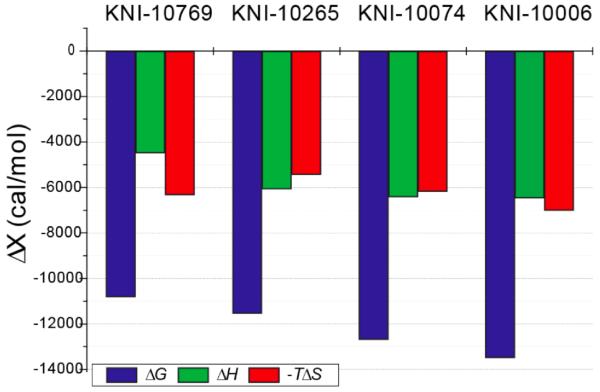
The results of direct and displacement titrations for KNI-10265 are illustrated in Figure 2B and 2C, respectively. The fluoro-substituted compound (KNI-10265) exhibits a more favorable enthalpy change (ΔH = −6.1 kcal/mol) than KNI-10769. Analysis of the titrations (Figure 2C) reveals an increase in binding affinity (Ka = 3.0 × 10⁸ M−1 or Kd = 1/Ka = 3.45 nM). Similar experiments were performed with the chloro-substituted compound (KNI-10074). The binding enthalpy of KNI-10074 is −6.4 kcal/mol, which is slightly more favorable than that of the fluoro-substituted compound (KNI-10265). However, a much more favorable binding entropy (-TΔS = −6.2 kcal/mol) contributes to increase the binding affinity of KNI-10074 to 2.2 × 10⁹ M−1 (Kd = 0.52 nM). ITC experiments with the methyl-substituted compound (KNI-10006) show a similar binding enthalpy to the fluoro-substituted compound (ΔH = −6.5 kcal/mol) but an additional improvement in the binding entropy (-TΔS = −7.0 kcal/mol), resulting in the highest binding affinity of the series (Ka = 7.1 × 10⁹ M−1 or Kd = 0.14 nM). The thermodynamic signatures of the inhibitors considered in the study are shown in Figure 3. This figure clearly illustrates the effects of changing the ortho substituents on the binding energetics to the HIV-1 protease.
Figure 3.
Enthalpic and entropic contributions to the binding affinity of protease inhibitors. The blue, green, and red bars represent the Gibbs energy of binding (ΔG), the enthalpy change (ΔH), and the entropy change (-TΔS) at 25°C, respectively.
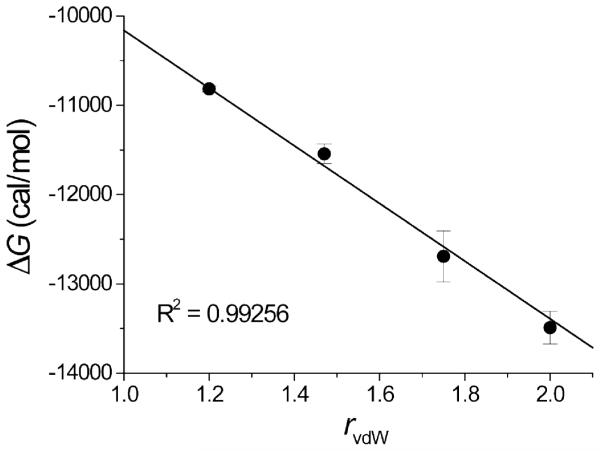
Analysis of the ITC data revealed a clear correlation between the Gibbs energy of binding and the van der Waals radii of the ortho substituents (H: 1.2 Å, F: 1.47 Å, Cl: 1.75 Å, CH3: 2.0 Å; values from Bondi (40, 43)) (Figure 4). This observation indicates that the affinity gain is based on a geometrical effect; the bigger the ortho substituents, the more favorable the binding affinities. However, there is a limit to this trend; for example, when isopropyl groups (CH(CH3)2) are used as ortho substituents (data not shown), the binding affinity of the inhibitor is reduced by 5,000-fold, indicating that the isopropyl groups are too large to fit in the cavity. Furthermore, with the much larger isopropyl substituents the enthalpy becomes unfavorable (+3 kcal/mol) suggesting a structural disruption of the binding cavity. In order to understand the binding thermodynamics and the origin of the measured differences in binding enthalpy and entropy, the structural details of the interactions were examined by X-ray crystallography.
Figure 4.
Correlation between the Gibbs energy of binding (ΔG) and the van der Waals radii of the ortho substituents of the four inhibitors (H: 1.2 Å, F: 1.47 Å, Cl: 1.75 Å, CH3: 2.0 Å; values from Bondi (40, 43)).
Crystallographic structures of the complexes of HIV-1 pWT protease with KNI-10265, KNI-10074, and KNI-10006
The structures of the HIV-1 protease in complex with KNI-10265, KNI-10074, and KNI-10006 were determined by X-ray crystallography at 1.80 Å, 2.20 Å, and 1.66 Å resolution, respectively. The statistics for data collection and refinement are shown in Table 2.
Table 2.
Statistics for crystallographic data collection and refinement
| KNI-10265:pWT | KNI-10074:pWT | KNI-10006:pWT | |
|---|---|---|---|
| Space group | P21212 | P21212 | P21212 |
| a(Å) | 58.4 | 58.3 | 58.6 |
| b(Å) | 85.9 | 86.1 | 85.9 |
| c(Å) | 46.4 | 46.4 | 46.6 |
| Data collection | |||
| Source | Rotating anode | Rotating anode | Rotating anode |
| Wavelength(Å) | 1.54 | 1.54 | 1.54 |
| Detector | R-AXIS IV | R-AXIS IV | R-AXIS IV |
| Resolution(Å) | 48.3-1.80 | 48.3-2.20 | 50-1.66 |
| Outermost shell(Å) | 1.86-1.80 | 2.28-2.20 | 1.72-1.66 |
| Observed reflections | 110,476 | 55,063 | 124,865 |
| Unique reflections | 19,350(2,193) | 12,408(1,212) | 24,519(2,793) |
| Redundancy | 5.7(6.3) | 4.4(4.4) | 5.1(4.9) |
| Completeness(%) | 86.1(99.0) | 99.8(100.0) | 85.9(100.0) |
| Signal][Hσ(I)] | 45.0(6.0) | 11.2(2.9) | 45.6(3.9) |
| Rsym | 0.06(0.04) | 0.12(0.46) | 0.06(0.46) |
| Refinement | |||
| Rwork | 0.2 | 0.18 | 0.21 |
| Rfree | 0.26 | 0.24 | 0.25 |
| Stereochemistry | |||
| R.M.S bond lengths(Å) | 0.009 | 0.007 | 0.013 |
| R.M.S angles(°) | 1.35 | 1.24 | 1.62 |
| B-factor | |||
| Protein | 26.1 | 21.5 | 24.6 |
| Inhibitor | 21.5 | 16.7 | 19.4 |
| Glycerol | 42.2 | 41.1 | 36.4 |
| Chloride | - | 25 | - |
| Water | 38.8 | 33.4 | 36.5 |
| Model composition | |||
| Amino acids(atoms) | 198(1516) | 198(1516) | 198(1516) |
| Ligands(atoms) | |||
| inhibitor | 1(45) | 1(45) | 1(45) |
| Occupancy | 0.55/0.45 | 0.60/0.40 | 0.55/0.45 |
| Glycerol | 2(12) | 1(6) | 1(6) |
| Chloride | - | 4 | |
| Water | 249 | 257 | 232 |
Data collection statistics given in parentheses are for the highest resolution shell.
As previously observed for the complex of HIV-1 protease with other KNI inhibitors (16, 17), two ligand orientations related by the local 2-fold axis of the protein were found in the protease complex with KNI-10265, KNI-10074, and KNI-10006. Occupancies were manually adjusted until refined B-factors were similar for both orientations in a given structure. For all complexes, both orientations of the ligand interacted similarly with equivalent protease residues on opposite chains. Only slight differences were found in hydrogen bonds distances, especially when water molecules were involved in the hydrogen bonds network. For those reasons, both orientations were considered in the structural analysis.
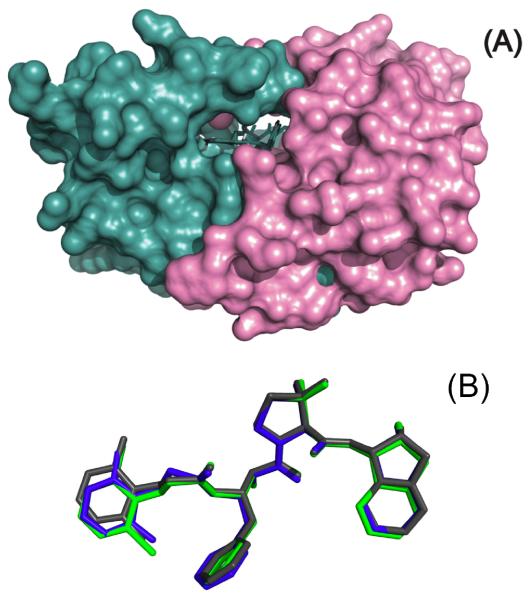
As shown in Figure 5, the structures of the three complexes reveal that all compounds bind to the protease in a similar fashion. No significant structural differences were found in the protease molecules for the three complexes. As already seen for other KNI compounds (16, 17), the three inhibitors bind the protease in a similar extended conformation (Figure 5B), and are almost completely buried upon complex formation (Figure 5A).
Figure 5.
The inhibitors bind to the HIV-1 protease in a similar conformation and interact with the same residues in the protease. Shown are surface representations of HIV-1 protease pseudo-wild type bound to KNI-10265 (blue), KNI-10074 (green), and KNI-10006 (gray) (Panel A). In panel B the structure of the bound compounds have been superimposed to indicate that the bind to the protease in the same extended conformation.
For all inhibitors, the ortho-substituted phenyl group is located in a pocket formed by residues Ala 28, Asp 29, Asp 30, Val 32, Ile 47 and Leu 76. None of the ortho substituents is within hydrogen or halogen bonding distance of any polar atom in the protein and in the structures are observed to be surrounded by mostly hydrophobic groups.
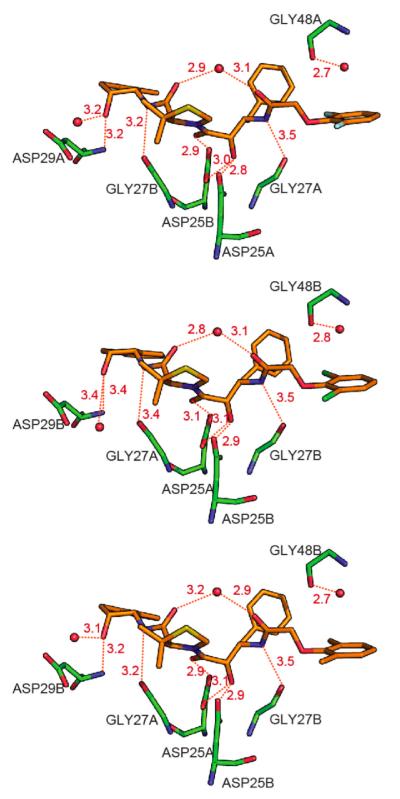
The hydrogen bonding interactions between the HIV-1 protease pWT and KNI-10265 (A), KNI-10074 (B), and KNI-10006 (C) are compared in Figure 6. As shown in the figure, all the inhibitors establish the same 9 hydrogen bonds with the protease, 6 directly with the protease and 3 indirectly through bridging water molecules.
Figure 6.
Hydrogen bonding interactions between HIV-1 protease pseudo-wild type (pWT) and KNI-10265 (top), KNI-10074 (middle), and KNI-10006 (bottom). Red spheres indicate water molecules. The compound and the protein are colored by atom type with oxygen in red, nitrogen in blue, sulfur in yellow, fluorine in cyan, chlorine in green, and carbon in orange for the compound and green for the protein. Hydrogen bonds are represented by red dashed lines, and the hydrogen bond distances shown in this figure are the average value of orientation A and B. The hydrogen bond pattern is the same for the three inhibitors.
Structure-based thermodynamic analysis of the binding affinity
The crystallographic structures of the three complexes indicate no significant differences in the mode of binding, the conformation or the interactions of the inhibitors with the protease. It is apparent that the differences in binding thermodynamics should be attributed to differences in the ortho substituents.
Since the binding affinity of the inhibitors is proportional to the van der Waals radius of the ortho substituents (Figure 4), the interactions between inhibitor and protein are also reflected in other geometric parameters, such as the surface area that becomes buried from the solvent upon binding (ΔASA) and the shape complementary parameter (Sc). The ΔASA values reveal that upon binding, KNI-10265, KNI-10074, and KNI-10006 bury a surface area equal to 1470, 1509, and 1570 Å2, respectively. Replacement of fluorine (KNI-10265) by chlorine (KNI-10074) results in an increase of 39 Å2 in buried surface area. This change is even greater when the ortho substituents are methyl groups. KNI-10006 buries 100 Å2 more surface area than KNI-10265. Modeling of KNI-10769 based upon the crystallographic structures of the other three compounds is consistent with a ΔASA value of −1455 Å2, or 50 Å2 less surface area than KNI-10265. The shape complementarity Sc as defined by Lawrence and Colman (39) depends both on the distance between two opposing molecular surfaces and on the relative shape of the surfaces with respect to each other, and can be considered as a descriptor of the ‘goodness of fit’ between the protease and inhibitor surfaces. Sc values were estimated as 0.736, 0.761, and 0.774 for the complex with KNI-10265, KNI-10074, and KNI-10006, respectively, and exhibit a strong correlation with the binding Gibbs energy (R2 = 0.99).
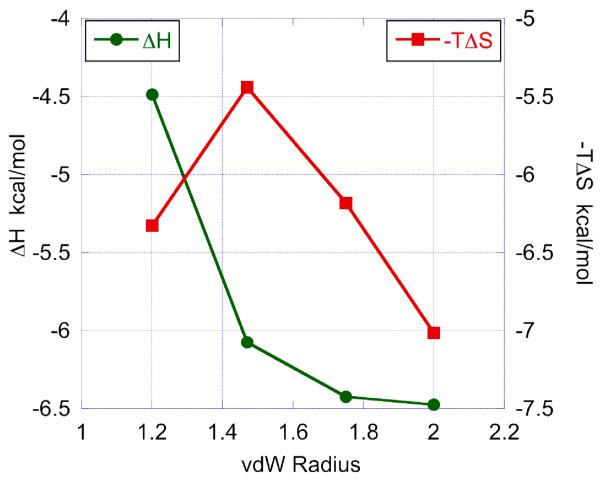
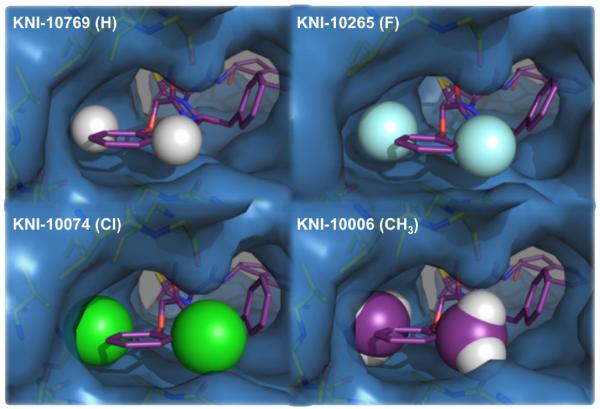
The binding enthalpies of the four compounds do not differ by more than 2 kcal/mol between the inhibitors with the lowest and highest binding enthalpies. Those enthalpic differences fall within the range expected for compounds differing by the extent of their van der Waals interactions with the target. For comparison, enthalpic differences due to the formation of a single strong hydrogen bond are on the order of 4-5 kcal/mol (16). The small enthalpic improvements are consistent with better van der Waals interactions as the size of the ortho substituents (hydrogen, fluorine, chlorine, methyl) increases. Figure 7 shows the dependence of the binding enthalpy on the van der Waals radii of the substituents. It is evident that the biggest improvement occurs when the hydrogen substituents are replaced by fluorine. This enthalpic improvement of almost 1.6 kcal/mol reflects the transition from a regime of very lose interactions to a more structured state, as subsequent enthalpic increments with fluorine, chlorine, methyl do not amount to more than 0.5 kcal/mol. The transition from a regime of lose interactions to a more structured state is associated with a loss of conformational entropy as also shown in Figure 7. The loss in entropy amounts to a loss of 0.9 kcal/mol in the Gibbs energy of binding, which is not sufficient to overcome the enthalpy gain. In all, the affinity of the inhibitor improves from a Kd of 11.8 nM to 3.45 nM. Once this transition has occurred, a further increase in van der Waals radii brings about a monotonic improvement in both the binding enthalpy and binding entropy. This additional entropy gain correlates with the surface area that is buried upon binding and most likely reflects gains in desolvation entropy. It must be emphasized that, in this regime, no enthalpy/entropy compensation is observed and that the binding affinity is quickly improved to 0.1 nM; i.e. two orders of magnitude better than the parent compound. These effects are graphically illustrated in Figure 8.
Figure 7.
The dependence of the enthalpic and entropic contributions to the Gibbs energy of binding on the van der Waals radii of the ortho substituents of the inhibitors.
Figure 8.
Illustration of the progressive filling of the binding cavity by substituents with increasing van der Waals radii. The transition from hydrogen to fluorine is accompanied by an enthalpic gain and an entropic loss, reflecting the loss of conformational degrees of freedom once significant van der Waals contacts are established. The thermodynamic changes associated with fluorine, chlorine and methyl are monotonic and characterized by improvements in both the enthalpy and entropy changes. In all, the changes from hydrogen to methyl bring about a two order of magnitude in binding affinity. Increasing the substituent size beyond methyl (e.g. isopropyl) lowers the affinity by 5000-fold and transforms the binding enthalpy from favorable −6.5 kcal/mol to unfavorable +3 kcal/mol. In this figure, KNI-10769 (H) was modeled using the crystallographic structures of the other substituents.
CONCLUSIONS
During drug development, improving the binding affinity of a lead compound is of paramount importance. Towards that end, it is very important to know what the expectations for specific substitutions are. In this paper, we have considered the binding affinity gains obtained by filling a target cavity with substitutions that only establish van der Waals interactions but no specific hydrogen or halogen bonds. We achieve a total gain of two orders of magnitude in binding affinity or equivalently −2.68 kcal/mol. We observe that a loosely fitting functionality is characterized by a poor interaction enthalpy and relatively large entropy, probably due to non-restricted conformational degrees of freedom within the binding pocket. The introduction of a tighter fitting functionality improves the binding enthalpy but restricts conformational degrees of freedom, hence a decrease in conformational entropy of the aryl ring around the ether bond. This change appears to be rather abrupt, resembling a transition from a disordered to an ordered state. In this particular case, the transition occurs when the hydrogen substituents are replaced by fluorine; however, in other situations, and depending on the size and geometry of the cavity, the transition may occur with substituents of different van der Waals radii. Once the transition has occurred, additional substitutions with increasingly larger van der Waals radii bring about progressive favorable enthalpic and also favorable entropic changes. The improved enthalpy reflects better van der Waals interactions while the improved entropy most likely reflects a more favorable desolvation entropy as the solvent buried surface are increases. Obviously, the introduction of even bulkier chemical substitutions eventually results in the complete breakdown of the trend and a significant loss in affinity, due to a possible disruption of the structure as evidenced by an unfavorable enthalpy. These effects observed in a binding reaction are qualitatively similar to those observed with cavity filling mutants in protein folding (44, 45).
Acknowledgments
This work was supported by grants from the National Institutes of Health (GM56550 and GM57144) and the National Science Foundation (MCB0641252).
REFERENCES
- 1.Freire E. Isothermal Titration Calorimetry: Controlling binding forces in lead optimization. Drug Discovery Today. 2005;1:295–9. doi: 10.1016/j.ddtec.2004.11.016. [DOI] [PubMed] [Google Scholar]
- 2.Ruben AJ, Kiso Y, Freire E. Overcoming roadblocks in lead optimization: a thermodynamic perspective. Chem Biol Drug Des. 2006;67:2–4. doi: 10.1111/j.1747-0285.2005.00314.x. [DOI] [PubMed] [Google Scholar]
- 3.Freire E. Do enthalpy and entropy distinguish first in class from best in class? Drug Discov Today. 2008;13:869–74. doi: 10.1016/j.drudis2008.07.005. [DOI] [PMC free article] [PubMed] [Google Scholar]
- 4.Tavares FX, Al-Barazanji KA, Bigham EC, Bishop MJ, Britt CS, Carlton DL, et al. Potent, selective, and orally efficacious antagonists of melanin-concentrating hormone receptor 1. J Med Chem. 2006;49:7095–107. doi: 10.1021/jm060572f. [DOI] [PubMed] [Google Scholar]
- 5.Suh YG, Lee YS, Min KH, Park OH, Kim JK, Seung HS, et al. Novel potent antagonists of transient receptor potential channel, vanilloid subfamily member 1: structure-activity relationship of 1,3-diarylalkyl thioureas possessing new vanilloid equivalents. J Med Chem. 2005;48:5823–36. doi: 10.1021/jm0502790. [DOI] [PubMed] [Google Scholar]
- 6.Rosen TC, Yoshida S, Frohlich R, Kirk KL, Haufe G. Fluorinated phenylcyclopropylamines. 2. Effects of aromatic ring substitution and of absolute configuration on inhibition of microbial tyramine oxidase. J Med Chem. 2004;47:5860–71. doi: 10.1021/jm049957t. [DOI] [PubMed] [Google Scholar]
- 7.Romagnoli R, Baraldi PG, Remusat V, Carrion MD, Cara CL, Preti D, et al. Synthesis and biological evaluation of 2-(3′,4′,5′-trimethoxybenzoyl)-3-amino 5-aryl thiophenes as a new class of tubulin inhibitors. J Med Chem. 2006;49:6425–8. doi: 10.1021/jm060804a. [DOI] [PubMed] [Google Scholar]
- 8.Nazare M, Will DW, Matter H, Schreuder H, Ritter K, Urmann M, et al. Probing the subpockets of factor Xa reveals two binding modes for inhibitors based on a 2-carboxyindole scaffold: a study combining structure-activity relationship and X-ray crystallography. J Med Chem. 2005;48:4511–25. doi: 10.1021/jm0490540. [DOI] [PubMed] [Google Scholar]
- 9.Koren AO, Horti AG, Mukhin AG, Gundisch D, Kimes AS, Dannals RF, et al. 2-, 5-, and 6-Halo-3-(2(S)-azetidinylmethoxy)pyridines: synthesis, affinity for nicotinic acetylcholine receptors, and molecular modeling. J Med Chem. 1998;41:3690–8. doi: 10.1021/jm980170a. [DOI] [PubMed] [Google Scholar]
- 10.Johnson SM, Connelly S, Wilson IA, Kelly JW. Biochemical and structural evaluation of highly selective 2-arylbenzoxazole-based transthyretin amyloidogenesis inhibitors. J Med Chem. 2008;51:260–70. doi: 10.1021/jm0708735. [DOI] [PubMed] [Google Scholar]
- 11.Inglis SR, Stojkoski C, Branson KM, Cawthray JF, Fritz D, Wiadrowski E, et al. Identification and specificity studies of small-molecule ligands for SH3 protein domains. J Med Chem. 2004;47:5405–17. doi: 10.1021/jm049533z. [DOI] [PubMed] [Google Scholar]
- 12.He X, Alian A, Stroud R, Ortiz de Montellano PR. Pyrrolidine carboxamides as a novel class of inhibitors of enoyl acyl carrier protein reductase from Mycobacterium tuberculosis. J Med Chem. 2006;49:6308–23. doi: 10.1021/jm060715y. [DOI] [PMC free article] [PubMed] [Google Scholar]
- 13.de Paulis T, Hemstapat K, Chen Y, Zhang Y, Saleh S, Alagille D, et al. Substituent effects of N-(1,3-diphenyl-1H-pyrazol-5-yl)benzamides on positive allosteric modulation of the metabotropic glutamate-5 receptor in rat cortical astrocytes. J Med Chem. 2006;49:3332–44. doi: 10.1021/jm051252j. [DOI] [PubMed] [Google Scholar]
- 14.Nezami A, Kimura T, Hidaka K, Kiso A, Liu J, Kiso Y, et al. High Affinity Inhibition of a Family of Plasmodium falciparum Proteases by a Designed Adaptive Inhibitor. Biochemistry. 2003;42:8459–64. doi: 10.1021/bi034131z. [DOI] [PubMed] [Google Scholar]
- 15.Kiso A, Hidaka K, Kimura T, Hayashi Y, Nezami A, Freire E, et al. Search for substrate-based inhibitors fitting the S2′ space of malarial aspartic protease plasmepsin II. J Pept Sci. 2004;10:641–7. doi: 10.1002/psc.609. [DOI] [PubMed] [Google Scholar]
- 16.Lafont V, Armstrong AA, Ohtaka H, Kiso Y, Mario Amzel L, Freire E. Compensating enthalpic and entropic changes hinder binding affinity optimization. Chem Biol Drug Des. 2007;69:413–22. doi: 10.1111/j.1747-0285.2007.00519.x. [DOI] [PubMed] [Google Scholar]
- 17.Vega S, Kang LW, Velazquez-Campoy A, Kiso Y, Amzel LM, Freire E. A structural and thermodynamic escape mechanism from a drug resistant mutation of the HIV-1 protease. Proteins. 2004;55:594–602. doi: 10.1002/prot.20069. [DOI] [PubMed] [Google Scholar]
- 18.Hidaka K, Kimura T, Ruben AJ, Uemura T, Kamiya M, Kiso A, et al. Antimalarial activity enhancement in hydroxymethylcarbonyl (HMC) isostere-based dipeptidomimetics targeting malarial aspartic protease plasmepsin. Bioorg Med Chem. 2008;16:10049–60. doi: 10.1016/j.bmc.2008.10.011. [DOI] [PMC free article] [PubMed] [Google Scholar]
- 19.Velazquez-Campoy A, Luque I, Todd MJ, Milutinovich M, Kiso Y, Freire E. Thermodynamic dissection of the binding energetics of KNI-272, a potent HIV-1 protease inhibitor. Protein Sci. 2000;9:1801–9. doi: 10.1110/ps.9.9.1801. [DOI] [PMC free article] [PubMed] [Google Scholar]
- 20.Todd MJ, Semo N, Freire E. The structural stability of the HIV-1 protease. J Mol Biol. 1998;283:475–88. doi: 10.1006/jmbi.1998.2090. [DOI] [PubMed] [Google Scholar]
- 21.Brower ET, Bacha UM, Kawasaki Y, Freire E. Inhibition of HIV-2 protease by HIV-1 protease inhibitors in clinical use. Chem Biol Drug Des. 2008;71:298–305. doi: 10.1111/j.1747-0285.2008.00647.x. [DOI] [PubMed] [Google Scholar]
- 22.Mildner AM, Rothrock DJ, Leone JW, Bannow CA, Lull JM, Reardon IM, et al. The HIV-1 protease as enzyme and substrate: mutagenesis of autolysis sites and generation of a stable mutant with retained kinetic properties. Biochemistry. 1994;33:9405–13. doi: 10.1021/bi00198a005. [DOI] [PubMed] [Google Scholar]
- 23.Velazquez-Campoy A, Kiso Y, Freire E. The binding energetics of first- and second-generation HIV-1 protease inhibitors: implications for drug design. Arch Biochem Biophys. 2001;390:169–75. doi: 10.1006/abbi.2001.2333. [DOI] [PubMed] [Google Scholar]
- 24.Leavitt S, Freire E. Direct measurement of protein binding energetics by isothermal titration calorimetry. Curr Opin Struct Biol. 2001;11:560–6. doi: 10.1016/s0959-440x(00)00248-7. [DOI] [PubMed] [Google Scholar]
- 25.Ohtaka H, Velazquez-Campoy A, Xie D, Freire E. Overcoming drug resistance in HIV-1 chemotherapy: the binding thermodynamics of Amprenavir and TMC-126 to wild-type and drug-resistant mutants of the HIV-1 protease. Protein Sci. 2002;11:1908–16. doi: 10.1110/ps.0206402. [DOI] [PMC free article] [PubMed] [Google Scholar]
- 26.Sigurskjold BW. Exact analysis of competition ligand binding by displacement isothermal titration calorimetry. Anal Biochem. 2000;277:260–6. doi: 10.1006/abio.1999.4402. [DOI] [PubMed] [Google Scholar]
- 27.Velazquez-Campoy A, Freire E. Isothermal titration calorimetry to determine association constants for high-affinity ligands. Nat Protoc. 2006;1:186–91. doi: 10.1038/nprot.2006.28. [DOI] [PubMed] [Google Scholar]
- 28.Otwinowski Z, Minor W, editors. Processing of x-ray diffraction data collected in oscillation mode. Academic Press; 1997. [DOI] [PubMed] [Google Scholar]
- 29.Navaza J. AMoRe: an automated package for molecular replacement. Acta Crystallogr A. 1994;50(Pt.2):157–63. [Google Scholar]
- 30.The CCP4 suite: programs for protein crystallography. Acta Crystallogr D Biol Crystallogr. 1994;50:760–3. doi: 10.1107/S0907444994003112. [DOI] [PubMed] [Google Scholar]
- 31.Jones TA, Zou JY, Cowan SW, Kjeldgaard M. Improved methods for building protein models in electron density maps and the location of errors in these models. Acta Crystallogr A. 1991;47(Pt 2):110–9. doi: 10.1107/s0108767390010224. [DOI] [PubMed] [Google Scholar]
- 32.Murshudov GN, Vagin AA, Dodson EJ. Refinement of macromolecular structures by the maximum-likelihood method. Acta Crystallogr D Biol Crystallogr. 1997;53:240–55. doi: 10.1107/S0907444996012255. [DOI] [PubMed] [Google Scholar]
- 33.Winn MD, Murshudov GN, Papiz MZ. Macromolecular TLS refinement in REFMAC at moderate resolutions. Methods Enzymol. 2003;374:300–21. doi: 10.1016/S0076-6879(03)74014-2. [DOI] [PubMed] [Google Scholar]
- 34.Perrakis A, Morris R, Lamzin VS. Automated protein model building combined with iterative structure refinement. Nat Struct Biol. 1999;6:458–63. doi: 10.1038/8263. [DOI] [PubMed] [Google Scholar]
- 35.Pettersen EF, Goddard TD, Huang CC, Couch GS, Greenblatt DM, Meng EC, et al. UCSF Chimera--a visualization system for exploratory research and analysis. J Comput Chem. 2004;25:1605–12. doi: 10.1002/jcc.20084. [DOI] [PubMed] [Google Scholar]
- 36.CCG . The Molecular Operating Environment (MOE) In: CCCGI, editor. Montreal. The Molecular Operating Environment (MOE); 1996. [Google Scholar]
- 37.Gustchina A, Sansom C, Prevost M, Richelle J, Wodak SY, Wlodawer A, et al. Energy calculations and analysis of HIV-1 protease-inhibitor crystal structures. Protein Eng. 1994;7:309–17. doi: 10.1093/protein/7.3.309. [DOI] [PubMed] [Google Scholar]
- 38.Brik A, Wong CH. HIV-1 protease: mechanism and drug discovery. Org Biomol Chem. 2003;1:5–14. doi: 10.1039/b208248a. [DOI] [PubMed] [Google Scholar]
- 39.Lawrence MC, Colman PM. Shape complementarity at protein/protein interfaces. J Mol Biol. 1993;234:946–50. doi: 10.1006/jmbi.1993.1648. [DOI] [PubMed] [Google Scholar]
- 40.Bondi A. van der Waals Volumes and Radii. J Phys Chem. 1964;68:441–51. [Google Scholar]
- 41.Lee B, Richards FM. The interpretation of protein structures: estimation of static accessibility. J Mol Biol. 1971;55:379–400. doi: 10.1016/0022-2836(71)90324-x. [DOI] [PubMed] [Google Scholar]
- 42.Luque I, Freire E. Structural parameterization of the binding enthalpy of small ligands. Proteins. 2002;49:181–90. doi: 10.1002/prot.10208. [DOI] [PubMed] [Google Scholar]
- 43.Bondi A. Physical properties of molecular crystals, liquids and glasses. New York: 1968. [Google Scholar]
- 44.Karpusas M, Baase WA, Matsumura M, Matthews BW. Hydrophobic packing in T4 lysozyme probed by cavity-filling mutants. Proc Natl Acad Sci, USA. 1989;86:8237–41. doi: 10.1073/pnas.86.21.8237. [DOI] [PMC free article] [PubMed] [Google Scholar]
- 45.Morii H, Uedaira H, Ogata K, Ishii S, Sarai A. Shape and Energetics of a Cavity in c-Myb Probed by Natural and Non-natural Amino Acid Mutations. J Mol Biol. 1999;292:909–20. doi: 10.1006/jmbi.1999.3099. [DOI] [PubMed] [Google Scholar]


