

Abstract
Unlike other kinesins, members of the kinesin-13 subfamily do not move directionally along microtubules but, instead, depolymerize them. To understand how kinesins with structurally similar motor domains can have such dissimilar functions, we elucidated the ATP turnover cycle of the kinesin-13, MCAK. In contrast to translocating kinesins, ATP cleavage, rather than product release, is the rate-limiting step for ATP turnover by MCAK; unpolymerized tubulin and microtubules accelerate this step. Further, microtubule ends fully activate the ATPase by accelerating the exchange of ADP for ATP. This tuning of the cycle adapts MCAK for its depolymerization activity: lattice-stimulated ATP cleavage drives MCAK into a weakly bound nucleotide state that reaches microtubule ends by diffusion, and end-specific acceleration of nucleotide exchange drives MCAK into a strongly bound state that promotes depolymerization. This altered cycle accounts well for the different mechanical behaviour of this kinesin, which depolymerizes microtubules from their ends, compared to translocating kinesins that walk along microtubules. Thus, the kinesin motor domain is a nucleotide-dependent engine that can be differentially tuned for transport or depolymerization functions.
Keywords: ATPase, kinesin-13, MCAK, microtubule, nucleotide exchange factor
Introduction
The kinesins are a superfamily of proteins defined by a common, highly conserved motor domain (Marx et al, 2009). For most kinesins, the motor domain functions as a molecular machine that converts chemical energy derived from the turnover of ATP into mechanical work used for directed motion along microtubules (Vale and Milligan, 2000; Howard, 2001; Schliwa, 2003). Directed motion is used to translocate organelles (kinesin-1, kinesin-2 and kinesin-3) (Hirokawa et al, 2009) or chromosomes (kinesin-4 and kinesin-10) (Mazumdar and Misteli, 2005) along microtubules, or to slide antiparallel arrays of microtubules (kinesin-5 and kinesin-14) (Peterman and Scholey, 2009).
In contrast to the transport and sliding kinesins, members of the kinesin-13 family do not move in a directed manner on microtubules. Instead, they bind weakly to the microtubule lattice and undergo random, diffusive motion (Helenius et al, 2006; Cooper et al, 2009). The motor function of kinesin-13s occurs at microtubule ends where, in a reaction coupled to ATP turnover, they catalytically depolymerize the stable GTP-containing caps of growing microtubules (Desai et al, 1999; Hunter et al, 2003; Wagenbach et al, 2008). Loss of the GTP cap, which can be mimicked using the slowly hydrolyzed analogue GMPCPP, converts the growing microtubule into a shrinking one (catastrophe). This depolymerase activity accounts well for the cellular phenotypes caused by disruption of kinesin-13. For example, immunodepletion of kinesin-13 from frog egg extracts leads to enlarged mitotic spindles (Walczak et al, 1996) and injection of antibodies to kinesin-13 blocks microtubule dynamics in the Drosophila early embryo (Rogers et al, 2004). Conversely, overexpression of kinesin-13 in tissue culture cells leads to an increase in the frequency of catastrophes (Kline-Smith and Walczak, 2002) and a reduction in the number of microtubules (Maney et al, 1998), again consistent with kinesin-13 proteins being depolymerases in vivo. Thus, kinesin-13s have very different activities to most other kinesins. This is remarkable given the high sequence and structural conservation of the kinesin motor domain (Ogawa et al, 2004; Shipley et al, 2004).
That motor domains of similar structure confer such different functions suggests that the internal workings of kinesin-13 differ from those of other kinesins. All kinesins studied to date, including kinesin-13s, use nucleotide turnover to alternate between states of high and low microtubule affinity: without nucleotide and in the presence of the non-hydrolyzable ATP analog, AMPPNP, kinesins bind strongly to microtubules, whereas in the presence of ADP they bind weakly. For the translocating kinesins, this change in affinity is coupled to directed movement of the motor domain along the microtubule. In the kinesin-1 family, the release of ADP is the rate-limiting step in the absence of microtubules and is accelerated ∼1000-fold by microtubule binding (Hackney, 1988). Following microtubule binding and release of ADP, the binding of ATP induces a conformational change in the switch regions resulting in the neck linker docking towards the plus end of the microtubule (Sindelar and Downing, 2010). For dimeric kinesin-1, this facilitates binding of the second head to the next site on the microtubule (Hackney, 1994a; Schief et al, 2004), allowing processive hand-over-hand movement, tightly coupled to ATP hydrolysis (Kaseda et al, 2002; Asbury et al, 2003; Yildiz et al, 2004).
The conventional cycle of ATP turnover outlined in the previous paragraph makes no sense for kinesin-13s, which do not translocate along the lattice. Instead, the motor activity of kinesin-13s occurs at the microtubule end (Desai et al, 1999; Hunter et al, 2003; Moore and Wordeman, 2004), where the end-stimulated ATPase of MCAK allows catalytic microtubule depolymerization. Previous work has shown that ATP cleavage is not required for the tubulin removal step (Desai et al, 1999; Moores et al, 2002; Wagenbach et al, 2008), suggesting that it is necessary for another aspect of catalytic activity, such as recycling of MCAK from tubulin heterodimers (Desai et al, 1999; Hertzer and Walczak, 2008). To understand how the ATP turnover cycle of a kinesin may be tuned to produce a microtubule depolymerase, we have elucidated the ATPase cycle of the kinesin-13 MCAK (mitotic centromere associated kinesin) in solution and in the presence of unpolymerized tubulin and microtubules. The cycle differs in fundamental ways from other kinesins and these differences tailor MCAK to its function as a microtubule depolymerase.
Results
The low basal ATPase of MCAK is accelerated by tubulin and microtubules
The key question is which step (or steps) in the ATP hydrolysis cycle of MCAK is rate limiting, and how this rate-limiting step (or steps) is altered by tubulin and microtubules. To answer this question, we first measured the rate constant for the complete ATP turnover cycle: the rate of product formation per motor domain (ATPase rate).
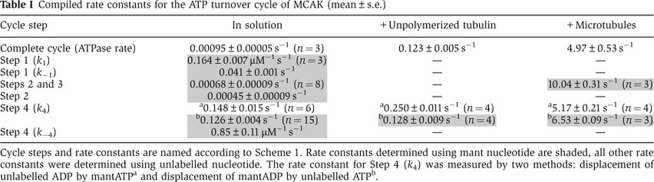
The basal ATPase rate of MCAK (the ATPase rate without tubulin or microtubules) was calculated by measuring the rate of formation of the reaction product, inorganic phosphate (Pi; Figure 1A) and dividing by the concentration of MCAK motor domains (each MCAK molecule has two ATP-hydrolyzing motor domains). The basal ATPase rate of MCAK is very low, 0.00095±0.00005 s−1 (mean±s.d., n=3). A similar low rate was determined by measuring the production of the other reaction product, ADP (Supplementary Figure S1A). The ATPase rate was increased by unpolymerized tubulin to 0.123±0.005 s−1 (mean±s.e.) and by microtubules to 4.97±0.53 s−1 (mean±s.e.) at saturating tubulin and microtubules (Table I, Supplementary Figure S1B and C). Thus, unpolymerized tubulin accelerates the ATPase ∼100-fold and microtubules ∼5000-fold.
Figure 1.

MCAK utilizes mantATP equally well as unlabelled ATP. (A) Production of inorganic phosphate during the reaction of MCAK with ATP (open circles) or mantATP (red squares). Linear fit to the data ATP (black) and mantATP (red). The basal ATPase rate determined by this method was 0.00095±0.00005 s−1 for ATP and 0.00090±0.00003 s−1 for mantATP (mean±s.d., n=3). (B) Dependence of the ATPase rate for MCAK upon the concentration of mantATP. Fit to the Michaelis–Menton equation (black line): Vmax=0.00085±0.00003 s−1, KM=0.40±0.08 μM (mean±s.e.). (C) Kymographs of fluorescently labelled GMPCPP-stabilised microtubules depolymerized by MCAK in the presence of 1 mM ATP or mantATP. Addition of MCAK is indicated by the red arrowhead. The depolymerization rate was 0.58±0.16 μm min−1 (mean±s.d., n=16) and 0.55±0.14 μm min−1 (mean±s.d., n=14) for ATP and mantATP, respectively. (D) Distribution of depolymerization rates for individual microtubules upon the addition of 100 nM MCAK plus 1 mM ATP or mantATP. The box represents the central 50% of the distribution, the central line the median and the whiskers the full range of the distribution.
Table 1. Compiled rate constants for the ATP turnover cycle of MCAK (mean±s.e.).
Dissection of the ATP turnover cycle using fluorescent nucleotides
The ATP turnover cycle comprises four individual chemical steps (Scheme 1): ATP binding to the empty site (denoted by ϕ) (1), ATP cleavage (2), phosphate dissociation (3) and ADP dissociation (4).
Scheme 1.
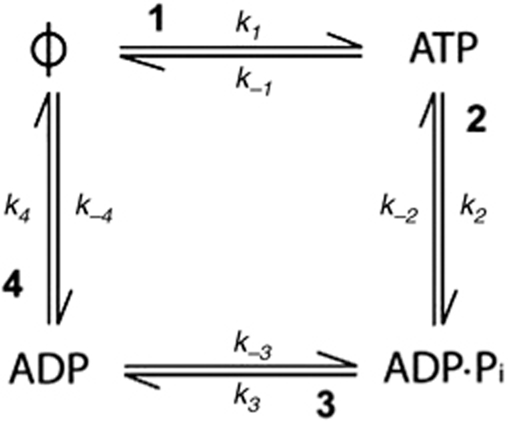
The ATP turnover cycle comprises four individual chemical steps.
To determine the rate-limiting step, we used nucleotide labelled with the fluorescent moiety mant (methylanthraniloyl) (Supplementary Figure S2A). The small mant group positioned on the ribose has been shown to have no significant effect on the binding and hydrolysis of nucleotides by several ATP-hydrolyzing enzymes (Sadhu and Taylor, 1992; Gilbert et al, 1995; Lisal and Tuma, 2005). Likewise, MCAK can use mantATP as a substrate: the basal mantATPase rate for MCAK was 0.00090±0.00003 s−1 (mean±s.d., n=3), not significantly different to the basal unlabelled ATPase rate (Figure 1A). The mantATPase rate depended upon the concentration of mantATP (Figure 1B) giving a KM=0.40±0.08 μM (mean±s.e.). The Vmax of 0.00085±0.00003 s−1 (mean±s.e.) is in agreement with the basal mantATPase rate measured by monitoring the production of inorganic phosphate. Importantly, in the presence of mantATP, MCAK depolymerized microtubules at the same rate as in the presence of unlabelled ATP (Figure 1C and D).
To determine the association and dissociation rate constants for ATP (Scheme 1, k1 and k−1) in the absence of tubulin or microtubules, the interaction of nucleotide-free MCAK (the bound ADP is removed by incubating with excess EDTA (Sadhu and Taylor, 1992)) with mantATP was assayed by rapidly mixing, using stopped-flow, and measuring the time course of the change in fluorescence. Upon binding to MCAK, the fluorescence of the mant group increased approximately two-fold (Figure 2A). When the concentration of mantATP was in excess of the MCAK concentration, the observed increase in fluorescence was well described by a single exponential, plus a line of constant negative slope to account for photobleaching of the mant group. The rate constant associated with the exponential increased linearly with the concentration of mantATP (Figure 2B). The gradient of the linear fit to these data provided the association rate constant (k1=0.164±0.007 μM−1 s−1, mean±s.e.) and the intercept provided the dissociation rate constant (k−1=0.041±0.001 s−1, mean±s.e.) for mantATP (Table I).
Figure 2.

Binding of mantATP and dissociation of mantADP. (A) Fluorescence increase upon mixing mantATP (3.1 μM) with nucleotide-free (ϕ) MCAK (0.6 μM) using stopped-flow. The fluorescence signal (black) is fit to a single exponential function, plus a line of constant negative slope to account for photobleaching of the mant group (red dashed). Inset: Contents of the syringes prior to mixing. (B) Dependence of the rate constant for the interaction of mantATP with nucleotide-free MCAK upon the concentration of mantATP (open circles). The gradient of the linear fit (red) gives the rate constant for mantATP binding, 0.164±0.007 μM−1 s−1 (mean±s.e.), and the intercept the mantATP dissociation rate constant, 0.041±0.001 s−1 (mean±s.e.). (C) Fluorescence decrease upon the dissociation of mantADP from MCAK. The fluorescence signal (black) is fit to a single exponential function, plus a line of constant negative slope to account for photobleaching of the mant group (red dashed). Inset: contents of the syringes prior to mixing, MCAK preloaded with mantADP is mixed with an excess of unlabelled ATP, which prevents rebinding of mantADP.
An increase in fluorescence was also observed for mantADP binding to nucleotide-free MCAK (Supplementary Figure S2B). The fit to these data provided the rate constants for association (k−4=0.85±0.11 μM−1 s−1, mean±s.e.) and dissociation (k4=0.16±0.03 s−1, mean±s.e.) of mantADP (Supplementary Figure S2C).
ADP dissociation is not the rate-limiting step in MCAK's basal hydrolysis cycle
The result in the previous paragraph suggests that ADP dissociation from MCAK is about 150 times faster than the overall cycle rate (0.16 s−1 compared to 0.00095 s−1). To confirm this, we directly measured the rate constant for ADP dissociation (Scheme 1, k4) by preloading MCAK with mantADP and rapidly mixing with an excess of unlabelled ATP. The fluorescence of mantADP decreased as it dissociated from MCAK and was replaced by the unlabelled nucleotide (Figure 2C). The time course of this decrease in fluorescence was well described by a single exponential, when corrected for photobleaching of the mant group. The rate constant was 0.126±0.015 s−1 (mean±s.d., n=15) (Table I) consistent with the earlier indirect measurement. As this rate constant is so much larger than the basal ATPase rate, ADP dissociation cannot be the rate-limiting step for MCAK. This distinguishes MCAK from translocating kinesins.
A highly fluorescent intermediate during the reaction of MCAK with mantATP
ATP binding is fast relative to the ATPase rate: Figure 2B gives a rate constant of ∼4 s−1 at 25 μM ATP. Thus, neither ATP binding nor ADP release is rate limiting. Therefore, either ATP cleavage or the release of inorganic phosphate, Pi (Scheme 1, Steps 2 and 3), must be rate limiting. To investigate these steps, we used low turnover conditions (Supplementary Information), in which the concentration of nucleotide is lower than that of the protein. This allowed us to observe intermediates transiently populated during the ATPase cycle.
Again, the use of mant-labelled nucleotides allowed us to resolve individual steps in the cycle. Addition of 1 μM ADP·MCAK (each MCAK motor domain has a bound ADP unless specifically treated to remove this nucleotide) to a solution containing 0.8 μM mantATP resulted in an unusual biphasic change in fluorescence (Figure 3A, black curve). Following the addition of ADP·MCAK (indicated by the red arrowhead, Figure 3A), the mant fluorescence first increased and then decreased. The rising phase corresponds to displacement of ADP by mantATP (Scheme 1, Steps 4 and 1), resulting in the previously observed increase in fluorescence of mantATP upon binding to MCAK. We attribute the slower, falling phase to the conversion of mantATP to mantADP in the nucleotide-binding pocket (Scheme 1, Steps 2 and 3). This interpretation is based on the following arguments. First, the fluorescence intensity at the end point of the reaction is similar to the fluorescence intensity obtained when ADP·MCAK is added to mantADP (Figure 3A, blue curve). Second, the addition of excess unlabelled ATP at the end point of the reaction (Supplementary Figure S2D) led to a fluorescence decrease with the same rate constant (0.114±0.012 s−1) as that previously measured (0.126±0.015 s−1) for the dissociation of mantADP from MCAK. An alternative explanation is that the biphasic kinetics result from differing affinity of mantATP for the individual motor domains of the MCAK dimer. However, biphasic kinetics are also observed for a monomeric MCAK construct (Figure 3B). We conclude that mantATP·MCAK has a higher fluorescence signal than mantADP·MCAK; this has been observed for other motor proteins (Woodward et al, 1991; Ma and Taylor, 1995; Kuhlman and Bagshaw, 1998).
Figure 3.

ATP cleavage is rate limiting in the ATP turnover cycle of MCAK. (A) Fluorescence change upon the reaction of 1 μM ADP·MCAK with 0.8 μM mantATP (black). A highly fluorescent intermediate (red asterisk) is observed during the reaction. Single exponential fit to the phase of decreasing fluorescence (red dashed), k=0.00068±0.00026 s−1 (mean±s.d., n=8). Reaction of 1 μM ADP·MCAK with 0.8 μM mantADP (blue). Reactions were initiated by manual addition of ADP·MCAK (red arrowhead) to a solution of mantATP or mantADP. The fluorescence signal is normalized to the mant-nucleotide signal prior to addition of MCAK. Inset: Reaction of 1 μM ADP kinesin-1 (Drosophila melanogaster KHC 1-557) with 0.8 μM mantATP. Black arrowhead indicates addition of the kinesin. (B) Fluorescence change upon mixing monomeric ADP·MCAK (NM-MCAK, A181-V585) with a substoichiometric concentration of mantATP. Inset: syringe contents prior to mixing. (C) mantATP as a fraction of total nucleotide at the indicated time after the initiation of the reaction of 1.0 μM ADP·MCAK with 0.5 μM mantATP (open circles). Fit of these data to a single exponential function (red), k=0.00045±0.00009 s−1 (mean±s.e.). Inset: example of HPLC traces showing the change in the proportions of mantATP (T) and mantADP (D) as the reaction progresses. The fraction of ATP remaining was determined by dividing the area under the peak corresponding to mantATP by the sum of the area under the mantATP and the mantADP peaks. (D) Time course of the formation of mantADP upon the reaction of 1 μM nucleotide-free MCAK with 10-fold excess mantATP. The ATPase rate was 0.0018±0.0007 (mean±s.d., n=3). The dashed line indicates the magnitude of the burst of product that would be observed if product release (Scheme 1, Step 3 or 4) rather than ATP cleavage (Scheme 1, Step 2) was rate limiting.
The biphasic change in fluorescence during the reaction of ADP·MCAK with mantATP confirms that ADP release is not the rate-limiting step in this experiment. If it were, then the reaction would be monophasic with a rate constant equal to the rate constant of ADP dissociation. Such a monophasic curve is seen for kinesin-1 (Figure 3A, inset); the rate constant of 0.02 s−1 is similar to that previously reported (Hackney, 1988).
The rate constant determined for the phase of decreasing fluorescence was 0.00068±0.00026 s−1 (mean±s.d., n=8) (Table I), less than but of the same order of magnitude as the basal mantATPase rate (0.00090±0.00003 s−1). The rate constant, associated with the fluorescence decrease, is consistent with the rate-limiting step in the basal ATP turnover cycle of MCAK. The rate constant of the fluorescence decrease is expected to be lower than the basal ATPase rate because not all of the mantATP binds to MCAK in the initial binding event (Supplementary Information). Given the affinity for mantATP (Figure 2B) and the presence of ADP equimolar with MCAK motor domains, we estimate that the rate constant of the fluorescence decrease should be ∼44% of the ATPase rate (Supplementary Information). We conclude that either the cleavage of ATP or the dissociation of phosphate (Scheme 1, Step 2 or 3) represents the rate-limiting step in the basal ATP turnover cycle of MCAK.
ATP cleavage is rate limiting for the ATP hydrolysis cycle of MCAK in solution
The rate-limiting step is either ATP cleavage or Pi dissociation. To distinguish between these two possibilities, we identified the highly fluorescent intermediate (Figure 3A, red asterisk). We took samples of the reaction over time, quenched the reaction to release the protein-bound nucleotides and separated them on a C18 column (Figure 3C, inset). As the reaction must be carried out under low turnover conditions ([ATP]<[MCAK]), low concentrations of ATP must be used. Therefore, we used mantATP as the substrate, enabling fluorescence detection of the nucleotides giving greater sensitivity. The fraction of mantATP remaining was determined over the course of the reaction (Figure 3C). The fraction of mantATP decreased exponentially with a rate constant of 0.00045±0.00009 s−1 (mean±s.e.) (Table I). This is not statistically significantly different (by a t-test) from the rate constant of the phase of decreasing fluorescence in Figure 3A (0.00068) and corresponds to ∼50% of the basal mantATPase rate (0.00090 s−1). The agreement of these rate constants indicates that the highly fluorescent intermediate seen in Figure 3A is mantATP. Thus, ATP cleavage, not phosphate release, is the rate-limiting step in the conversion of mantATP to mantADP (Scheme 1, Step 2).
To confirm the conclusion that ATP cleavage rather than Pi dissociation is rate limiting, the kinetics of ATP turnover were monitored by quenching the reaction of mantATP with MCAK and measuring the total amount of product (both free and bound to the enzyme) over time. Nucleotide-free MCAK was used at a concentration more than double the KM to ensure substrate binding was not limiting. We observed a linear increase in product (Figure 3D) with a mantATPase rate of 0.0018±0.0007 (mean±s.d., n=3). This rate is similar to, though somewhat higher than, the ATPase rates measured in earlier assays (mantATPase=0.00090 s−1, by Pi production (Figure 1A) and 0.00085 s−1, by mantADP production (Figure 1B); unlabelled ATPase=0.00095 s−1, by Pi production (Figure 1A) and 0.0017 s−1, by ADP production (Supplementary Figure S1A)). The important point is that there is no burst of product, confirming that ATP cleavage is the rate limiting step in MCAK's ATP turnover cycle (Foster and Gilbert, 2000).
Unpolymerized tubulin and microtubules accelerate ATP cleavage
Both unpolymerized and polymerized tubulin (microtubules) increase the ATPase rate. Therefore, they must both accelerate ATP cleavage. To determine the identity of the rate-limiting step in the presence of unpolymerized tubulin and microtubules, we monitored the reaction of mantATP with ADP·MCAK, under low turnover conditions, by rapid mixing using stopped-flow (Figure 4A). Without tubulin or microtubules (Figure 4B, upper trace) a biphasic fluorescence transient was observed, as for the same reaction initiated by manual mixing (Figure 3A). The addition of 0.5 μM unpolymerized tubulin accelerated the second phase (Figure 4B, middle trace, black arrow). Addition of 10 μM unpolymerized tubulin, which saturates the ATPase (Supplementary Figure S1B) and ensures that tubulin binding is not rate limiting, accelerated the second phase to such an extent that it was no longer observable (Figure 4B, lower trace). Thus, in the presence of saturating tubulin concentrations, ATP cleavage is no longer the rate-limiting step.
Figure 4.

Unpolymerized tubulin or microtubules change the rate-limiting step in MCAK's ATP turnover cycle. (A–C) The reaction of ADP·MCAK with a substoichiometric concentration of mantATP, alone or in the presence of unpolymerized tubulin or microtubules, initiated by rapid mixing using a stopped-flow fluorimeter. (A) Syringe contents prior to mixing: ADP·MCAK is mixed 1:1 v/v with mantATP plus unpolymerized tubulin or microtubules as stated. (B) Fluorescence change upon the reaction of 0.5 μM ADP·MCAK with 0.4 μM mantATP in the absence or presence of 0.5 μM or 10 μM unpolymerized tubulin (post-mixing concentrations). (C) Fluorescence change upon the reaction of 0.5 μM ADP·MCAK with 0.4 μM mantATP in the presence of 5 μM tubulin polymer (post-mixing concentrations). In (B) and (C), the fluorescence is normalized to the respective initial signals. (D) Sequential mixing assay in which ADP·MCAK is premixed with a substoichiometric concentration of mantATP, incubated for 30s (i.e. until the reaction has progressed to the point marked by the asterisk in B, upper trace) and then mixed with microtubules. (E) Fluorescence change upon mixing 0.5 μM ADP·MCAK pre-incubated for 30 s with 0.4 μM mantATP with microtubules. In panels B, C and E the data are shown in black and the fit to the data in red.
In the presence of 10 μM unpolymerized tubulin, the rate constant of the increase in fluorescence (Figure 4B, lower trace) was 0.250±0.022 s−1 (mean±s.d., n=4) (Table I). We attribute this rate constant to the dissociation of ADP from MCAK: it is similar to the rate constant for mantADP dissociation in the absence (0.126±0.015 s−1) and presence (0.128±0.017 s−1; mean±s.d., n=4) of tubulin (Table I, Supplementary Figure S3A and B).
Taken together, these data indicate that unpolymerized tubulin increases the ATPase rate for MCAK by increasing the rate constant for the cleavage of ATP, such that ADP dissociation becomes rate limiting for the ATP turnover cycle.
Microtubules accelerate both ATP cleavage and ADP dissociation
The addition of 5 μM polymerized tubulin to the reaction of ADP·MCAK with mantATP dramatically changed the kinetics of the reaction. The phase of decreasing fluorescence, seen for the reaction without tubulin or microtubules, was no longer visible (Figure 4C, compare with Figure 4B, upper trace). Instead, the fluorescence increased monotonically. The absence of the phase of decreasing fluorescence, previously shown to report on the conversion of mantATP to mantADP (Scheme 1, Steps 2 and 3), indicates that these steps occur faster than displacement of ADP by mantATP (Scheme 1, Steps 4 and 1). Thus, neither cleavage of mantATP nor dissociation of phosphate is rate limiting in the presence of microtubules. To confirm the identity of the process responsible for the observed fluorescence increase and thus the rate-limiting step for the cycle, these data were compared to the reaction of mantADP·MCAK with unlabelled ATP, which reports solely on ADP dissociation (Scheme 1, k4). The fluorescence decrease observed (Supplementary Figure S3C) occurred with the same rate constants as the fluorescence increase observed in Figure 4C. Therefore, we conclude that the rate-limiting step for ATP turnover in the presence of microtubules is ADP dissociation.
The microtubule-stimulated dissociation of ADP (Figure 4C) had two phases: a larger, faster phase (amplitude 72–79%) with a rate constant of 5.17±0.41 s−1 (mean±s.d., n=4) (Table I); and a smaller, slower phase (amplitude 21–28%) with a rate constant of 0.19±0.06 s−1 (mean±s.d., n=4). We attribute the faster phase to the dissociation of ADP from MCAK, accelerated ∼35-fold by microtubules, as this rate constant is similar to the ATPase rate in the presence of microtubules, 4.97±0.53 s−1 (Table I). These data indicate that ADP release is rate limiting for microtubule-stimulated ATP turnover, and is accelerated relative to the same process in solution or in the presence of unpolymerized tubulin.
The smaller, slow phase (Figure 4C) has a rate constant similar to ADP dissociation from MCAK in the presence of unpolymerized tubulin (Table I, Supplementary Figure S3B), which may be due to unpolymerized tubulin present in the sample of microtubules binding to ADP·MCAK and sterically blocking microtubule-stimulated ADP release. Alternatively, it may be due to MCAK binding to some very long microtubules in the reaction mix and failing to reach the end, where ADP release is maximally accelerated (see below). Irrespective of its origin, this phase is small and too slow to represent the rate-limiting step of the microtubule-stimulated ATPase.
The conclusion that the conversion of mantATP to mantADP is accelerated in the presence of microtubules is based on the absence of the phase of decreasing fluorescence (compare Figure 4C with Figure 4B, upper trace). To confirm that the conversion of mantATP to mantADP is accelerated by microtubules, the order of mixing in the assay in Figure 4C was altered (Figure 4D) to allow visualization of the associated change in fluorescence. ADP·MCAK was pre-incubated for 30 s with mantATP, allowing mantATP to bind to the MCAK motor domain. The preformed mantATP·MCAK was then mixed with microtubules (Figure 4E). A rapid decrease in fluorescence was observed, with a rate constant of 10.04±0.54 s−1 (mean±s.d., n=3). Thus, the conversion of mantATP to mantADP in the presence of microtubules occurs ∼14 000-fold faster than the same process in the absence of tubulin or microtubules (Figure 3A), and two-fold faster than ADP dissociation in the presence of microtubules (Figure 4C). These data further support the conclusion that ADP dissociation is the rate-limiting step in the microtubule-stimulated ATP turnover cycle.
The microtubule end stimulates ADP dissociation from MCAK
To determine if dissociation of ADP is maximally accelerated by the microtubule lattice or the microtubule end, the ATPase rate was determined in the presence of a constant concentration of tubulin polymer, but using microtubules of different average lengths. It is not possible to control the lengths of microtubules in the stopped-flow assay, as microtubules break upon rapid mixing in this instrument (Supplementary Figure S4A). However, microtubules of different lengths can be used when measuring the microtubule-stimulated ATPase rate, which is limited by ADP dissociation. Microtubules with an average length of 6.6±4.1 μm (mean±s.d., n=306) (Supplementary Figure S4B) gave an ATPase rate of 0.67±0.05 s−1, while microtubules with an average length of 2.1±1.1 μm (mean±s.d., n=323) gave an ATPase rate of 3.13±0.17 s−1 (Supplementary Figure S5). Thus, a 3.2-fold increase in the end concentration led to a 4.7-fold increase in the ATPase rate. This confirms that it is the microtubule end, rather than the lattice, which fully activates ATP turnover by MCAK (Hunter et al, 2003; Moore and Wordeman, 2004). Therefore, ADP dissociation, the rate-limiting step in the presence of microtubules, is maximally accelerated by microtubule ends.
Microtubule depolymerization is not required to stimulate ADP dissociation
To determine if depolymerization is necessary to stimulate MCAK's ATPase activity, the rate of ATP turnover by MCAK was measured in the presence of depolymerizing and non-depolymerizing microtubules. Addition of 100 μM taxol to GMPCPP-stabilized microtubules inhibited depolymerization by MCAK (Figure 5A). However, addition of taxol had no effect on the ATPase rate: the rates were 0.41±0.07 s−1 and 0.42±0.06 s−1 in the presence and absence of taxol (Figure 5B). These data show that the microtubule end stimulates the exchange of ADP for ATP irrespective of whether a tubulin dimer dissociates.
Figure 5.

Microtubule-stimulated ATPase does not require microtubule depolymerization. (A) Visualization of the action of MCAK (200 nM) on rhodamine-labelled, GMPCPP-stabilized microtubules (1 μM tubulin polymer) in the absence or presence of 100 μM taxol. Panels show microscope fields of reaction samples transferred to polylysine-coated flow cells after 20 min incubation at 25°C. (B) Change in ADP as a fraction of total nucleotide with time upon the reaction of 200 nM MCAK with 2 mM ATP in the presence of GMPCPP-stabilized microtubules and 1.5 μM tubulin polymer with (filled triangles) or without (open circles) 90 μM taxol. The calculated ATPase rates were 0.41±0.07 s−1 and 0.42±0.06 s−1 with and without taxol, respectively.
Discussion
Coupling of microtubule depolymerization to the ATP turnover cycle
The ATP turnover cycle provides insight into how MCAK depolymerizes microtubules. In solution, MCAK is predominantly in the ATP state because ATP cleavage is the rate-limiting step (Figure 6A, upper left). Following binding to the microtubule lattice (Figure 6A, Step 1), ATP is rapidly hydrolyzed (Figure 6A, Step 2), converting the enzyme from a tightly bound ATP form into a weakly bound ADP or ADP·Pi form. In this weakly bound state, MCAK diffuses on the microtubule lattice, until it either meets the microtubule end (Figure 6A, Step 3) or dissociates into solution (Figure 6A, Step 9). As the lattice does not maximally accelerate ADP release, MCAK remains predominantly in a diffusion-competent state on the microtubule lattice (Helenius et al, 2006). We do not know the rate constant for Pi dissociation, only that it is faster than the ATPase rate. Therefore, the ADP·Pi form may persist for a short time; however, its diffusive properties are similar to ADP·MCAK (Helenius et al, 2006).
Figure 6.

Proposed coupling between MCAK's ATP turnover cycle and microtubule depolymerization activity. (A) Mechanism of microtubule depolymerization. (1) ATP cleavage (Scheme 1, Step 2) is rate limiting in the absence of tubulin or microtubules. Therefore, MCAK meets the microtubule in the ATP-bound form. (2) ATP·MCAK binds tightly to the microtubule lattice but lattice-stimulated ATP cleavage (Scheme 1, Step 2) drives it into a weakly lattice-associated, diffusion-competent nucleotide state. (3) MCAK reaches the microtubule end via diffusion on the lattice. (4) The microtubule end promotes exchange of ADP for ATP (Scheme 1, Steps 4 and 1), driving MCAK into the ATP-bound state. ATP·MCAK binds tightly to the microtubule end. (5) This tight association of ATP·MCAK with a tubulin dimer likely deforms it and promotes depolymerization. (6) ATP cleavage (Scheme 1, Step 2) ‘switches off’ this tightly bound state and promotes the release of MCAK from the complex with tubulin. (7) At high ATP concentrations, MCAK in solution will exchange ADP (Scheme 1, Steps 4 and 1) and return to the ATP-bound state. (8) MCAK may hydrolyze ATP (Scheme 1, Step 2) on the microtubule without dissociation of tubulin from the microtubule. (9) MCAK may dissociate from the lattice before reaching the microtubule end or re-enter the weakly lattice-associated state after ATP cleavage at the microtubule end. (B) Both unpolymerized and polymerized tubulin act as a nucleotide-cleavage activating protein (NAP): accelerating the cleavage of ATP (Scheme 1, Step 2). The microtubule end acts also as a nucleotide exchange factor (NEF): accelerating ADP dissociation and thereby promoting exchange of ADP for ATP (Scheme 1, Steps 4 and 1).
When MCAK reaches the microtubule end, ADP release is accelerated and ATP binds rapidly (Figure 6A, Step 4). We propose that the strongly bound ATP·MCAK then curls the ends of the protofilament, in the same way that AMPPNP·MCAK stabilizes protofilament curls and rings (Moores et al, 2002; Niederstrasser et al, 2002; Tan et al, 2006; Elie-Caille et al, 2007). A microtubule end-binding conformation of MCAK has been isolated by mutation of the conserved Glu of the Switch II region to Ala (Wagenbach et al, 2008). This mutant can cause slow depolymerization in the ADP-bound state indicating that the process of tubulin removal occurs prior to ATP hydrolysis; this is in agreement with our model of microtubule depolymerization by MCAK. The lifetime of the ATP·MCAK state is ∼0.1 s; during this time, either the MCAK-bound tubulin dimer dissociates from the microtubule (Figure 6A, Step 5) followed by ATP cleavage and dissociation of MCAK from tubulin (Figure 6A, Step 6) or ATP is cleaved prior to tubulin dimer dissociation, and MCAK either dissociates from the microtubule (Figure 6A, Step 8) or returns to the weakly bound diffusive state (Figure 6A, Steps 8 and 9). As MCAK is a dimer, it is likely that a dissociated tubulin–motor domain complex (Figure 6A, upper right) remains tethered to the microtubule by the other motor domain. Following dissociation of the tubulin dimer, the tethered motor domain could then rapidly rebind near the end of the microtubule; in this way, several rounds of tubulin removal could be catalyzed by a single MCAK molecule, consistent with the mild processivity deduced from depolymerization assays (Hunter et al, 2003; Helenius et al, 2006; Cooper et al, 2009).
Stimulation of MCAK's ATPase does not require microtubule depolymerization
MCAK cannot depolymerize doubly stabilized microtubules (GMPCPP and taxol). Nevertheless, these microtubules accelerate MCAK's ATPase activity to the same extent as readily depolymerized, singly stabilized microtubules (GMPCPP). This indicates that ATP cleavage, rather than being required for microtubule depolymerization, acts as a ‘time-out’ mechanism. This ensures that MCAK does not get stuck on a dimer that it cannot remove: the microtubule end is very heterogeneous and there may exist tubulin dimers that have enough lateral interactions to hinder dissociation. Following time-out, the MCAK motor domain can re-enter the diffusive state and target a different tubulin dimer. Thus, the ATPase activity is necessary for catalytic depolymerization (Hunter et al, 2003), but depolymerization is not necessary to catalyze the ATPase activity.
The mechanism shown in Figure 6A has a variable stoichiometry, depending on the pathway. The full cycle (1-2-3-4-5-6-7-1) has two ATPs hydrolyzed per tubulin removed. This corresponds to non-processive depolymerization. The partial cycle that may take place during processive depolymerization (3-4-5-6-9) has one ATP hydrolyzed per tubulin removed. The ‘short-circuit’ (3-4-8-9) has one ATP hydrolyzed but no tubulin removed. Therefore, the stoichiometry can vary from one ATP/tubulin removed to many ATPs/tubulin removed. Thus, the scheme explains the previous, puzzling finding of two ATPs hydrolyzed per tubulin dissociation from taxol-stabilized microtubules and five ATPs hydrolyzed per tubulin dissociation from GMPCPP-stabilized microtubules (Hunter et al, 2003). In the presence of both taxol and GMPCPP, the stoichiometry is >20 ATPs per tubulin dissociation.
MCAK's activity is controlled in a similar way to G-proteins
The rate-limiting step in MCAK's ATPase cycle, without tubulin or microtubules, is ATP cleavage. This step is accelerated both by tubulin dimers and by microtubules. Thus, tubulin, unpolymerized or polymerized, acts as a nucleotide-cleavage activating protein (Figure 6B). In the presence of unpolymerized tubulin or microtubule lattice, the ATPase rate is not fully activated, and is limited by ADP release. This step is maximally accelerated by microtubule ends. Thus, the microtubule end acts as a nucleotide exchange factor (Figure 6B) that accelerates exchange of ADP for ATP, and is required for full activation of the ATP turnover cycle. In this respect, there is a striking similarity between MCAK and G-proteins. In the case of G-proteins, receptors, or molecules activated by receptors, are GDP-exchange factors that convert the inactive GDP form into an active GTP form; downstream effector molecules are GTPase-activating proteins (GAPs) that limit the lifetime of the active G-protein by accelerating GTP cleavage, converting the G-protein back to the inactive GDP form (Takai et al, 2001; Oldham and Hamm, 2006). In a similar way, the microtubule end-stimulated exchange of ADP for ATP is required to ‘switch on’ the microtubule destabilizing form of MCAK, and the lifetime of this ‘active’ form is limited by tubulin-stimulated ATP cleavage.
Structural basis of MCAK's altered hydrolysis cycle
GAPs accelerate GTP cleavage in small G-proteins by providing a missing residue—the arginine finger—that is required to complete the P-loop in the active site (Scheffzek et al, 1997). The acceleration of MCAK's ATP cleavage step does not occur by this mechanism: the corresponding residue, a lysine, is present in the P-loop. Instead, it is likely that acceleration of ATP cleavage by MCAK upon interaction with tubulin is due to an allosteric conformational change. The nucleotide-binding pocket of the mouse homologue of MCAK is in an open conformation when the non-hydrolysable ATP analogue AMPPNP is bound (Ogawa et al, 2004). In such an open conformation, the switch loops of the nucleotide-binding pocket are not close enough to form a salt bridge, thought to be required for nucleotide cleavage (Furch et al, 1999). To accelerate ATP cleavage, the binding of tubulin to MCAK must stabilize the closure of the nucleotide-binding pocket. Interaction with microtubules has been shown to promote closure of the nucleotide-binding site in NCD and kinesin-1 (Naber et al, 2003). As the proposed tubulin-binding site is distant from the nucleotide-binding pocket on MCAK (Ogawa et al, 2004), as for all kinesins studied to date, this stabilization likely occurs via an allosteric mechanism rather than a direct interaction of residues from tubulin with the nucleotide-binding site.
After tubulin-accelerated ATP cleavage, our experiments show that ADP dissociation becomes rate limiting. Unpolymerized tubulin does not accelerate ADP dissociation. Similarly, microtubule lattice has no or only a small effect. Thus, binding of MCAK to unique features at the microtubule end appear to be required to reopen the pocket so that ADP can leave. Direct evidence for such allosteric changes will require a high-resolution structure of the MCAK–tubulin interface, which is presently unavailable.
Comparison with other kinesins
The ATPase cycle of MCAK differs from that of most other kinesins. Only the kinesin-10, NOD, has previously been shown to have rate-limiting ATP cleavage (Cochran et al, 2009). For kinesin-1, and many other kinesins, ADP release is the rate-limiting step in the absence of unpolymerized tubulin and microtubules (Hackney, 1988). This step is accelerated partially by unpolymerized tubulin (Alonso et al, 2007) and fully by the microtubule lattice (Hackney, 1994b). MCAK differs in two respects: (i) ATP cleavage is the rate-limiting step without unpolymerized tubulin or microtubules and (ii) the microtubule end, not the lattice, fully accelerates ADP release. The first difference is consistent with the different structure of the kinesin-13 active site: the nucleotide pocket of KIF1A (kinesin-3) is closed with AMPPNP bound, whereas the pocket of MCAK is open, as mentioned above (Ogawa et al, 2004). The second difference may involve the KVD motif in loop 2, which is unique to the kinesin-13 family. Mutagenesis has shown that this three-residue motif is necessary for both depolymerization and microtubule-stimulated ATPase activity of the Plasmodium MCAK (Shipley et al, 2004) and Xenopus MCAK (Ems-McClung et al, 2007). This suggests that depolymerization and the ATPase activity require KVD interaction with the microtubule. To be consistent with our results, KVD must recognize the microtubule end but not the lattice or unpolymerized tubulin. The proposed orientation of the MCAK motor domain on the microtubule protofilament places loop 2 (and KVD) in the interdimer interface (Ogawa et al, 2004); if the KVD peptide recognizes the interdimer interface only in curved protofilaments, this would explain why the microtubule end fully stimulates ADP release, but the microtubule lattice, in which the protofilaments are straight, or unpolymerized tubulin, in which the interface does not exist, do not. If the feature, unique to the microtubule end, that fully accelerates ADP release is protofilament curvature or a flexibility that permits curvature, the ability to accelerate nucleotide exchange need not be restricted to the terminal tubulin dimer; rather, any region of protofilament possessing the required curved conformation, or sufficient flexibility to adopt the appropriate conformation, could act as the proposed nucleotide exchange factor. This is in accord with the observation that rings of tubulin, stabilized by the drug dolastatin, stimulate the ATPase of the Plasmodium MCAK (Moores and Milligan, 2008) and also with observations, from docking of the mouse MCAK crystal structure onto the structure of the microtubule, which suggest that the MCAK motor domain does not fit to the flat surface of the straight microtubule protofilament (Ogawa et al, 2004).
Comparison with translocating motors
According to our results, MCAK meets the microtubule from solution in the ATP-bound state, which binds tightly to the microtubule lattice (Figure 7). Lattice binding stimulates ATP cleavage, driving MCAK into a weakly lattice-associated nucleotide state (ADP·Pi or ADP) in which MCAK diffuses on the microtubule lattice (Helenius et al, 2006). By contrast, kinesin-1 meets the microtubule from solution in the ADP-bound state. In this nucleotide state, kinesin-1 forms a weak association with the microtubule lattice. The lattice stimulates ADP dissociation and drives kinesin-1 into a nucleotide state that binds tightly (Figure 7), thus initiating the cycles of binding and detachment that characterize the directed movement of kinesin-1 and other translocating kinesins. Most myosins behave in a similar way to kinesin-1, for example, myosin-V meets the actin filament in a nucleotide state that associates weakly (ADP·Pi). Actin binding drives myosin-V into a tightly bound state due to the actin-stimulated dissociation of phosphate (Figure 7). The way in which MCAK interacts with its filament is, therefore, reversed compared to translocating motors. In this way, the ATP hydrolysis cycle of MCAK is adapted for depolymerization rather than translocation. The adaptability of the cycle reveals the remarkable extent to which a nucleotide-gated switch, evolved from a G-protein ancestor (Kull et al, 1998), can be tailored for different mechanical functions.
Figure 7.

Comparison of the association with their respective filaments of MCAK (microtubule) and the translocating motors kinesin-1 (microtubule) and myosin-V (actin) according to nucleotide state. The ATP turnover cycles of these motor proteins are aligned with respect to the rate-limiting step (RLS) in the absence of unpolymerized tubulin or microtubules (red line). In solution, the motor protein is predominantly in the nucleotide state prior to the RLS and will meet the filament in this nucleotide state. Interaction with the filament accelerates the RLS, driving the motor protein to the next nucleotide state in the cycle. Note how the change in affinity triggered by the filament-stimulated change in nucleotide state is reversed for MCAK compared with translocating motors.
Materials and methods
Proteins
Full-length human MCAK-his6 was expressed in Spodoptera frugipera (Sf9) cells and purified by cation exchange and Ni-affinity chromatography (Helenius et al, 2006). Protein concentrations were determined using Bradford's method with BSA standards and are quoted as monomer concentration.
Nucleotide binding and hydrolysis
All assays were performed at 25°C, in BRB80 (80 mM PIPES-/KOH pH 6.9, 1 mM MgCl2, 1 mM EGTA), 75 mM KCl, 0.05% Tween20 and 1 mM DTT.
ATPase rates. Assays were started by the addition of MCAK to the appropriate buffer containing 2 mM ATP. The concentration of MCAK used was 3 μM, 0.8 μM and 0.1 μM, unless otherwise stated, in assays containing MCAK alone, unpolymerized tubulin and microtubules, respectively.
To measure the production of phosphate, samples were quenched by addition of an equal volume of 2 M HCl and neutralized by addition of 1 M Tris and 3 M KOH. Liberated phosphate was quantified using BIOMOL Green phosphate detection reagent (Enzo Scientific) and measuring absorbance at 620 nm in a FLUOstar omega plate reader (BMG labtech). The concentration of phosphate in each sample was determined by comparison with a phosphate standard curve. The ATPase rate was calculated by dividing the rate of increase in phosphate concentration by the concentration of MCAK motor domains.
To measure the production of ADP, samples were quenched by addition of an equal volume of ice cold 0.6 M perchloric acid and neutralized by addition of 1 M·Tris and 3 M·KOH, and clarified by centrifugation at 13 000 r.p.m. for 10 min. Nucleotides were separated using an Ettan LC system (GE Healthcare) on a Luna C-18 column (Phenomenex) using isocratic flow in 100 mM potassium phosphate pH 6.5, 10 mM tetrabutylammonium bromide and 10% acetonitrile. Nucleotides were detected by absorbance at 259 nm. The fraction of ADP was determined by dividing the area under the ADP peak by the sum of the areas under the ADP and ATP peaks. The ATPase rate was calculated by multiplying the rate of increase of the fraction of ADP by the total nucleotide concentration and dividing by the concentration of MCAK motor domains.
The ATP titration (Figure 1B) was performed using 3′mant-2′deoxyATP (Jena Bioscience): the reaction was initiated by mixing ADP·MCAK with a 10-fold excess of mantATP. The reaction was quenched by addition of 15 mM EDTA pH 8.0 and incubation at 65°C for 1 min. Nucleotides were separated as described above using the running buffer 100 mM potassium phosphate pH·6.5, 7.5 mM tetrabutylammonium bromide and 25% acetonitrile, which gives complete separation of mantADP from mantATP. Nucleotides were detected using the fluorescence of the mant group (λex=355 nm, λem=448 nm). The deoxy form of mantATP was used to avoid the extra peaks observed when 2′/3′mantATP (a mixture of forms with the mant group at either the 2′ or 3′ position on the ribose) is used as the substrate. Pre-steady state assays, such as that in Figure 3D, were carried out in a similar way using nucleotide-free MCAK (produced as described below) at a concentration of at least 1 μM and with 3′mant-2′deoxyATP in at least 10-fold excess over the concentration of MCAK.
In all cases, the data point at t=0 represents a pre-quenched sample; this value was subtracted from each data set.
Stopped-flow. Rapid mixing experiments were performed using an Applied Photophysics SX18 stopped-flow fluorimeter. The fluorescence of the mant group was excited at 365 nm and the emitted fluorescence monitored at >400 nm. Both no-protein and premixing controls showed that photobleaching of the mant group occurs under the conditions used, therefore, fluorescence transients were fit to exponential functions plus a line of constant negative slope to account for photobleaching.
mantATP and mantADP binding. Nucleotide-free MCAK was produced by incubation at 25°C in buffer containing 1 mM EDTA and 1 mM DTT for 15 min. Free nucleotide was removed and the protein exchanged into the reaction buffer by passing through a G-25 sepharose column equilibrated with BRB80 (without MgCl2), 75 mM KCl, 0.05% Tween20 and 1 mM DTT. Immediately after buffer exchange, 1 mM MgCl2 was added to the nucleotide-free MCAK solution (Sadhu and Taylor, 1992). Nucleotide-free MCAK was mixed in a 1:1 v/v ratio with mantNTP. The nucleotide concentration was maintained in at least 5-fold excess over the concentration of MCAK.
mantADP dissociation. MCAK was loaded with mantADP (Jena Bioscience) by incubation with a 25-fold excess of mantADP at 25°C for 30 min, excess nucleotide was removed and the protein exchanged into the reaction buffer by passing through a G-25 sepharose column equilibrated with BRB80, 75 mM KCl, 0.05% Tween20 and 1 mM DTT. Dissociation of mantADP from MCAK was measured by rapidly mixing 1:1 v/v with an excess of unlabelled ATP.
Low turnover reactions with mantATP. Low turnover assays (Supplementary Information) were performed by mixing ADP·MCAK with mantATP (Jena Bioscience) at a protein concentration in excess of the nucleotide concentration. The reaction was initiated either by manual mixing and the progress of the reaction monitored using a Horiba Jobin Yvon Fluoromax-3 fluorimeter (λex=365 nm, λem=425–435 nm, sampling for 1 s every 10 s) or rapidly mixed using an Applied Photophysics SX18 stopped-flow fluorimeter. The assay shown in Figure 4E was performed using the sequential mixing mode of the Applied Photophysics SX18 stopped-flow fluorimeter.
For discontinuous low turnover assays (Figure 3C), ADP·MCAK was mixed with 3′mant-2′deoxyATP (Jena Bioscience). Samples of the reaction were quenched by injection onto the column and the nucleotide products separated via HPLC on a C-18 column, using isocratic flow in 100 mM potassium phosphate pH 6.5, 10 mM tetrabutylammonium bromide and 30% acetonitrile.
Microtubules
Microtubules were prepared by two cycles of assembly in GMPCPP (Gell et al, 2010): 20 μM tubulin in BRB80 plus 1 mM GMPCPP was incubated for 30 min at 37°C. Microtubules were depolymerized by incubation for 20 min on ice, before a second cycle of polymerization. Microtubules were pelleted using a Beckman Airfuge Ultracentrifuge and then resuspended in the appropriate assay buffer, snap frozen and stored in liquid N2 until required. Frozen microtubules were thawed at 37°C directly before use. This protocol results in microtubules of average length 2.1 μm (Supplementary Figure S4). Microtubules made in this way were used for all assays, unless otherwise stated. These microtubules were used in all stopped-flow assays; however, mixing in this instrument causes breaking of microtubules resulting in a reduction in the average microtubule length to 1.2 μm in the final reaction (Supplementary Figure S4A). Longer microtubules were prepared by incubating 2 μM tubulin in BRB80 plus 1 mM GMPCPP for 2 h at 37°C, depolymerizing by incubation for 20 min on ice, before a second cycle of polymerization. After pelleting and resuspension in the appropriate assay buffer, these microtubules were used directly (without snap freezing) to preserve the maximum length. This produces microtubules of average length 6.6 μm (Supplementary Figure S4B).
Microtubule depolymerization rates
Depolymerization rates were determined as described previously (Helenius et al, 2006), except that the reaction buffer used was BRB80, 75 mM KCl and 0.05% Tween20.
Supplementary Material
Acknowledgments
We acknowledge Clive Bagshaw and Roger Goody for helpful discussions, and Jonne Helenius, Gary Brouhard and members of the Howard lab, in particular Chris Gell, for critical reading and feedback on this manuscript. We thank Aymelt Itzen for assistance in obtaining the data shown in Figure 3C. We also thank Marija Zanic for calculations of the proportion of mantATP binding in the low turnover assays. This work was funded by the Max Planck Society and the Alexander von Humboldt Foundation.
Author Contributions: CTF designed and performed experiments, analyzed and interpreted data, and wrote the paper. JH conceived of the project, interpreted the data, and wrote the paper.
Footnotes
The authors declare that they have no conflict of interest.
References
- Alonso MC, Drummond DR, Kain S, Hoeng J, Amos L, Cross RA (2007) An ATP gate controls tubulin binding by the tethered head of kinesin-1. Science 316: 120–123 [DOI] [PMC free article] [PubMed] [Google Scholar]
- Asbury CL, Fehr AN, Block SM (2003) Kinesin moves by an asymmetric hand-over-hand mechanism. Science 302: 2130–2134 [DOI] [PMC free article] [PubMed] [Google Scholar]
- Cochran JC, Sindelar CV, Mulko NK, Collins KA, Kong SE, Hawley RS, Kull FJ (2009) ATPase cycle of the nonmotile kinesin NOD allows microtubule end tracking and drives chromosome movement. Cell 136: 110–122 [DOI] [PMC free article] [PubMed] [Google Scholar]
- Cooper JR, Wagenbach M, Asbury CL, Wordeman L (2009) Catalysis of the microtubule on-rate is the major parameter regulating the depolymerase activity of MCAK. Nat Struct Mol Biol 17: 77–82 [DOI] [PMC free article] [PubMed] [Google Scholar]
- Desai A, Verma S, Mitchison TJ, Walczak CE (1999) Kin I kinesins are microtubule-destabilizing enzymes. Cell 96: 69–78 [DOI] [PubMed] [Google Scholar]
- Elie-Caille C, Severin F, Helenius J, Howard J, Muller DJ, Hyman AA (2007) Straight GDP-tubulin protofilaments form in the presence of taxol. Curr Biol 17: 1765–1770 [DOI] [PubMed] [Google Scholar]
- Ems-McClung SC, Hertzer KM, Zhang X, Miller MW, Walczak CE (2007) The interplay of the N- and C-terminal domains of MCAK control microtubule depolymerization activity and spindle assembly. Mol Biol Cell 18: 282–294 [DOI] [PMC free article] [PubMed] [Google Scholar]
- Foster KA, Gilbert SP (2000) Kinetic studies of dimeric Ncd: evidence that Ncd is not processive. Biochemistry 39: 1784–1791 [DOI] [PubMed] [Google Scholar]
- Furch M, Fujita-Becker S, Geeves MA, Holmes KC, Manstein DJ (1999) Role of the salt-bridge between switch-1 and switch-2 of Dictyostelium myosin. J Mol Biol 290: 797–809 [DOI] [PubMed] [Google Scholar]
- Gell C, Bormuth V, Brouhard GJ, Cohen DN, Diez S, Friel CT, Helenius J, Nitzsche B, Petzold H, Ribbe J, Schaffer E, Stear JH, Trushko A, Varga V, Widlund PO, Zanic M, Howard J (2010) Microtubule dynamics reconstituted in vitro and imaged by single-molecule fluorescence microscopy. Methods Cell Biol 95: 221–245 [DOI] [PubMed] [Google Scholar]
- Gilbert SP, Webb MR, Brune M, Johnson KA (1995) Pathway of processive ATP hydrolysis by kinesin. Nature 373: 671–676 [DOI] [PMC free article] [PubMed] [Google Scholar]
- Hackney DD (1988) Kinesin ATPase: rate-limiting ADP release. Proc Natl Acad Sci USA 85: 6314–6318 [DOI] [PMC free article] [PubMed] [Google Scholar]
- Hackney DD (1994a) Evidence for alternating head catalysis by kinesin during microtubule-stimulated ATP hydrolysis. Proc Natl Acad Sci USA 91: 6865–6869 [DOI] [PMC free article] [PubMed] [Google Scholar]
- Hackney DD (1994b) The rate-limiting step in microtubule-stimulated ATP hydrolysis by dimeric kinesin head domains occurs while bound to the microtubule. J Biol Chem 269: 16508–16511 [PubMed] [Google Scholar]
- Helenius J, Brouhard G, Kalaidzidis Y, Diez S, Howard J (2006) The depolymerizing kinesin MCAK uses lattice diffusion to rapidly target microtubule ends. Nature 441: 115–119 [DOI] [PubMed] [Google Scholar]
- Hertzer KM, Walczak C (2008) The C-termini of tubulin and the specific geometry of tubulin substrates influence the depolymerization activity of MCAK. Cell Cycle 7: 2727–2737 [DOI] [PubMed] [Google Scholar]
- Hirokawa N, Noda Y, Tanaka Y, Niwa S (2009) Kinesin superfamily motor proteins and intracellular transport. Nat Rev Mol Cell Biol 10: 682–696 [DOI] [PubMed] [Google Scholar]
- Howard J (2001) Mechanics of Motor Proteins and the Cytoskeleton. Sunderland, MA: Sinauer Associates Inc [Google Scholar]
- Hunter AW, Caplow M, Coy DL, Hancock WO, Diez S, Wordeman L, Howard J (2003) The kinesin-related protein MCAK is a microtubule depolymerase that forms an ATP-hydrolyzing complex at microtubule ends. Mol Cell 11: 445–457 [DOI] [PMC free article] [PubMed] [Google Scholar]
- Kaseda K, Higuchi H, Hirose K (2002) Coordination of kinesin's two heads studied with mutant heterodimers. Proc Natl Acad Sci USA 99: 16058–16063 [DOI] [PMC free article] [PubMed] [Google Scholar]
- Kline-Smith SL, Walczak CE (2002) The microtubule-destabilizing kinesin XKCM1 regulates microtubule dynamic instability in cells. Mol Biol Cell 13: 2718–2731 [DOI] [PMC free article] [PubMed] [Google Scholar]
- Kuhlman PA, Bagshaw CR (1998) ATPase kinetics of the Dictyostelium discoideum myosin II motor domain. J Muscle Res Cell Motil 19: 491–504 [DOI] [PubMed] [Google Scholar]
- Kull FJ, Vale RD, Fletterick RJ (1998) The case for a common ancestor: kinesin and myosin motor proteins and G proteins. J Muscle Res Cell Motil 19: 877–886 [DOI] [PubMed] [Google Scholar]
- Lisal J, Tuma R (2005) Cooperative mechanism of RNA packaging motor. J Biol Chem 280: 23157–23164 [DOI] [PubMed] [Google Scholar]
- Ma YZ, Taylor EW (1995) Kinetic mechanism of kinesin motor domain. Biochemistry 34: 13233–13241 [DOI] [PubMed] [Google Scholar]
- Maney T, Hunter AW, Wagenbach M, Wordeman L (1998) Mitotic centromere-associated kinesin is important for anaphase chromosome segregation. J Cell Biol 142: 787–801 [DOI] [PMC free article] [PubMed] [Google Scholar]
- Marx A, Hoenger A, Mandelkow E (2009) Structures of kinesin motor proteins. Cell Motil Cytoskeleton 66: 958–966 [DOI] [PMC free article] [PubMed] [Google Scholar]
- Mazumdar M, Misteli T (2005) Chromokinesins: multitalented players in mitosis. Trends Cell Biol 15: 349–355 [DOI] [PubMed] [Google Scholar]
- Moore A, Wordeman L (2004) C-terminus of mitotic centromere-associated kinesin (MCAK) inhibits its lattice-stimulated ATPase activity. Biochem J 383(Part 2): 227–235 [DOI] [PMC free article] [PubMed] [Google Scholar]
- Moores CA, Milligan RA (2008) Visualisation of a kinesin-13 motor on microtubule end mimics. J Mol Biol 377: 647–654 [DOI] [PMC free article] [PubMed] [Google Scholar]
- Moores CA, Yu M, Guo J, Beraud C, Sakowicz R, Milligan RA (2002) A mechanism for microtubule depolymerization by KinI kinesins. Mol Cell 9: 903–909 [DOI] [PubMed] [Google Scholar]
- Naber N, Minehardt TJ, Rice S, Chen X, Grammer J, Matuska M, Vale RD, Kollman PA, Car R, Yount RG, Cooke R, Pate E (2003) Closing of the nucleotide pocket of kinesin-family motors upon binding to microtubules. Science 300: 798–801 [DOI] [PubMed] [Google Scholar]
- Niederstrasser H, Salehi-Had H, Gan EC, Walczak C, Nogales E (2002) XKCM1 acts on a single protofilament and requires the C terminus of tubulin. J Mol Biol 316: 817–828 [DOI] [PubMed] [Google Scholar]
- Ogawa T, Nitta R, Okada Y, Hirokawa N (2004) A common mechanism for microtubule destabilizers-M type kinesins stabilize curling of the protofilament using the class-specific neck and loops. Cell 116: 591–602 [DOI] [PubMed] [Google Scholar]
- Oldham WM, Hamm HE (2006) Structural basis of function in heterotrimeric G proteins. Q Rev Biophys 39: 117–166 [DOI] [PubMed] [Google Scholar]
- Peterman EJ, Scholey JM (2009) Mitotic microtubule crosslinkers: insights from mechanistic studies. Curr Biol 19: R1089–R1094 [DOI] [PubMed] [Google Scholar]
- Rogers GC, Rogers SL, Schwimmer TA, Ems-McClung SC, Walczak CE, Vale RD, Scholey JM, Sharp DJ (2004) Two mitotic kinesins cooperate to drive sister chromatid separation during anaphase. Nature 427: 364–370 [DOI] [PubMed] [Google Scholar]
- Sadhu A, Taylor EW (1992) A kinetic study of the kinesin ATPase. J Biol Chem 267: 11352–11359 [PubMed] [Google Scholar]
- Scheffzek K, Ahmadian MR, Kabsch W, Wiesmuller L, Lautwein A, Schmitz F, Wittinghofer A (1997) The Ras-RasGAP complex: structural basis for GTPase activation and its loss in oncogenic Ras mutants. Science 277: 333–338 [DOI] [PubMed] [Google Scholar]
- Schief WR, Clark RH, Crevenna AH, Howard J (2004) Inhibition of kinesin motility by ADP and phosphate supports a hand-over-hand mechanism. Proc Natl Acad Sci USA 101: 1183–1188 [DOI] [PMC free article] [PubMed] [Google Scholar]
- Schliwa M (2003) Molecular Motors. Weinheim, Germany: Wiley-VCH Verlag [Google Scholar]
- Shipley K, Hekmat-Nejad M, Turner J, Moores C, Anderson R, Milligan R, Sakowicz R, Fletterick R (2004) Structure of a kinesin microtubule depolymerization machine. EMBO J 23: 1422–1432 [DOI] [PMC free article] [PubMed] [Google Scholar]
- Sindelar CV, Downing KH (2010) An atomic-level mechanism for activation of the kinesin molecular motors. Proc Natl Acad Sci USA 107: 4111–4116 [DOI] [PMC free article] [PubMed] [Google Scholar]
- Takai Y, Sasaki T, Matozaki T (2001) Small GTP-binding proteins. Physiol Rev 81: 153–208 [DOI] [PubMed] [Google Scholar]
- Tan D, Asenjo AB, Mennella V, Sharp DJ, Sosa H (2006) Kinesin-13s form rings around microtubules. J Cell Biol 175: 25–31 [DOI] [PMC free article] [PubMed] [Google Scholar]
- Vale RD, Milligan RA (2000) The way things move: looking under the hood of molecular motor proteins. Science 288: 88–95 [DOI] [PubMed] [Google Scholar]
- Wagenbach M, Domnitz S, Wordeman L, Cooper J (2008) A kinesin-13 mutant catalytically depolymerizes microtubules in ADP. J Cell Biol 183: 617–623 [DOI] [PMC free article] [PubMed] [Google Scholar]
- Walczak CE, Mitchison TJ, Desai A (1996) XKCM1: a Xenopus kinesin-related protein that regulates microtubule dynamics during mitotic spindle assembly. Cell 84: 37–47 [DOI] [PubMed] [Google Scholar]
- Woodward SK, Eccleston JF, Geeves MA (1991) Kinetics of the interaction of 2′(3′)-O-(N-methylanthraniloyl)-ATP with myosin subfragment 1 and actomyosin subfragment 1: characterization of two acto-S1-ADP complexes. Biochemistry 30: 422–430 [DOI] [PubMed] [Google Scholar]
- Yildiz A, Tomishige M, Vale RD, Selvin PR (2004) Kinesin walks hand-over-hand. Science 303: 676–678 [DOI] [PubMed] [Google Scholar]
Associated Data
This section collects any data citations, data availability statements, or supplementary materials included in this article.