

Abstract
There is substantial interpatient variation in recovery from upper limb impairment after stroke in patients with severe initial impairment. Defining recovery as a change in the upper limb Fugl-Meyer score (ΔFM), we predicted ΔFM with its conditional expectation (i.e., posterior mean) given upper limb Fugl-Meyer initial impairment (FMii) and a putative functional magnetic resonance imaging (fMRI) recovery measure. Patients with first time, ischemic stroke were imaged at 2.5 ± 2.2 days poststroke with 1.5-T fMRI during a hand closure task alternating with rest (fundamental frequency = 0.025 Hz, scan duration = 172 s). Confirming a previous finding, we observed that the prediction of ΔFM by FMii alone is good in patients with nonsevere initial hemiparesis but is not good in patients with severe initial hemiparesis (96% and 16% of the total sum of squares of ΔFM explained, respectively). In patients with severe initial hemiparesis, prediction of ΔFM by the combination of FMii and the putative fMRI recovery measure nonsignificantly increased predictive explanation from 16% to 47% of the total sum of squares of ΔFM explained. The implications of this preliminary negative result are discussed.
Keywords: fMRI, prediction, recovery, stroke
Introduction
Stroke is the leading cause of long-term disability among adults, and hemiparesis is the most common impairment after stroke (Wolfe 2000; Krakauer 2005). Recovery from hemiparesis can be considered from the perspectives of recovery of function (i.e., regaining the ability to perform a given task, but not necessarily through the same pattern of muscle activation as used to perform it prestroke) and recovery from impairment (i.e., regaining the ability to perform a given task through the same pattern of muscle activation as used to perform it prestroke). We are concerned here with prediction of recovery from impairment (Fugl-Meyer et al. 1975) rather than of recovery of function. This is because though recovery of function is of great socioeconomic importance, it is influenced by compensatory strategies (Lyle 1981; van der Lee et al. 1999; Kwakkel et al. 2004).
A substantial proportion of initial impairment is recovered in patients with first time, nonsevere hemiparesis by 3 months poststroke. Using the Fugl-Meyer scale, for example, we previously observed that a change in measure of recovery (measured as the change from initial impairment to impairment at 3 months poststroke) in such patients was well described as 0.70·initial impairment (Prabhakaran et al. 2008) (“proportional recovery”). Also, recovery at this time point tends to be near (say within 10% of) asymptotic recovery in this patient subpopulation (Duncan et al. 1992, 1994; Nakayama et al. 1994; Jorgensen et al. 1995, 1999; Kwakkel et al. 2004, 2006; Swayne et al. 2008; Verheyden et al. 2008; van Kuijk et al. 2009). The degree of regularity of the magnitude and time course of this recovery and its seeming robustness to rehabilitation dose (reviewed by Kwakkel et al. 2004) have suggested that it is mediated by a common, “spontaneous” mechanism.
In contrast to patients with nonsevere initial hemiparesis, ∼50% of stroke survivors that have severe initial hemiparesis remain so in the chronic state (Nakayama et al. 1994; Jorgensen et al. 1999; Hendricks et al. 2002; Kwakkel et al. 2003; Prabhakaran et al. 2008; van Kuijk et al. 2009). Motor-evoked potentials (MEPs) at the abductor digiti minimi using transcranial magnetic stimulation (TMS) 1 week poststroke in patients with severe initial impairment have a positive predictive value of ∼0.95 for recovery of some criterion dexterity at 3–6 months poststroke but tend to have less impressive negative predictive value (Hendricks, Pasman, Merx, et al. 2003; Hendricks, Pasman, van Limbeek, et al. 2003; Swayne et al. 2008; van Kuijk et al. 2009). This might 1) be an artifact of MEP threshold choice, 2) indicate that MEPs assayed within 1 week poststroke inherently cannot detect all usable, residual corticospinal (CST) connections early poststroke (perhaps due to diaschisis corticospinalis; Kwakkel et al. 2004), or 3) indicate that recovery from hand impairment can be effected through non-CST, cortical reorganization mechanisms. Furthermore, the positive predictive value of TMS-evoked MEPs has been observed to act through a delay of a few weeks such that a patient can be MEP positive while still having substantial recovery in front of him (Swayne et al. 2008; van Kuijk et al. 2009), which suggests that cortical reorganization is sometimes also required, above and beyond CST physiological integrity, to effect or complete recovery. For these reasons, if functional neuroimaging measures cortical reorganization, then it might provide information about subsequent recovery.
To wit, a multivariate correlation has been reported between early poststroke, task-related functional magnetic resonance imaging (fMRI) activation and subsequent recovery in a sample evincing a wide range of initial impairment (Marshall et al. 2009). However, the magnitude of this correlation does not directly (or at least simply) imply the accuracy of prediction of recovery based on fMRI. Here we formally assessed prediction of the same measure of recovery that we have assessed previously (Prabhakaran et al. 2008) from its posterior mean given the combined measurement of initial impairment and fMRI. We were particularly interested in the contribution of fMRI to prediction of recovery in patients with severe initial impairment as proportional recovery already seems to provide accurate prediction of recovery in patients with nonsevere initial impairment (Prabhakaran et al. 2008).
Among all possible functions of the random variables that are available as predictors (here, initial impairment and fMRI), the posterior mean minimizes the expectation of the squared prediction error (SPE) of the random variable to be predicted (here, recovery) (Shao 2003). Computation of a posterior mean requires a conditional probability density of recovery given initial impairment and fMRI; the form of this density is thus a hypothesis being assessed by the quality of the prediction. Moreover, the free parameters of this density need in practice to be estimated. Part of this report involves describing the form of this density and the estimation of its parameters.
Materials and Methods
Ethics Statement
Patients signed informed consent forms as approved by either Columbia University's or University of Freiburg's Institutional Review Boards.
Patient Samples
Two nonoverlapping patient samples were used in this study: 1) an imaged patient sample for which prediction of recovery was performed and 2) a nonimaged patient sample from which parameters for the joint density of recovery, initial impairment, and fMRI were obtained (Fig. 1). Both samples comprised patients with first time, ischemic stroke with some degree of clinical hemiparesis (NIH stroke scale for the arm ≥1 for both the patients studied at Columbia Medical Center and those studied at the University of Freiburg).
Figure 1.

Schematic of patient sample composition.
The patients of the imaged sample (N = 30; age = 60.3 ± 9.9 years; 21 male, 28 right handed) were recruited as part of Columbia's Specialized Program of Translational Research in Acute Stroke, an National Institute of Neurological Disorders and Stroke-funded national network to investigate new pathophysiological, diagnostic, and clinical approaches in acute stroke. Fourteen of these 30 patients were part of a sample used in a previous report that did not concern imaging (Prabhakaran et al. 2008). fMRI results from 23 of these 30 patients were reported previously in a paper that did not examine prospective prediction of recovery(Marshall et al. 2009).
The nonimaged patient sample (N = 64; age = 61.6 ± 11.6 years; 38 M, 59 right handed) comprised 24 patients from the University of Freiburg and 40 patients from Columbia Medical Center. Twenty-seven of these 64 patients were part of a sample used in a previous report that did not concern imaging (Prabhakaran et al. 2008). Patients with prior symptomatic subcortical stroke or any prior cortical stroke were excluded. Also excluded were patients with seizure at stroke onset, aphasia, neglect, any other cognitive impairment that precluded training on the fMRI task, or any contraindication to MRI. At Columbia Medical Center, aphasia was assessed with the Western Aphasia Battery (spontaneous speech, repetition, naming, and comprehension); neglect was assessed with line bisection, letter cancellation, and line judgment; and apraxia was assessed by pantomiming scissors. At the University of Freiburg, aphasia was assessed with part 9 of the NIH stroke scale and neglect was assessed with part 11 of the NIH stroke scale; apraxia was not assessed at the University of Freiburg.
fMRI Data Acquisition
Patients underwent gradient echo echoplanar fMRI (General Electric 1.5 T, 64 × 64 matrix, field of view = 19 cm, 21 slices, slice thickness/skip = 4.5 mm/0 mm, TR = 4000 ms, TE = 52 ms, flip angle = 60°) while performing the repetitive hand closure task described below. One session (43 volumes ó 2 min 52 s) was performed per hand. fMRI data preprocessing was performed as described previously (Marshall et al. 2009).
Motor Task Used during fMRI
The motor task comprised alternations of 20-s epochs for which patients had been instructed to attempt hand closure (the first such epoch beginning 12 s after initiation of scanning) with 20-s rest epochs. Four cycles were performed per hand. The instruction for hand closure blocks was to close the hand gently from a resting position to a fist in synchrony with a 1-Hz metronome click that was played continuously (during both attempted hand closure and rest epochs) via MRI-compatible headphones in the scanner. Auditory “start” and “stop” commands were given via the headphones at the beginning and end of each 20-s attempted hand closure block. Separate runs were performed for the affected hand and unaffected hand (only the data corresponding to use of the affected hand were used in the current analysis). For patients with complete hand plegia, instructions were to “do exactly what you did with your good hand.” That instructions were varied with initial impairment was understood to be an experimental design error in hindsight. Nevertheless, we could not conceive of any mechanism for how any confound of scanning design with initial impairment could artifactually improve prediction of recovery over initial impairment alone. Task performance was not measured, but grip force dynamometry score obtained on the day of scanning was included as a covariate in the second-level fMRI analyses (to prevent any task-related fMRI activation linearly related to dynamometry from contributing to prediction of recovery). Patients were familiarized with the task outside of the scanner. No formal assessment of mirror movements was performed; the potential effect of mirror movements on prediction is taken up in the Discussion section.
Measure of Impairment
We used the upper limb Fugl-Meyer score (FM) (Fugl-Meyer et al. 1975) as the upper limb impairment measure. The FM is a valid (Gladstone et al. 2002; Platz et al. 2005; Woodbury et al. 2008) and highly reliable (Duncan et al. 1983; Gowland et al. 1993; Gladstone et al. 2002; Platz et al. 2005; Prabhakaran et al. 2008) measure of upper limb impairment with a maximum score of 66 (higher score corresponds to less impairment). FM was assessed both at ∼2 days poststroke (FMinitial) and ∼3 months poststroke (FM3 months); more specifically, FMinitial (as well as grip force dynamometry score) was assessed in the imaged sample on the day of fMRI scanning (2.5 ± 2.2 days poststroke). FM3 months was assessed in the imaged sample at 96 ± 17 days poststroke. FMinitial was assessed in the nonimaged sample between 1 and 3 days poststroke (average not available). FM3 months was assessed in the nonimaged sample between 81 and 176 days poststroke (108 ± 25 days poststroke).
We chose 3 months as the intended endpoint because it has been shown that recovery from impairment tends to be near asymptote ≤3 months poststroke (Duncan et al. 1992; Jorgensen et al. 1995, 1999; Kwakkel et al. 2004, 2006; Swayne et al. 2008; van Kuijk et al. 2009). Initial impairment was defined as FMii = 66 − FMinitial.
Measure of Recovery
Our recovery measure was ΔFM = FM3 months − FMinitial. We chose ΔFM as opposed to FM3 months as the recovery measure because, from a physiological perspective, the process of recovery is not reflected in the final level of patient performance per se but is instead the mechanism that takes a patient from initial to final level of performance (Kwakkel et al. 2006; Prabhakaran 2008).
Dichotomous Categorization of Stroke Severity
A previous study of variability in stroke recovery (Prabhakaran et al. 2008) suggested to us that, up to some suitably high value of FMii, ΔFM was approximated well by the proportional recovery relationship:
| (1) |
with β = 0.70. At higher (i.e., more severe) values of FMii, however, this relationship qualitatively failed, with a nontrivial proportion of patients with severe FMii showing a much smaller ΔFM than that predicted by equation (1). Here, we consider the threshold FMii that determines this dichotomy in the relationship between ΔFM and FMii as a demarcation between nonsevere versus severe FMii. To get a reasonable estimate of this demarcation to be used for subsequent modeling steps, Rj (the correlation coefficient between ΔFM and FMii computed using the lowest value of FMii up to FMii,j, where j is an index of the ordered FMii values) was computed using the nonimaged sample and plotted against FMii,j. If equation (1) (for any fixed β) held throughout the entire range of FMii, then the resulting Rj versus FMii,j plot would tend to stabilize around a decelerating (but increasing) curve as FMii,j increased. In contrast, if there was a dichotomy as described above in the relationship between ΔFM and FMii, then the plot, after an initial period of stabilization, would begin to appreciably decrease in the neighborhood of some FMii,j. The plot showed this latter pattern of behavior (Fig. 2) and subjectively suggested FMii ≥ 56 (⇔FMinitial ≤ 10) as a reasonable definition of severe FMii. A patient with an FM of 10 in the upper limb would have a dense hemiparesis with some proximal movement but no distal movement. Using this criterion on the nonimaged sample itself yielded 46/64 patients with nonsevere FMii and 18/64 patients with severe FMii. Though it was determined in a completely different way, this criterion closely corresponds to the value of FMinitial chosen by one other group to define severe hemiparesis (Shelton and Reding 2001), but it is more inclusive than that used by another group, which defined as severe those patients with FMinitial = 0 (van Kuijk et al. 2009).
Figure 2.

Cumulative correlation coefficient (see text for description) versus FMii for the nonimaged sample. The arrow marks where we specified the (inclusive) threshold (which corresponds to FMii ≥ 56) for defining severe FMii based on where the cumulative correlation coefficient begins to decrease. We chose to place this threshold slightly before the apparent decrease so as to be less likely to misclassify severe strokes as nonsevere.
Model for Recovery versus Initial Impairment
The conditional probability density of ΔFM given FMii, fΔFM|FMii, is required for computing the posterior mean of ΔFM (see Posterior mean of ΔFM). Motivated by the previous finding described by equation (1), we assumed fundamentally a proportional recovery model,
| (2) |
with proportionality constant β and unexplained interpatient variation ϕ∼N(0,σϕ2) but with 2 flexible model features: First, it was not required that patients with nonsevere and severe FMii had the same β or σϕ2. Second, it was not required that all patients within a severity class had the same β or σϕ2. These modeling features were motivated by the data from a previous report (Prabhakaran et al. 2008), which suggested that β in patients with severe FMii took on more than one value (e.g., say 2: ∼0.70 and ∼0). These assumptions are formalized by stating that separate mixtures of proportional recovery models were allowed for patients with nonsevere and severe FMii; this implicitly defines fΔFM|FMii. For each severity category, the number of proportional recovery models K was varied from 1 to 6 and maximum likelihood estimates of (pl,βl,σϕ,l2)l = 1…K were obtained from the nonimaged sample (pl is the weight for the lth component). The Akaike Information Criterion (AIC) (Stone 1977; Burnham and Anderson 2002) was used to select among fΔFM|FMii. Details are provided in Section 3 of the Supplementary Material.
fMRI-Based Measurement of ΔFM
We obtained an fMRI-based measurement (Zj) of ΔFM in the jth patient in the imaged sample to serve as the fMRI information in computing the posterior mean of ΔFMj (see Posterior Mean of ΔFM). Zj is a corrected and normalized inner product of the jth patient's fMRI “task-related activation pattern” (; a standard first-level statistical parametric T-map (SPM) representing task-related activation) and a “recovery pattern” (; a standard second-level SPM [t] representing correlations between fMRI and ΔFM). For those unfamiliar with inner products, one can heuristically think of a regression model in which acts as the dependent variable and acts as the independent variable. Then Zj can be thought of as a regression coefficient of this model that is corrected for biases. A proof that Zj is an asymptotically unbiased estimator of ΔFMj (given the existence of some linear relationship between fMRI task-related activation and ΔFM) is provided in Section 2 of the Supplementary Material. This means that as itself is estimated (see next paragraph) from more and more fMRI data sets, the difference between E < Zj > and ΔFM gets closer to zero. The formula for Zj is provided in Section 1 of the Supplementary Material.
itself is estimated from standard linear regression based on , where A−j is an index set and hi is an optional vector of nuisance variables from patient i (see Section 1 of Supplementary Material); here hi comprised a constant term and grip force dynamometry score. To avoid artifactual contributions to the statistical relationship between Zj and ΔFMj, it is necessary that the observation not contribute to the computation of . Therefore, j ∈ A−j (hence the motivation for the choice of subscript for d−j), which makes Zj a cross-validatory (CV) estimator of ΔFMj (Stone 1974, 1977). This type of CV (known as either leave-one-out or N-fold CV) has the same purpose as split-half CV (Strother et al. 2002): to determine the prediction error for a dependent variable (in this case, ΔFMj) when applying model parameters (in this case, d−j) estimated from an independent sample. CV is not to be confused with bootstrapping (the purpose of the latter being estimation of the variance of an estimator of a model parameter μ by computing repeatedly via a resampling scheme; Efron and Tibshirani 1981). The principle of CV is fundamentally related to the idea behind the AIC (Stone 1977; Burnham and Anderson 2002). If were not estimated using CV, then estimation of SPE would be biased downward (i.e., it would lead to an overly optimistic assessment of prediction accuracy in future patients). The reason we used leave-one-out instead of split-half is that the former uses the maximum possible sample size for parameter estimation ( being a multidimensional parameter) with no drawback in terms of prediction validity. Software written in MATLAB used in conjunction with SPM5 (Wellcome Department of Imaging Neuroscience) to compute Zj as well as the fMRI data set are available from the authors upon request.
In addition to fΔFM|FMii(see Model for Recovery Versus Initial Impairment), fZ|ΔFM is also required for the computation of the posterior mean of ΔFM (see Posterior mean of ΔFM). It follows from the asymptotic unbiasedness of Z that (asymptotically)
| (3) |
where ϵj is a zero mean random variable. For expedience, we assume that ϵj has a Gaussian density, which implies that asymptotically fZ|ΔFM(Zj|ΔFMj) is a Gaussian density with mean ΔFMj and variance σϵ2; the poorer the accuracy of this assumption the poorer will be the prediction ΔFM. The maximum likelihood estimator of σϵ2 is
| (4) |
Posterior Mean of ΔFM
Given information about a realization of a random variable, the predictor (or, equivalently, estimator) of that random variable that minimizes the expected squared error is the expectation of that random variable with respect to the conditional density of the random variable given the information (Shao 2003). This density is called the “posterior density” in the context of Bayes’ theorem, and the expectation with respect to it is called “the posterior mean.” Here, we wished to predict ΔFM given the information about it contained in FMii and/or Z, and so we computed the appropriate posterior means.
Assuming that Z is conditionally independent of FMii given ΔFM, the posterior mean of ΔFM given FMii and Z can be shown to be (see Section 3 of Supplementary Material)
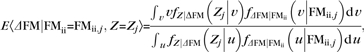 |
(5) |
where u and v are dummy variables of integration corresponding to the random variable ΔFM, which was approximated numerically. In addition to this model, 3 additional posterior means of ΔFM were computed: (conditioning on) FMii, Z and dichotomous stroke severity, or dichotomous stroke severity (formulae for these posterior means are provided in Supplementary eqs S3.7, 3.9, and S3.10, respectively, in Section 3 of the Supplementary Material).
For subject i of the imaged sample, the SPE of ΔFM
| (6) |
where , the prediction of ΔFMi, was computed under each model as the posterior mean. The critical test was the comparison of SPE under conditioning on FMii alone versus that under conditioning on FMii and Z in the severe subgroup. A 1-tailed, paired t-test was used for this comparison; the rationale for using a 1-tailed test is that the alternative hypothesis is that including fMRI improves prediction (i.e., lowers SPE) over using initial impairment alone.
Results
Age (average ± standard deviation = 60.3 ± 9.9 years), time between stroke and assessment of FMii (2.5 ± 2.2 days), lesion location, FMii (28.9 ± 23.1), ΔFM (14.9 ± 13.8), and acute dynamometry (12.3 ± 13.3 kg) for the individual patients of the imaged sample are presented in Table 1. Patients in the imaged sample were assessed for FMii and scanned with fMRI at 2.5 ± 2.2 days poststroke for 2 minutes 52 seconds per hand during the same MRI session as their clinical exams. Patients had been instructed just prior to scanning to attempt hand closure (for a specified hand) at an auditorily cued 1-Hz pace (alternating with rest epochs with matched auditory stimuli). Only fMRI data from the affected hand were used in this analysis. Follow-up for assessment of ΔFM in the imaged patient sample was at 93 ± 17 days poststroke.
Table 1.
Basic information for imaged sample
| Patient ID | Age on date of stroke | Time between stroke and FMii (days) | Lesion side | Lesion location | FMii | ΔFM | Acute dynamometry (kg) |
| 1 | 56 | 4 | R | IC | 62 | 0 | 0 |
| 2 | 51 | 1 | L | CR/IC | 5 | 5 | 19 |
| 3 | 59 | 2 | R | Pons | 3 | 3 | 11 |
| 4 | 70 | 4 | B | Pons | 9 | 6 | 33 |
| 5 | 48 | 2 | R | Caudate/putamen | 3 | 3 | 28 |
| 6 | 47 | 3 | L | Pons | 42 | 39 | 1 |
| 7 | 65 | 2 | R | S1/M1/inferior parietal | 41 | 38 | 0 |
| 8 | 63 | 1 | L | Thalamus/IC | 35 | 26 | 0 |
| 9 | 59 | 2 | L | Insula/CR | 61 | 6 | 0 |
| 10 | 65 | 2 | R | CR | 20 | 15 | 5 |
| 11 | 77 | 2 | R | Superior parietal/S1/M1 | 45 | 34 | 0 |
| 12 | 67 | 3 | R | IC | 52 | 26 | 0 |
| 13 | 56 | 3 | R | CR/external capsule | 60 | 0 | 0 |
| 14 | 59 | 3 | L | Pons | 60 | 40 | 0 |
| 15 | 42 | 1 | L | Insula/CR | 7 | 7 | 26 |
| 16 | 69 | 2 | L | Temporal/occipital/pons | 29 | 27 | 0 |
| 17 | 78 | 2 | B | Occipital/insula/frontal/CR | 48 | 35 | 0 |
| 18 | 43 | 2 | R | Pons | 17 | 13 | 30 |
| 19 | 48 | 1 | L | IC | 4 | 3 | 21 |
| 20 | 72 | 2 | L | Frontal/insula | 2 | 2 | 16 |
| 21 | 60 | 2 | L | Temporal/parietal/pons | 17 | 15 | 27 |
| 22 | 45 | 1 | R | CR | 4 | 4 | 40 |
| 23 | 59 | 1 | L | Pons | 58 | 32 | 1 |
| 24 | 67 | 2 | R | Midbrain/pons | 20 | 18 | 11 |
| 25 | 61 | 3 | R | Frontal/temporal/parietal | 18 | 9 | 23 |
| 26 | 58 | 2 | L | Thalamus/IC | 16 | 12 | 26 |
| 27 | 72 | 2 | R | Pons | 3 | 1 | 28 |
| 28 | 72 | 4 | R | IC/CR | 2 | 1 | 24 |
| 29 | 67 | 13 | B | Medulla/pons | 62 | 28 | 0 |
| 30 | 55 | 1 | L | Pons | 61 | −1 | 0 |
Note: CR, corona radiata; IC, internal capsule; M1, primary motor cortex; S1, primary sensory cortex; R, right; L, left side; B, bilateral.
Twelve out of 30 patients of the imaged sample had an acute dynamometry score of 0 kg (Table 1) and thus are likely to have been unable to execute the instructions of the motor task. Formally, however, the experimental condition was not the performance of the task but was rather the instruction to perform the task: behavior is never directly under experimental control and so cannot be properly thought of as an experimental variable. Behavior was not measured, but acute dynamometry score was used as a covariate in the estimation of CV fMRI recovery pattern expression (Z), and so any task-related fMRI activation linearly related to dynamometry could not contribute to prediction of recovery through Z. For example, if task-related activation was simply a reflection of dynamometry score, then Z would be pure noise with respect to ΔFM, even though dynamometry and ΔFM are correlated (R = 0.56, 2-tailed P = 0.001).
Z was computed in a CV fashion by essentially taking the inner product of a given patient's task-related fMRI activation data with an estimated fMRI recovery pattern whose computation involved neither that patient's fMRI data nor their ΔFM. Z was significantly correlated with ΔFM in the net imaged sample (R = 0.56, 1-tailed P < 0.001; it is not a typo that this is the same R value as immediately previous). While this result is more robust than a correlation between non-CV recovery pattern expression and ΔFM, it still does not directly indicate the accuracy of prediction. Thus, we also assessed SPE (squared prediction error, an explicit measure of prediction accuracy) in the imaged sample for posterior means of ΔFM given FMii and/or Z. To facilitate appreciation of the magnitude of SPE relative to the range of the FM (0–66), below we will express SPE in the form of “x2,” where x is thus in FM units.
The posterior mean of ΔFM given FMii required an estimated fΔFM|FMii (which was allowed to be a mixture of K proportional recovery models for each severity category) and fZ|ΔFM. Based on fitting using the nonimaged sample, the minimum AIC fΔFM|FMii for the patients with nonsevere FMii was K = 3 (, , , , , , , , ) and the minimum AIC model for the patients with severe FMii was K = 1 (, , ). We were surprised that a 1-component model fit best for the severe FMii group given our previous findings suggesting a mixture of 2 proportional recovery models (one with β ∼ 0.7 and one with β ∼ 0) (Prabhakaran et al. 2008). Visual inspection of the nonimaged sample data confirmed, however, that there was a more even distribution of ΔFM in the patients with severe FMii from the University of Freiburg (who were not represented in that study) than from Columbia University (who were); we proceeded regardless. The sole parameter of fZ|ΔFM is σϵ2. Its maximum likelihood estimator was obtained from Z and ΔFM in the imaged sample: .
A preliminary remark is that it is not a mathematical necessity that SPEs decrease (just as the AIC need not decrease) as more information is added to the prediction algorithm; this can be contrasted with the necessary increase of R2 for a linear regression model as the rank of the design matrix increases. We now present the (average) SPE in the net imaged sample for the various posterior means of ΔFM: The SPE of the posterior mean of ΔFM given dichotomous stroke severity was 162. The SPE given FMii was 102, while the SPE given FMii and Z was 82. The decrease in SPE in the net imaged sample from using FMii to using FMii and Z was not significant (t(29) = 1.14, 1-tailed P = 0.13).
A more meaningful understanding of the effect of conditioning is provided by looking at SPE separately in the nonsevere (N = 23) and severe (N = 7) FMii patient subgroups of the imaged sample (Table 2; Fig. 3). SPE tends to be much greater in all models in the patients with severe FMii. Relative to conditioning on dichotomous stroke severity alone, conditioning on FMii improves SPE only in the patients with nonsevere FMii (nonsevere FMii: ΔSPE = 132, t(22) = 5.89, 1-tailed P < 0.0001; severe FMii: ΔSPE = −22, t(6) = −0.66, 1-tailed P = 0.73). Relative to conditioning on FMii, conditioning on FMii and Z improves SPE meaningfully, although not significantly, only in the patients with severe FMii (nonsevere FMii: ΔSPE = 22, t(22) = 0.98, 1-tailed P = 0.17; severe FMii: ΔSPE = 122, t(6) = 1.03, 1-tailed P = 0.17).
Table 2.
Mean SPE of ΔFM for various prediction models (columns)
| Severe/nonsevere classification | FMii | Z and severe/nonsevere classification | FMii and Z | |
| Net imaged sample (N = 30) | 162 | 102 | 132 | 82 |
| Patients with severe FMii (N = 7) | 202 | 202 | 162 | 162 |
| Patients with nonsevere FMii (N = 23) | 142 | 42 | 122 | 32 |
Figure 3.

Predicted (posterior mean) versus observed ΔFM when using either 1) FMii (patients with nonsevere FMii: white squares; patients with severe FMii: black squares) or 2) FMii and Z (patients with nonsevere FMii: red circles; patients with severe FMii: blue circles) as the information in determining the posterior density of ΔFM. The SPE for a given datum is the (vertical distance to the identity line)2. All data plotted correspond to the imaged sample.
A way of reexpressing SPE for a given predictive model is in terms of the percentage of the total sum of squares of ΔFM explained by that model, which equals 100·(1 − [mean SPE for that model]/[mean ΔFM2]). Unlike R2, this value need not be positive. For patients with nonsevere FMii, this value was 96% and 97% when conditioning on FMii and [FMii, Z], respectively. For patients with severe FMii, this value was 16% and 47% when conditioning on FMii and [FMii, Z], respectively.
Discussion
Our opinion is that one focus of stroke research should be the development of novel, early poststroke treatments (Turton and Pomeroy 2002; Biernaskie et al. 2004) for those patients likely to remain severely hemiparetic under current standard care. Such treatments might include noninvasive brain stimulation (Williams et al. 2009) and robotics-based rehabilitation (Huang and Krakauer 2009). However, as such alternative treatments are likely to be more costly in terms of patient effort and healthcare resources than standard care, one ideally wants to exclude patients who would recover substantially under standard care from such alternative treatments. For this purpose, early poststroke prediction should have high sensitivity for recovery. But of course, a high specificity would be desired as well in order to have a low chance of mistakenly excluding patients who will not sufficiently recover. Thus, a generally accurate prediction algorithm would be useful for developing and applying new treatments. An alternative rationale for early prediction of recovery that is more relevant for the current state of treatment is to inform patients and family about expected outcomes and also to direct physical and occupation therapists to focus on compensatory strategies rather than recovery from impairment. A promising prediction finding in this regard is that the presence of finger extension and shoulder abduction 72 h poststroke yielded positive and negative predictive values for some recovery of upper limb dexterity using the action research arm test (ARAT) (for a brief description of the ARAT, which assesses function, see Van der Lee et al. 2001) of 0.98 and 0.75, respectively (Nijland et al. 2010). Here we assessed the contribution of fMRI (through Z) to prediction of recovery from impairment at 2–3 days poststroke. The combination of Z and FMii led to a nonsignificant increase from 16% to 47% of the total sum of squares of ΔFM explained in patients with severe FMii. Assuming the effect size observed here for patients with severe FMii, 42 patients with severe FMii would be required for power = 0.80 (58 for power = 0.90; 73 for power = 0.95) to detect such a reduction. However, these sample size calculations are conservative in that as imaged sample size increases, σϵ2 would also decrease (and consequently decrease SPE when using Z), while these sample size calculations assume it will remain constant. Likewise, use of a larger sample size to estimate fΔFM|FMii would also tend to lower SPE, while these sample size calculations do not account for such effects. Regardless, we take our negative statistical result with regard to prediction as inconclusive. The significant correlation between Z and ΔFM could be taken as an impetus for sufficiently powered studies. Such studies might also be performed at higher field strength and acquire at larger voxel sizes to increase signal:noise ratio.
Another reason to consider the negative result inconclusive is the nature of the samples used. We estimated fΔFM|FMii from a nonimaged sample combined from 2 institutions. Though the samples were similar in terms of clinical inclusion and exclusion criteria, they were unlikely to be matched genetically, educationally, or socioeconomically (factors which could conceivably affect recovery). We qualitatively observed (after the decision had been made to use the combined sample) that the patients with severe initial impairment from the University of Freiburg had a less stark dichotomy of ΔFM than those from Columbia University. This made fΔFM|FMii for this severity a single broad Gaussian rather than 2 well-separated, narrower ones (the latter having been our hypothesis based on the results of a previous study; Prabhakaran et al. 2008). As the imaged sample (exclusively from Columbia University) manifested dichotomous ΔFM, a speculative explanation for the unimpressive performance of the posterior mean based on Z and FMii is that fΔFM|FMiiwas too far from ground truth for the population from which the imaged sample was obtained. In hindsight, we recognize that we were overeager to expand our sample size for estimating fΔFM|FMii and consequently did not consider the possibility of important systematic differences in populations sampled by the 2 institutions; we hope to be more careful in our future work.
Current Level of Impairment and Subsequent Recovery Could Have Different Neural Correlates
While the purpose here was simply to predict ΔFM from FMii and fMRI, rather than characterize the brain mechanisms of recovery, it is important to make clear how the experimental design we employed relates to those of previous relevant brain imaging studies of stroke. Previous such studies can be dichotomized into longitudinal (Marshall et al. 2000; Calautti et al. 2001; Feydy et al. 2002; Ward et al. 2003b,) and cross-sectional (Ward et al. 2003a; Loubinoux et al. 2003; Loubinoux et al. 2003; Loubinoux et al. 2007; Jang et al. 2004) designs; the design of the current study was cross-sectional. Ward et al. (2003a, 2004) have argued that the existence of positive cross-sectional correlations between activation and impairment at the time of scanning in both the early and chronic periods indicates that patients with more severe impairment need to utilize “secondary motor areas” to a greater extent than less impaired patients in order to generate motor output (which is nevertheless suboptimal). This hypothesis is supported by a study that showed that the slowing of reaction time induced by TMS applied to contralesional dorsal premotor cortex correlates with the degree of impairment (Johansen-Berg et al. 2002). However, it is not clear how the cross-sectional correlations observed by Ward et al. (2003a, 2004) relate, either in a causal sense or simply in a correlative sense, to subsequent recovery (i.e., recovery that manifests behaviorally after the time of imaging). Spatial signatures for these 2 types of theoretical activation signals (considered at any fixed time poststroke), those related to current level of impairment (ostensibly reflected in the results of Ward et al. 2003a, 2004) and those related to subsequent recovery (ostensibly contributing to the current prediction results and similarly to the correlations from our previous imaging study), need not be the same. This is because the failure of proportional recovery in patients with severe initial impairment uncouples current level of impairment and subsequent recovery; conversely, in the absence of patients with severe initial impairment who recover very little, it would not be possible to disambiguate the neural correlates of current level of impairment and subsequent recovery. It is therefore of note that the studies of Ward et al. (2003b, 2004) seem not to have included any such patients, which implies that their reported correlations from the early period could be an admixture of those related to current level of impairment and those related to subsequent recovery. This could possibly be an explanation of their finding that certain correlations detected early were not detected later poststroke (the ones only detected early possibly being related to subsequent recovery) (Ward et al. 2003b, 2004).
Three cross-sectional studies have concerned correlation and/or prediction of future impairment level (as opposed to change in impairment) (Loubinoux et al. 2003; Jang et al. 2004; Loubinoux et al. 2007). Two of these studies from the same group were correlative (i.e., not predictive) and yielded inconsistent results with respect to one another (Loubinoux et al. 2003, 2007). The third study (Jang et al. 2004) attempted prospective prediction based on an arbitrary decision criterion applied to voxel-wise activation data in a primary sensorimotor cortical region of interest; the resulting prediction accuracy was poor. This type of approach was not devised to be optimal given the region of interest chosen, nor did it reasonably weight all potential spatial sources of relevant functional imaging signal (Kjems et al. 2002; Strother et al. 2002; O'Toole et al. 2007). In contrast, the approach taken in the current study was to use the posterior mean (which is an optimal estimator given a conditional density) and also to use all the linear information about ΔFM present in multivariate fMRI data (not just that from a single region of interest). However, neither study yielded impressive prediction.
MEPs and Recovery in Patients with Severe Initial Impairment
The volume of anatomical damage per se seems insufficient to explain the majority of the variation in recovery in patients with severe initial impairment (Binkofski et al. 2001; Shelton and Reding 2001; Konishi et al. 2005; Cho et al. 2007). MEPs ostensibly measure the functional nature of the damage sustained to the CST (van Kuijk et al. 2005), as opposed to the total lesion volume. Pooling data from 3 studies that examined MEPs in hemiplegic patients within the first 10 days poststroke (Hendricks et al. 1997; Hendricks, Pasman, Merx et al. 2003; van Kuijk et al. 2009), positive predictive value for recovery was 0.94 and negative predictive value was 0.83. Thus, while it does seem that the degree of functional CST damage is a critical determinant of recovery, recovery is possible in 15–20% of cases where functional CST damage seems complete; this recovery could depend on brain plasticity. Moreover, patients MEP+ at 1 week tend not to reach their recovery endpoints until 1–3 months later (Swayne et al. 2008), which suggests that even in the presence of residual monosynaptic connections from primary motor cortex (M1) to spinal motoneurons, some sort of plasticity mechanism which lasts for several weeks poststroke is required to allow their effective use. fMRI could be sensitive to these putative brain plasticity mechanisms. It would therefore be of interest to specify a conditional density (or better, several densities representing different hypotheses) for recovery given initial impairment, fMRI, and MEPs.
Caveats
No behavioral measure was acquired during imaging. Therefore, the correlation between Z and ΔFM could be due to individual differences in behavior during imaging. Such behavior can include, but is not limited to, mirror movements, which have been estimated to occur 70% of the time during repetitive squeezes using the affected hand and correlate with severity of impairment of the affected hand (Nelles et al. 1998). Activation of contralesional motor cortex correlates with individual differences in mirror movements in hemiparetic stroke patients (Wittenberg et al. 2000; Kim et al. 2003). However, even if individual differences in the degree of mirror movements during imaging were causal to the observed correlation between Z and ΔFM, it would not invalidate prediction of ΔFM based on fMRI using the current design. This is because the metric for prediction is the magnitude of prediction error; nothing more, nothing less (Akaike 1974). While it is true that the inclusion of more controls at the experimental design (e.g., clamp performance in the scanner) and/or analysis stages (e.g., include a covariate for performance in the scanner) could potentially improve prediction by reducing the variance of dˆ, it is logically incorrect to say that a degree of prediction obtained in the absence of such controls “does not count” or is “artificially too high.” This is an important difference between predictive and causal modeling, and this was a prediction study.
If the correlation between Z and ΔFM were caused only by correlations between 1) FMii and the degree of mirror movements (Nelles et al. 1998), 2) mirror movements and contralesional M1 activation (Wittenberg et al. 2000; Kim et al. 2003), and 3) FMii and ΔFM (Prabhakaran et al. 2008), then (assuming the measurement noise of FMii is negligible) Z would not improve the prediction of ΔFM over that provided by FMii alone. The empirical result was that while recovery pattern expression was significantly correlated with recovery, its contribution to the prediction of recovery over that provided by initial impairment alone was not statistically significant. Thus, the result is on its face consistent with mirror movements having contributed to recovery pattern expression. In future studies, mirror movements could be measured quantitatively and included as a covariate in recovery pattern estimation (see fMRI-based Measurement of ΔFM); this would eliminate any (linear) contribution of mirror movements to Z. Doing so could 1) reduce unexplained variability in the fMRI data (good for prediction, as it ceteris paribus decreases the variance of the recovery pattern  and hence decreases σϵ2), 2) reduce the amount of variation in the fMRI data uniquely attributable to ΔFM (bad for prediction, as it ceteris paribus increases variance of and hence increases σϵ2), and 3) increase the complexity of the model by adding more parameters (which is bad for prediction, as it ceteris paribus increases σϵ2). The net effect on the accuracy of prediction of ΔFM would depend on the balance of these effects.
It is possible that some patients did not perform the instructed movement with the affected hand at all during imaging. Indeed, 12/30 patients in the imaged sample had a grip force dynamometry score (of the affected hand) of 0 on the day of scanning; recovery was heterogeneous in this subgroup (Table 1). In the prediction algorithm, both the estimation of d and the computation of Z use dynamometry score as a covariate such that any systematic component of the fMRI signal that is linearly dependent on grip force dynamometry has no effect on the prediction of ΔFM. Thus, if the intensity of movement (say the across-click average of the maximal torque produced by the effector per metronome click) during scanning is linearly related to dynamometry score, then whether subjects actually moved or not is irrelevant to prediction of ΔFM in this model. If instead, the intensity of movement during scanning is only weakly correlated with dynamometry score (or not correlated at all) and if the pattern of brain activation associated with intensity of movement is strongly “spatially” correlated with the recovery pattern, then this would reduce the signal:noise of Z (as the random, unmodeled variations across subjects in intensity of movement during scanning would lead to activations similar to those associated with recovery and hence add noise to Z) and hence worsen prediction. If this were the case, then measurement of the intensity of movement within the scanner would allow for improved prediction. A third possibility is that brain activation correlates of recovery are modulated by the intensity of movement; if so, failure (as in the current study) to account for this modulation (i.e., interaction) would lead to a worsened prediction. It is again worth noting that there is no way that failure to account for movement (or anything else) could lead to an artificially good prediction of ΔFM.
The patients in the imaged sample had predominantly subcortical strokes. It is an empirical question as to whether fMRI would contain predictive information about recovery for large cortical strokes. If the cortical regions damaged were critical for recovery, then perhaps this would be reflected in lower Z (in which case, the predictive information of Z would be preserved).
Conclusion
In conclusion, we found that prediction of recovery in patients with nonsevere initial impairment was accurate based on initial impairment alone. In contrast, prediction of recovery in patients with severe initial impairment was poor based on initial impairment alone and was not statistically significantly improved by the inclusion of fMRI acquired at 2 days poststroke. However, the significant correlation between fMRI and recovery might provide a motivation for further assessment of prediction using adequately powered studies and more carefully considered samples.
Supplementary Material
Supplementary material can be found at: http://www.cercor.oxfordjournals.org/
Funding
National Institute of Health (grant numbers NIH K02NS048099 and NIH R01 NS052804 to J.W.K., NIH 5P50NS049060 to R.S.M.); Gatsby Initiative in Brain Circuitry to E.Z.
Supplementary Material
Acknowledgments
We thank Katherine O'Brien for helping in data collection, Allison Speizer and Brandon Minzer for assisting in patient recruitment and collection of experimental data, and Dr Joy Hirsch for providing technical and experimental support. Conflict of Interest: None declared.
References
- Akaike H. New look at statistical-model identification. IEEE Trans Automat Contr. 1974;Ac19:716–723. [Google Scholar]
- Biernaskie J, Chernenko G, Corbett D. Efficacy of rehabilitative experience declines with time after focal ischemic brain injury. J Neurosci. 2004;24:1245–1254. doi: 10.1523/JNEUROSCI.3834-03.2004. [DOI] [PMC free article] [PubMed] [Google Scholar]
- Binkofski F, Seitz RJ, Hacklander T, Pawelec D, Mau J, Freund HJ. Recovery of motor functions following hemiparetic stroke: a clinical and magnetic resonance-morphometric study. Cerebrovasc Dis. 2001;11:273–281. doi: 10.1159/000047650. [DOI] [PubMed] [Google Scholar]
- Burnham KP, Anderson DR. Model selection and multimodel inference: a practical information-theoretic approach. New York (NY): Springer-Verlag; 2002. [Google Scholar]
- Calautti C, Leroy F, Guincestre JY, Baron JC. Dynamics of motor network overactivation after striatocapsular stroke: a longitudinal PET study using a fixed-performance paradigm. Stroke. 2001;32:2534–2542. doi: 10.1161/hs1101.097401. [DOI] [PubMed] [Google Scholar]
- Cho SH, Kim SH, Choi BY, Kang JH, Lee CH, Byun WM, Jang SH. Motor outcome according to diffusion tensor tractography findings in the early stage of intracerebral hemorrhage. Neurosci Lett. 2007;421:142–146. doi: 10.1016/j.neulet.2007.04.052. [DOI] [PubMed] [Google Scholar]
- Duncan PW, Goldstein LB, Horner RD, Landsman PB, Samsa GP, Matchar DB. Similar motor recovery of upper and lower extremities after stroke. Stroke. 1994;25:1181–1188. doi: 10.1161/01.str.25.6.1181. [DOI] [PubMed] [Google Scholar]
- Duncan PW, Goldstein LB, Matchar D, Divine GW, Feussner J. Measurement of motor recovery after stroke. Outcome assessment and sample size requirements. Stroke. 1992;23:1084–1089. doi: 10.1161/01.str.23.8.1084. [DOI] [PubMed] [Google Scholar]
- Duncan PW, Propst M, Nelson SG. Reliability of the Fugl-Meyer assessment of sensorimotor recovery following cerebrovascular accident. Phys Ther. 1983;63:1606–1610. doi: 10.1093/ptj/63.10.1606. [DOI] [PubMed] [Google Scholar]
- Efron B, Tibshirani R. Statistical data analysis in the computer age. Science. 1981;253:390–395. doi: 10.1126/science.253.5018.390. [DOI] [PubMed] [Google Scholar]
- Feydy A, Carlier R, Roby-Brami A, Bussel B, Cazalis F, Pierot L, Burnod Y, Maier MA. Longitudinal study of motor recovery after stroke: recruitment and focusing of brain activation. Stroke. 2002;33:1610–1617. doi: 10.1161/01.str.0000017100.68294.52. [DOI] [PubMed] [Google Scholar]
- Fugl-Meyer AR, Jaasko L, Leyman I, Olsson S, Steglind S. The post-stroke hemiplegic patient. 1. A method for evaluation of physical performance. Scand J Rehabil Med. 1975;7:13–31. [PubMed] [Google Scholar]
- Gladstone DJ, Danells CJ, Black SE. The Fugl-Meyer assessment of motor recovery after stroke: a critical review of its measurement properties. Neurorehabil Neural Repair. 2002;16:232–240. doi: 10.1177/154596802401105171. [DOI] [PubMed] [Google Scholar]
- Gowland C, Stratford P, Ward M, Moreland J, Torresin W, Van Hullenaar S, Sanford J, Barreca S, Vanspall B, Plews N. Measuring physical impairment and disability with the Chedoke-McMaster Stroke Assessment. Stroke. 1993;24:58–63. doi: 10.1161/01.str.24.1.58. [DOI] [PubMed] [Google Scholar]
- Hendricks HT, Hageman G, van Limbeek J. Prediction of recovery from upper extremity paralysis after stroke by measuring evoked potentials. Scand J Rehabil Med. 1997;29:155–159. [PubMed] [Google Scholar]
- Hendricks HT, Pasman JW, Merx JL, van Limbeek J, Zwarts MJ. Analysis of recovery processes after stroke by means of transcranial magnetic stimulation. J Clin Neurophysiol. 2003;20:188–195. doi: 10.1097/00004691-200305000-00004. [DOI] [PubMed] [Google Scholar]
- Hendricks HT, Pasman JW, van Limbeek J, Zwarts MJ. Motor evoked potentials in predicting recovery from upper extremity paralysis after acute stroke. Cerebrovasc Dis. 2003;16:265–271. doi: 10.1159/000071126. [DOI] [PubMed] [Google Scholar]
- Hendricks HT, van Limbeek J, Geurts AC, Zwarts MJ. Motor recovery after stroke: a systematic review of the literature. Arch Phys Med Rehabil. 2002;83:1629–1637. doi: 10.1053/apmr.2002.35473. [DOI] [PubMed] [Google Scholar]
- Huang VS, Krakauer JW. Robotic neurorehabilitation: a computational motor learning perspective. J Neuroeng Rehabil. 2009;6:5. doi: 10.1186/1743-0003-6-5. [DOI] [PMC free article] [PubMed] [Google Scholar]
- Jang SH, Kim YH, Chang Y, Han BS, Byun WM, Chang CH. The predictive value of cortical activation by passive movement for motor recovery in stroke patients. Restor Neurol Neurosci. 2004;22:59–63. [PubMed] [Google Scholar]
- Johansen-Berg H, Rushworth MF, Bogdanovic MD, Kischka U, Wimalaratna S, Matthews PM. The role of ipsilateral premotor cortex in hand movement after stroke. Proc Natl Acad Sci U S A. 2002;99:14518–14523. doi: 10.1073/pnas.222536799. [DOI] [PMC free article] [PubMed] [Google Scholar]
- Jorgensen HS, Nakayama H, Raaschou HO, Olsen TS. Stroke. Neurologic and functional recovery: the Copenhagen stroke study. Phys Med Rehabil Clin N Am. 1999;10:887–906. [PubMed] [Google Scholar]
- Jorgensen HS, Nakayama H, Raaschou HO, Vive-Larsen J, Stoier M, Olsen TS. Outcome and time course of recovery in stroke. Part II: time course of recovery. The Copenhagen Stroke Study. Arch Phys Med Rehabil. 1995;76:406–412. doi: 10.1016/s0003-9993(95)80568-0. [DOI] [PubMed] [Google Scholar]
- Kim YH, Jang SH, Chang Y, Byun WM, Son S, Ahn SH. Bilateral primary sensori-motor cortex activation of post-stroke mirror movements: an fMRI study. Neuroreport. 2003;14:1329–1332. doi: 10.1097/01.wnr.0000078702.79393.9b. [DOI] [PubMed] [Google Scholar]
- Kjems U, Hansen LK, Anderson J, Frutiger S, Muley S, Sidtis J, Rottenberg D, Strother SC. The quantitative evaluation of functional neuroimaging experiments: mutual information learning curves. Neuroimage. 2002;15:772–786. doi: 10.1006/nimg.2001.1033. [DOI] [PubMed] [Google Scholar]
- Konishi J, Yamada K, Kizu O, Ito H, Sugimura K, Yoshikawa K, Nakagawa M, Nishimura T. MR tractography for the evaluation of functional recovery from lenticulostriate infarcts. Neurology. 2005;64:108–113. doi: 10.1212/01.WNL.0000148477.65273.0C. [DOI] [PubMed] [Google Scholar]
- Krakauer JW. Arm function after stroke: from physiology to recovery. Semin Neurol. 2005;25:384–395. doi: 10.1055/s-2005-923533. [DOI] [PubMed] [Google Scholar]
- Kwakkel G, Kollen B, Lindeman E. Understanding the pattern of functional recovery after stroke: facts and theories. Restor Neurol Neurosci. 2004;22:281–299. [PubMed] [Google Scholar]
- Kwakkel G, Kollen B, Twisk J. Impact of time on improvement of outcome after stroke. Stroke. 2006;37:2348–2353. doi: 10.1161/01.STR.0000238594.91938.1e. [DOI] [PubMed] [Google Scholar]
- Kwakkel G, Kollen BJ, van der Grond J, Prevo AJ. Probability of regaining dexterity in the flaccid upper limb: impact of severity of paresis and time since onset in acute stroke. Stroke. 2003;34:2181–2186. doi: 10.1161/01.STR.0000087172.16305.CD. [DOI] [PubMed] [Google Scholar]
- Loubinoux I, Carel C, Pariente J, Dechaumont S, Albucher JF, Marque P, Manelfe C, Chollet F. Correlation between cerebral reorganization and motor recovery after subcortical infarcts. Neuroimage. 2003;20:2166–2180. doi: 10.1016/j.neuroimage.2003.08.017. [DOI] [PubMed] [Google Scholar]
- Loubinoux I, Dechaumont-Palacin S, Castel-Lacanal E, De Boissezon X, Marque P, Pariente J, Albucher JF, Berry I, Chollet F. Prognostic value of FMRI in recovery of hand function in subcortical stroke patients. Cereb Cortex. 2007;17:2980–2987. doi: 10.1093/cercor/bhm023. [DOI] [PubMed] [Google Scholar]
- Lyle RC. A performance test for assessment of upper limb function in physical rehabilitation treatment and research. Int J Rehabil Res. 1981;4:483–492. doi: 10.1097/00004356-198112000-00001. [DOI] [PubMed] [Google Scholar]
- Marshall RS, Perera GM, Lazar RM, Krakauer JW, Constantine RC, DeLaPaz RL. Evolution of cortical activation during recovery from corticospinal tract infarction. Stroke. 2000;31:656–661. doi: 10.1161/01.str.31.3.656. [DOI] [PubMed] [Google Scholar]
- Marshall RS, Zarahn E, Alon L, Minzer B, Lazar RM, Krakauer JW. Early imaging correlates of subsequent motor recovery after stroke. Ann Neurol. 2009;65:596–602. doi: 10.1002/ana.21636. [DOI] [PMC free article] [PubMed] [Google Scholar]
- Nakayama H, Jorgensen HS, Raaschou HO, Olsen TS. Compensation in recovery of upper extremity function after stroke: the Copenhagen Stroke Study. Arch Phys Med Rehabil. 1994;75:852–857. doi: 10.1016/0003-9993(94)90108-2. [DOI] [PubMed] [Google Scholar]
- Nelles G, Cramer SC, Schaechter JD, Kaplan JD, Finklestein SP. Quantitative assessment of mirror movements after stroke. Stroke. 1998;29:1182–1187. doi: 10.1161/01.str.29.6.1182. [DOI] [PubMed] [Google Scholar]
- Nijland RH, van Wegen EE, Harmeling-van der Wel BC, Kwakkel G. Presence of finger extension and shoulder abduction within 72 hours after stroke predicts functional recovery: early prediction of functional outcome after stroke: the EPOS cohort study. Stroke. 2010;41:745–750. doi: 10.1161/STROKEAHA.109.572065. [DOI] [PubMed] [Google Scholar]
- O'Toole AJ, Jiang F, Abdi H, Penard N, Dunlop JP, Parent MA. Theoretical, statistical, and practical perspectives on pattern-based classification approaches to the analysis of functional neuroimaging data. J Cogn Neurosci. 2007;19:1735–1752. doi: 10.1162/jocn.2007.19.11.1735. [DOI] [PubMed] [Google Scholar]
- Platz T, Pinkowski C, van Wijck F, Kim IH, di Bella P, Johnson G. Reliability and validity of arm function assessment with standardized guidelines for the Fugl-Meyer Test, Action Research Arm Test and Box and Block Test: a multicentre study. Clin Rehabil. 2005;19:404–411. doi: 10.1191/0269215505cr832oa. [DOI] [PubMed] [Google Scholar]
- Prabhakaran S, Zarahn E, Riley C, Speizer A, Chong JY, Lazar RM, Marshall RS, Krakauer JW. Inter-individual variability in the capacity for motor recovery after ischemic stroke. Neurorehabil Neural Repair. 2008;22:64–71. doi: 10.1177/1545968307305302. [DOI] [PubMed] [Google Scholar]
- Shao J. Mathematical statistics. New York (NY): Springer; 2003. [Google Scholar]
- Shelton FN, Reding MJ. Effect of lesion location on upper limb motor recovery after stroke. Stroke. 2001;32:107–112. doi: 10.1161/01.str.32.1.107. [DOI] [PubMed] [Google Scholar]
- Stone M. Cross-validatory choice and assessment of statistical predictions. J R Stat Soc Series B Methodol. 1974;36:111–147. [Google Scholar]
- Stone M. An asymptotic equivalence of choice of model by cross-validation and Akaikes criterion. J R Stat Soc Series B Stat Methodol. 1977;39:44–47. [Google Scholar]
- Strother SC, Anderson J, Hansen LK, Kjems U, Kustra R, Sidtis J, Frutiger S, Muley S, LaConte S, Rottenberg D. The quantitative evaluation of functional neuroimaging experiments: the NPAIRS data analysis framework. Neuroimage. 2002;15:747–771. doi: 10.1006/nimg.2001.1034. [DOI] [PubMed] [Google Scholar]
- Swayne OB, Rothwell JC, Ward NS, Greenwood RJ. Stages of motor output reorganization after hemispheric stroke suggested by longitudinal studies of cortical physiology. Cereb Cortex. 2008;18:1909–1922. doi: 10.1093/cercor/bhm218. [DOI] [PMC free article] [PubMed] [Google Scholar]
- Turton A, Pomeroy V. When should upper limb function be trained after stroke? Evidence for and against early intervention. Neurorehabilitation. 2002;17:215–224. [PubMed] [Google Scholar]
- Van der Lee JH, De Groot V, Beckerman H, Wagenaar RC, Lankhorst GJ, Bouter LM. The intra- and interrater reliability of the action research arm test: a practical test of upper extremity function in patients with stroke. Arch Phys Med Rehabil. 2001;82:14–19. doi: 10.1053/apmr.2001.18668. [DOI] [PubMed] [Google Scholar]
- van der Lee JH, Wagenaar RC, Lankhorst GJ, Vogelaar TW, Deville WL, Bouter LM. Forced use of the upper extremity in chronic stroke patients: results from a single-blind randomized clinical trial. Stroke. 1999;30:2369–2375. doi: 10.1161/01.str.30.11.2369. [DOI] [PubMed] [Google Scholar]
- van Kuijk AA, Pasman JW, Geurts AC, Hendricks HT. How salient is the silent period? The role of the silent period in the prognosis of upper extremity motor recovery after severe stroke. J Clin Neurophysiol. 2005;22:10–24. doi: 10.1097/01.wnp.0000150975.83249.71. [DOI] [PubMed] [Google Scholar]
- van Kuijk AA, Pasman JW, Hendricks HT, Zwarts MJ, Geurts AC. Predicting hand motor recovery in severe stroke: the role of motor evoked potentials in relation to early clinical assessment. Neurorehabil Neural Repair. 2009;23:45–51. doi: 10.1177/1545968308317578. [DOI] [PubMed] [Google Scholar]
- Verheyden G, Nieuwboer A, De Wit L, Thijs V, Dobbelaere J, Devos H, Severijns D, Vanbeveren S, De Weerdt W. Time course of trunk, arm, leg, and functional recovery after ischemic stroke. Neurorehabil Neural Repair. 2008;22:173–179. doi: 10.1177/1545968307305456. [DOI] [PubMed] [Google Scholar]
- Ward NS, Brown MM, Thompson AJ, Frackowiak RS. Neural correlates of outcome after stroke: a cross-sectional fMRI study. Brain. 2003a;126(Pt 6):1430–1448. doi: 10.1093/brain/awg145. [DOI] [PMC free article] [PubMed] [Google Scholar]
- Ward NS, Brown MM, Thompson AJ, Frackowiak RS. Neural correlates of motor recovery after stroke: a longitudinal fMRI study. Brain. 2003b;126:2476–2496. doi: 10.1093/brain/awg245. [DOI] [PMC free article] [PubMed] [Google Scholar]
- Ward NS, Brown MM, Thompson AJ, Frackowiak RS. The influence of time after stroke on brain activations during a motor task. Ann Neurol. 2004;55:829–834. doi: 10.1002/ana.20099. [DOI] [PMC free article] [PubMed] [Google Scholar]
- Williams JA, Imamura M, Fregni F. Updates on the use of non-invasive brain stimulation in physical and rehabilitation medicine. J Rehabil Med. 2009;41:305–311. doi: 10.2340/16501977-0356. [DOI] [PubMed] [Google Scholar]
- Wittenberg GF, Bastian AJ, Dromerick AW, Thach WT, Powers WJ. Mirror movements complicate interpretation of cerebral activation changes during recovery from subcortical infarction. Neurorehabil Neural Repair. 2000;14:213–221. doi: 10.1177/154596830001400307. [DOI] [PubMed] [Google Scholar]
- Wolfe CD. The impact of stroke. Br Med Bull. 2000;56:275–286. doi: 10.1258/0007142001903120. [DOI] [PubMed] [Google Scholar]
- Woodbury ML, Velozo CA, Richards LG, Duncan PW, Studenski S, Lai SM. Longitudinal stability of the Fugl-Meyer Assessment of the upper extremity. Arch Phys Med Rehabil. 2008;89:1563–1569. doi: 10.1016/j.apmr.2007.12.041. [DOI] [PubMed] [Google Scholar]
Associated Data
This section collects any data citations, data availability statements, or supplementary materials included in this article.