Abstract
Acinetobacter calcoaceticus NCIM 2890 (A. caloaceticus) was found to decolorize 20 different textile dyes of various classes. Decolorization of an azo dye amaranth was observed effectively (91%) at static anoxic condition, whereas agitated culture grew well but showed less decolorization (68%) within 48 h of incubation. Induction of intracellular and extracellular lignin peroxidase, intracellular laccase, dichlorophenol indophenol (DCIP) reductase and riboflavin reductase represented their involvement in the biodegradation of amaranth. The products obtained after degradation of Amaranth were characterized as naphthalene sulfamide, hydroxyl naphthalene diazonium and naphthalene diazonium. The germination and growth of Sorghum vulgare and Phaseolus mungo seeds, and the growth of E. coli and Bacillus substilis were not inhibited by the metabolic products of the dye.
Keywords: Acinetobacter, Biodegradation, Amaranth, Lignin peroxidase, Phytotoxicity
Introduction
Disposal of the textile dyes from the industries into the environment causes serious damage, since they may significantly affect the photosynthetic activity of hydrophytes by reducing light penetration [1] and also they may be toxic to some aquatic organisms due to their toxic products [2]. Textile dyes are recalcitrant to degrade by the conventional wastewater treatment systems [3]. Both the physical and chemical methods have many disadvantages in application, such as high-energy costs, high-sludge production and formation of the secondary toxic by-products [4]. Conversely, bio-processing can overcome these defects because of cost saving and environmentally benign. It is well known that the bacteria can degrade and even completely mineralize many reactive dyes under certain conditions [5]. Bacterial degradation of dyes is often initiated under anaerobic conditions by an enzymatic biotransformation [6].
The aim of this work was to find out the potential of A. calcoaceticus for the decolorization various textile dyes of different classes. Amaranth was used as model azo dye to test the degradation efficiency and mechanism by A. calcoaceticus. This investigation is aimed at characterization and identification of amaranth degradation, and enzymes involved in the degradation, and the effects of the degradation products on microbial and plant growth.
Materials and Methods
Dyes and Chemicals
Phenol red, tartaric acid, n-propanol and catechol were obtained from Sisco Research Laboratories Pvt. Ltd., Mumbai, India. Malachite green was obtained from S.d. Fine-Chem. Ltd., Mumbai, India. ABTS [2, 2′Azino-bis 3-ethylbenzothiazoline 6-sulfonic acid] was obtained from Sigma-Aldrich, USA. Crystal violet was obtained from Qualigens Fine Chemicals, Mumbai, India. Methylene blue, methyl orange and n-butanol were from Merck Limited, Mumbai, India. Congo red, acid fuchsine, amido black-10B, methyl red, amaranth, peptone and beef extract were from Hi-media Laboratories Pvt. Ltd., Mumbai, India. Other textile dyes were generous gift from Manpasant textile processors, Ichalkaranji, Maharashtra, India.
Microorganism and Culture Conditions
Acinetobacter calcoaceticus NCIM 2890 and Aspergillus ochraceus NCIM 1146 were obtained from National Chemical Laboratory, Pune, India. E. coli MTCC 452, B. subtilis MTCC 6910 and Penicillium ochrochloron MTCC 517 were obtained from Microbial Type Culture Collection and Gene Bank (MTCC), Institute of Microbial Technology, Chandigarh, India. It was regularly maintained and preserved at 4°C on nutrient agar slants contained in (g/l); bacteriological peptone 10.0, beef extract 10.0 and NaCl 5.0.
Screening of Various Dyes
A. calcoaceticus was subjected for the decolorization of 20 different textile dyes from various classes. The concentration used for the study is mentioned in mg/l presented in bracket. Reactive dyes: golden yellow 4BD (100), red H7B (100), green HE 4B (50) and navy blue-HER (100); Azo dyes: methyl red (100) amido black10 B (50), amaranth (50) and congo red (20); Disperse dyes: dark red 2B (100) and brown 3REL (100); Triphenylmethane dyes: acid fuchsine (100) phenol red (50), malachite green (50) and crystal violet (20); Direct dyes: blue 6 (50), brown MR (50) and red 5B (100); Thiazin: toulidine blue (50); pthalocyanin: turquoise blue (20); and heterocyclic: methylene blue (50).
The culture of A. calcoaceticus was grown for 24 h and an individual dyes was added separately in 250 ml Erlenmeyer flasks containing 100 ml nutrient broth. The % decolorization at respective wavelength (at λmax of dye) and time required for complete decolorization was recorded. Decolorization efficiencies were calculated from absorbance measurements as % decolorization [7].
Growth and Decolorization in Batch Culture
Commercially used an azo dye amaranth was selected as a model dye for detailed studies on the basis of decolorization performance. A. calcoaceticus was grown for 24 h at 30°C in 250 ml Erlenmeyer flasks containing 100 ml nutrient broth to study amaranth decolorization performance at static and shaking conditions (120 rpm) with dye concentration 100 mg/l. Aseptically sample (1 ml) was withdrawn from the flask at different time intervals for absorbance measurement.
A. calcoaceticus grown for 24 h and amaranth was added in the concentration range from 50, 100, 150, 200 and 250 mg/l in order to examine the effect of initial dye concentration on the decolorization performance at static anoxic condition,
The decolorization performance was studied by the repeated addition of the dye (100 mg/l) into a batch culture (100 ml) after complete decolorization of the dye.
Enzyme Assay
A. calcoaceticus cells were collected at different time intervals during decolorization and centrifuged at 7,000 rpm for 10 min. Cells (75 mg/ml) were suspended in potassium phosphate buffer (50 mM, pH 7.4). Sonication (sonics-vibracell) was applied at 35 A, each of 30 s, for seven times by 2 min interval. The temperature was maintained at 4°C. Cell free extract was used as a source of enzyme. Lignin peroxidase activity was determined by monitoring the formation of propanaldehyde at 300 nm [7]. Laccase activity was assayed by measuring oxidation of ABTS (10%) at 420 nm [8]. Tyrosinase activity was determined by measuring liberated catechol quinone at 495 nm [9]. All enzyme assays were run in triplicate and average rates calculated. One unit of enzyme activity was defined as a change in absorbance unit/min/mg of protein.
NADH dichlorophenol indophenol (NADH–DCIP reductase) activity was monitored at 620 nm. The DCIP reduction was calculated using the extinction coefficient of 19 mM cm−1 [10]. The malachite green reductase activity was determined by monitoring reduction of malachite green at 620 nm [11]. Malachite green reduction was calculated using the extinction coefficient of 8.4 × 10⁻³ mM cm−1. Riboflavin reductase reaction rates were calculated by using a molar extinction coefficient of 6.3 mol l−1 cm−1 [12].
Phytotoxicity
Phytotoxicity tests were carried out on two kinds of seeds Sorghum vulgare (monocot) and Phaseolus mungo (dicot) commonly practiced in the Indian agriculture at room temperature (10 seeds of each) by watering (5 ml sample) per day untreated amaranth and its degradation product at (1,000 ppm) separately. Control set was carried out using water, at the same time % germination and length of plumule (shoot) and radicle (root) was recorded on 7th days.
Microbial Toxicity
Microbial toxicity of control dye amaranth and metabolites obtained after its decolorization (final concentration 1,000 ppm) was carried out in relation to E. coli, Bacillus substilis, Aspergillus ochraceus and Penicillium ochrochloron MTCC 517 and zone of inhibition (diameter in mm) was recorded [7].
Extraction and Analysis of Amaranth Degradation Products
After complete decolorization, culture broth was centrifuged at 7,000 rpm for 15 min and equal volume of n-butanol was used to extract metabolites from supernatant. The extracts were evaporated after removal of aqueous content with anhydrous Na2SO4 in a rotary evaporator, dried at 40°C and used for further analysis. Decolorization was qualitatively analyzed using UV–Visible spectrophotometer (Hitachi U–2800). TLC was performed using silica gel coated on aluminum sheet and spotting extracted metabolites and dye (control). The solvent system used was methanol:n-propanol:ethyl acetate:acetic acid:distilled water (2:3:2:0.5:2 v/v). HPLC analysis was carried out at room temperature by using Water Model 2487 equipped with dual λ UV–Vis detector and C18 column (symmetry, 4.6 × 250 mm). Sample (10 μl) was injected and dye products were allowed to separate for 10 min at the flow rate 1 ml/min. For the study of amaranth, methanol:water 50:50 mobile phase was used, where UV–Vis detector was set at 365 nm.
The biodegraded amaranth was characterized by FTIR using Perkin Elmer, Spectrum one and compared with control dye, in the mid IR region of 400–4,000 cm−1 with 16 scan speed. The samples were mixed with spectroscopically pure KBr in the ratio of 10:90. The pellets were fixed in sample holder, and the analyses were carried out. GC–MS was performed with a QP2010 mass spectrometer (Shimadzu) at ionization voltage 70 eV. GC–MS was conducted in the temperature programming mode with a Restek column (0.25 mm to 60 mm; XTI–5). The initial column temperature was 80°C for 2 min, then increased linearly at 10°C/min, to 280°C and held for 7 min. The temperature of the injection port was 280°C and the GC–MS interface was maintained at 290°C. The helium carrier gas flow rate was 1.0 ml/min. Degradation products were identified by mass spectra and their fragmentation pattern.
Statistical Data Analysis
Data were analyzed by one-way analysis of variance (ANOVA) using Tukey–Kramer multiple comparison test.
Results and Discussion
Comparison of Decolorization Capabilities of A. calcoaceticus for Textile Dyes from Various Classes
Since waste of textile industries is full of the mixture of various dyes, so the ability of the A. calcoaceticus was studied to decolorize 20 different textile dyes from various classes (Table 1). The rapid decolorization was observed within 24 h includes azo dyes (methyl red and amaranth), disperse dye (brown 3REL) and triphenylmethane dye (acid fuchsine) by 95, 91, 94, and 96% respectively, whereas other dyes from same classes with same concentration showed different range in the decolorization performance (Table 1). The chemical structure of the dye could be the reason for extending the time for the decolorization. The degradability of acid red G was better than RBR X-3B, possibly due to its lower molecular mass and also attributed due to the structural differences [13]. These results suggest the efficiency of A. calcoaceticus has a potential to degrade textile dyes containing different chromophore groups.
Table 1.
Decolorization of various dyes from different classes by A. calcoaceticus
| Name of the dye | Time (h) | Decolorization (%) |
|---|---|---|
| Reactive azo dyes | ||
| Golden yellow 4BD | 48 | 85 ± 3 |
| Red HE 7B | 48 | 79 ± 4 |
| Green HE 4B | 72 | 85 ± 6 |
| Navy blue-HER | 48 | 74 ± 2 |
| Azo dyes | ||
| Methyl red | 24 | 95 ± 4 |
| Amido black-10B | 72 | 87 ± 3 |
| Amaranth | 48 | 93 ± 6 |
| Congo red | 72 | 17 ± 3 |
| Disperse dyes | ||
| Dark red-2B | 48 | 87 ± 2 |
| Brown-3REL | 24 | 94 ± 6 |
| Triphenylmethane dyes | ||
| Acid fuchsine | 24 | 96 ± 7 |
| Phenol red | 72 | 36 ± 4 |
| Malachite green | 72 | 67 ± 5 |
| Crystal violet | 72 | 12 ± 7 |
| Direct dyes | ||
| Blue 6 | 48 | 85 ± 3 |
| Brown MR | 48 | 92 ± 6 |
| Red 5B | 48 | 94 ± 6 |
| Thiazin | ||
| Toulidine blue | 72 | 67 ± 3 |
| Pthalocyanin dye | ||
| Turquoise blue | 72 | 12 ± 2 |
| Heterocyclic dye | ||
| Methylene blue | 72 | 74 ± 5 |
Bacterial Growth and Decolorization at Static Anoxic and Shaking Culture
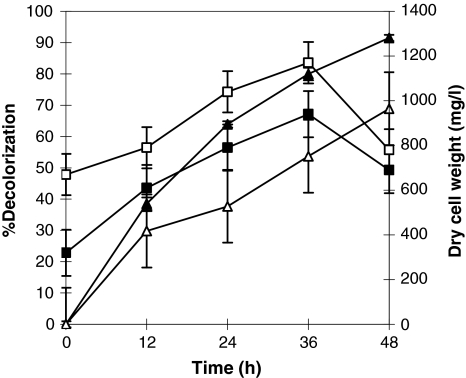
The A. calcoaceticus exhibited amaranth decolorization up to 91% under static anoxic condition, whereas under shaking condition, the culture grew well but showed 68% decolorization of amaranth dye in 48 h (Fig. 1). Proteus mirabilis reported 20% decolorization of azo dyes in shake culture but more than 95% of the dye removal was estimated in anoxic static culture, even when associated with low level of cell growth than shaking condition [14]. Bacterial degradation of azo dyes is often an enzymatic reaction linked to anaerobic condition, because it is inhibited by oxygen that is in competition with the azo group as the electron receptor in the oxidation of the reduced electron carrier, i.e. NADH [15].
Fig. 1.
Time course of decolorization of amaranth at static (filled triangle) and shaking (open triangle) condition with change in dry cell weight in mg/l at static (filled square) and shaking (open square) condition
Effect of Initial Dye Concentrations on the Decolorization of Amaranth
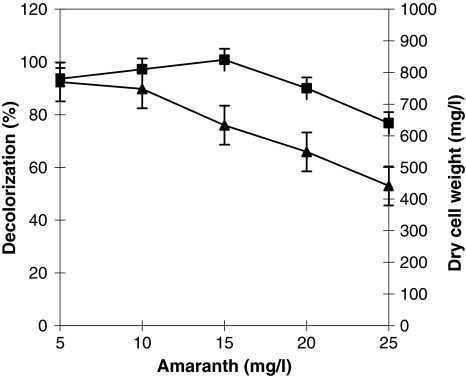
Decolorization ability of A. calcoaceticus was studied for amaranth at different initial dye concentration varying from 50–250 mg/l. 50 mg/l dye was decolorized by 92% in 48 h (Fig. 2). At 100 mg/l dye concentration, 71% of the initial dye was removed at the end of 72 h, further increase in the dye concentration (150, 200 and 250 mg/l) showed decolorization about 56, 46 and 32% respectively, at 120 h incubation (Fig. 2). The results of the dye concentration conclude harmful effects with increased dye concentration, might due to toxic effect to biomass production and blockage of active sites of enzymes involved in the dye degradation.
Fig. 2.
Effect of initial amaranth concentration on the decolorization and degradation using A. calcoaceticus. % Decolorization (filled triangle) and dry cell weight in mg/l (filled square)
Decolorization efficiency of the consortium decreased with an increasing concentration of respective dyes [16]. Easy decolorization of dyes concentration at 10 mM was reported by Kurthia sp, but color removal was reduced at increased concentration of dye (30 mM) [17]. Toxicity of dye at increasing concentration has been recorded earlier for decolorization of reactive violet 5 by the bacterial consortium RVM 11.1 [18].
Effect of Repeated Addition of the Dye Aliquots
Repeated addition of amaranth (100 mg/l) was studied for the utilization of same biomass for more times. First two cycles showed 90% reduction in color in 48 h, however, third cycle took 72 h for 50% removal of the color (data not shown). Similar observations have been recorded previously for the decolorization of reactive dye [18]. The longevity of A. calcoaceticus proves repeated batch decolorization, which is significant for its commercial application, indicated good persistence and stability of this strain in repetitive operations.
Enzyme Activities during Amaranth Decolorization
In order to gain additional information about the decolorization and degradation mechanism, screening of ligninolytic and reductase was performed. NADH–DCIP reductase activity was induced at 36 h by 227% as compare to activity at the time of dye addition (24 h growth) during decolorization of amaranth (Table 2). The induction of an extracellular and intracellular lignin peroxidase activities were 2.44 (at 48 h) and 1.49 (at 36 h) fold higher, respectively. Induction of riboflavin reductase indicated its role in the degradation of azo dye amaranth. Activity of laccase was induced at 36 h by 191% as compared to 0 h. These results indicates that major role in initial breakdown of amaranth was played by lignin peroxidase, and riboflavin reductase. Purified forms of lignin peroxidase from white rot fungi have been found to oxidize recalcitrant azo dyes [19]. Similarly, our earlier report also showed the decolorization of 10 different dyes by purified lignin peroxidase from A. calcoaceticus [20]. Kocuria rosea also showed the presence of the enzymes responsible for the dye degradation viz. laccase, tyrosinase, lignin peroxidase and reductase such as NADH–DCIP and MG in cell free extract [7]. Decolorization of direct blue 6 by Pseudomonas desmolyticum NCIM 2112 was due to an induction in the lignin peroxidase activity, which was recorded up to 96 h incubation [9].
Table 2.
Enzyme activities at different time intervals during decolorization process of amaranth
| Enzyme assay | 0 h (Control) | 24 h | 36 h | 48 h |
|---|---|---|---|---|
| Lignin peroxidasea (Intracellular) | 0.245 ± 0.034 | 0.289 ± 0.004** | 0.367 ± 0.040** | 0.274 ± 0.025 |
| Lignin peroxidasea (Extracellular) | 0.034 ± 0.010 | 0.045 ± 0.002* | 0.067 ± 0.003*** | 0.083 ± 0.040*** |
| Laccaseb (Intracellular) | 0.012 ± 0.01 | 0.016 ± 0.001** | 0.023 ± 0.004*** | 0.019 ± 0.02** |
| NADH–DCIP reductasec | 14.30 ± 0.59 | 15.46 ± 0.61 | 32.49 ± 0.63*** | 18.19 ± 0.63* |
| MG reductased | 18.00 ± 0.81 | 17.62 ± 0.74 | 16.81 ± 0.72 | 14.02 ± 0.31 |
| Riboflavin reductasee | 0.89 ± 0.07 | 2.33 ± 0.05** | 5.23 ± 0.11*** | 6.14 ± 0.11*** |
aμmoles of formaldehyde produced/mg of protein/min
bUnits of enzyme/mg of protein/min
cμg of DCIP reduced/mg of protein/min
dμg of MG reduced/mg of protein/min
eμg of riboflavin reduced/mg of protein/min
Significantly different than the control at * P < 0.05, ** P < 0.01, *** P < 0.001 by Tukey–Kramer Multiple Comparison Test. Data was analyzed by one-way ANOVA, values are mean of three experiments, SEM (±)
Phytotoxicity
The shoot and root lengths were drastically affected by 60 and 69% respectively with respect to S. vulgare, where as 75 and 55% in case of P. mungo as compared to control due to amaranth (1,000 ppm). The shoot and root lengths were higher as compared to untreated amaranth by 91 and 194% respectively in S. vulgare, while in P. mungo were by 283 and 58% respectively due to degradation product (1,000 ppm) (Table 3) indicates less toxicity of the degradation product.
Table 3.
Phytotoxicity of amaranth and its metabolites formed after biodegradation at 1,000 ppm concentration
| Sorghum vulgare | Phaseolus mungo | |||||
|---|---|---|---|---|---|---|
| Water | Amaranth | Metabolite | Water | Amaranth | Metabolite | |
| Germination (%) | 100 ± 7 | 80 ± 5 | 100 ± 9 | 100 ± 6 | 100 ± 7 | 100 ± 10 |
| Plumule (cm) | 16.90 ± 0.54 | 6.60 ± 0.56 | 12.65 ± 0.54 | 12.00 ± 0.60 | 3.00 ± 0.25* | 11.50 ± 0.65 |
| Radical (cm) | 8.65 ± 0.54 | 2.60 ± 0.54* | 7.65 ± 0.65** | 5.90 ± 0.42 | 2.65 ± 0.12** | 4.20 ± 0.57* |
One way analysis of variance (ANOVA) with Tukey–Kramer comparison test. Values are mean of three experiments, SEM (±)
Significantly different from control at * P < 0.05, ** P < 0.01
Microbial Toxicity
Microbial toxicity of control dye amaranth and metabolites obtained after its decolorization (final concentration 1,000 ppm) was carried out in relation to E. coli, Bacillus substilis, Aspergillus ochraceus and Penicillium ochrochloron MTCC 517. Amaranth and its degradation products were not toxic to Aspergillus ochraceus and Penicillium ochrochloron MTCC 517 at 1,000 ppm concentration. Amaranth inhibited growth of E. coli and Bacillus substilis, and the degradation products, however, were not inhibitory (Table 4).
Table 4.
Microbial toxicity of amaranth and metabolites obtained after its decolorization
| Microorganism | Diameter of zone of inhibition (mm) | |
|---|---|---|
| Amaranth (1,000 ppm) | Metabolites (1,000 ppm) | |
| E. coli | 15.0 | NI |
| Bacillus substilis | 14.0 | NI |
| Aspergillus ochraceus | NI | NI |
| Penicillium ochrochloron MTCC 517 | NI | NI |
NI No Inhibition. The diameter of the discs used was 10 mm
Analysis of Dye Degradation Products
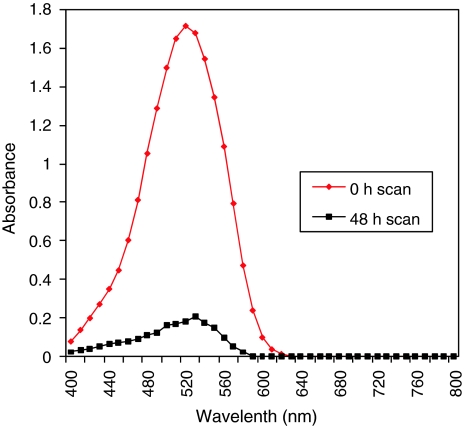
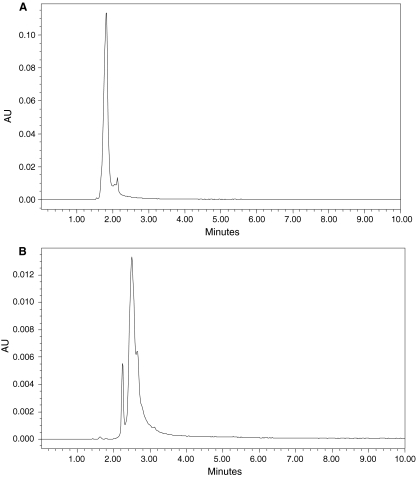
Decolorization studies of amaranth with UV–Vis spectroscopy confirms color removal for amaranth while, there was no new peak appearance (Fig. 3). Degradation product of amaranth showed the disappearance of spot corresponding to parent dye (Rf 0.83) and concomitant appearance of three other spots with Rf values 0.93, 0.82 and 0.79 (data not shown). HPLC chromatogram of amaranth showed peak at R.T. 1.812 min (Fig. 4a) and solvent extract of decolorized media by the A. calcoaceticus showed appearance of new peaks at R.T. 2.283 and 2.586 min (Fig. 4b).
Fig. 3.
UV-Vis spectrum of amaranth and at 0 time and 48 h
Fig. 4.
HPLC profile of amaranth (a) and degradation products of amaranth at 48 h by A. calcoaceticus (b)
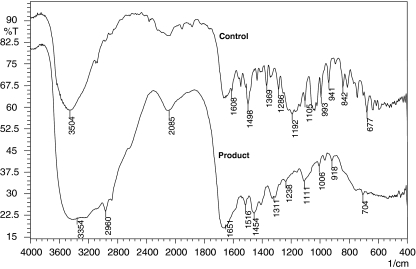
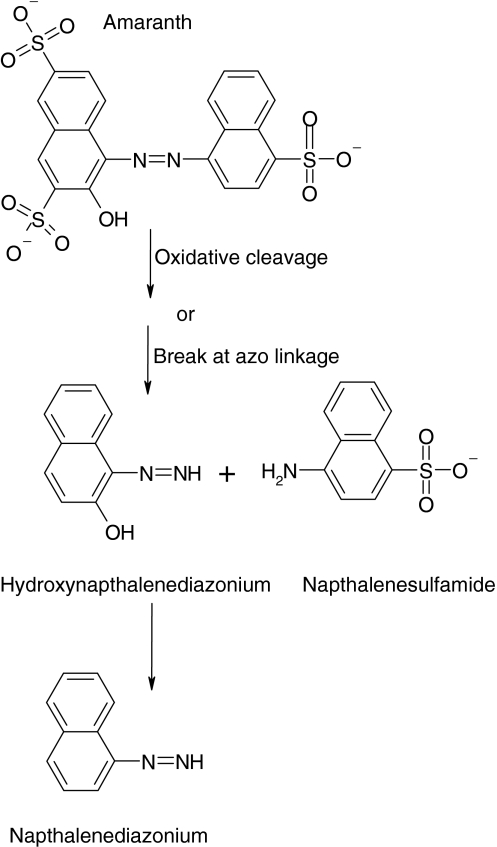
FTIR spectrum of control amaranth showed number of peaks in the fingerprint region (1,500–500 cm−1) for mono-substituted and para-di-substituted naphthalene rings which are supported by a peak at 677 and 1,369 cm−1 for –S=O stretching of naphthalene rings, along with these peaks for aromaticity, a peak at 1,105 cm−1 for the C–OH stretching vibrations for secondary alcohol group and a peak at 882 cm−1 for C–H stretching (Fig. 5). FTIR spectrum of degradation products extracted after 48 h showed peak at 3,334 cm−1 for N–H stretch, peak at 1,311 cm−1 –S=O which indicate formation of primary and secondary amines which was confirmed with GC–MS shown in Fig. 6. The –C–H stretching at 2,960 cm−1, peak at 1,651 cm−1 represented –N=N– stretching of an azo group present in the degradation products, also confirmed with GC–MS analysis as identified product naphthalene diazonium. The metabolites of the amaranth degradation were identified and confirmed with FTIR and GCMS analysis as naphthalene sulfamide, hydroxyl naphthalene diazonium and naphthalene diazonium which are as presented in Table 5. The asymmetric cleavage by lignin peroxidase resulted in sulfonated reactive intermediate, which take part in several reactions to produce stable product such as naphthalene diazonium (Fig. 6). Diazonium form of stable mediate concludes action of oxidative enzyme present in A. calcoaceticus; it could not breaks an azo linkage, in contrast, reported earlier as initial step in the bacterial azo dye metabolism under anaerobic conditions involves the reductive cleavage of an azo linkage [21]. Bacterial degradation of azo dyes in aerobic/anaerobic conditions could be either at intracellular or extracellular level [22]. These enzymes gratuitously reduce azo dyes due to their nonspecific nature [22].
Fig. 5.
a FTIR spectrum of amaranth and b its degradation products at 48 h by A. calcoaceticus
Fig. 6.
Proposed pathway for degradation of amaranth by A. calcoaceticus
Table 5.
GC–MS spectral data of biodegradation products of amaranth
| Sr. | Rt. (min) | Mw (m/z) | (%) Area | Identified products |
|---|---|---|---|---|
| 1 | 24.617 | 246 | 1.47 | Naphthalene sulfamide |
| 2 | 19.583 | 169 (M + 1) | 13.43 | Hydoxynaphthalene diazonium |
| 3 | 20.858 | 155 (M + 1) | 4.08 | Naphthalene diazonium |
Acknowledgments
Gajanan Ghodake wishes to thank and express gratitude to Shivaji University, Kolhapur for teaching assistantship.
References
- 1.Aksu Z. Reactive dye bioaccumulation by Saccharomyces cerevisiae. Process Biochem. 2003;38:1437–1444. doi: 10.1016/S0032-9592(03)00034-7. [DOI] [Google Scholar]
- 2.Hao OJ, Kim H, Chiang PC. Decolorization of wastewater. Crit Rev Environ Sci Technol. 2000;30:449–505. doi: 10.1080/10643380091184237. [DOI] [Google Scholar]
- 3.Naik NM, Jagadeesh KS, Alagawadi AR. Microbial decolorization of spentwash: a review. Indian J Microbiol. 2008;48:41–48. doi: 10.1007/s12088-008-0005-6. [DOI] [PMC free article] [PubMed] [Google Scholar]
- 4.Sarioglu M, Bali U, Bisgin T. The removal of C.I. basic red 46 in a mixed methanogenic anaerobic culture. Dyes Pigment. 2007;74:223–229. doi: 10.1016/j.dyepig.2006.02.001. [DOI] [Google Scholar]
- 5.Kapdan IK, Erten B. Anaerobic treatment of saline wastewater by Halanaerobium lacusrosei. Process Biochem. 2007;42:449–453. doi: 10.1016/j.procbio.2006.09.001. [DOI] [Google Scholar]
- 6.Carvalho MC, Pereira C, Goncalves IC, Pinheiro HM, Santos AR, Lopes A, Ferra MI. Assessment of the biodegradability of a monosulfonated azo dye and aromatic amines. Int Biodeter Biodegrad. 2008;62:96–103. doi: 10.1016/j.ibiod.2007.12.008. [DOI] [Google Scholar]
- 7.Parshetti GK, Kalme SD, Saratale GD, Govindwar SP. Biodegradation of malachite green by Kocuria rosea MTCC 1532. Acta Chim Slov. 2006;53:492–498. [Google Scholar]
- 8.Hatvani N, Mecs I. Production of laccase and manganese peroxidase by Lentinus edodes on malt containing by product of the brewing process. Process Biochem. 2001;37:491–496. doi: 10.1016/S0032-9592(01)00236-9. [DOI] [Google Scholar]
- 9.Kalme SD, Parshetti GK, Jadhav SU, Govindwar SP. Biodegradation of benzidine based dye direct blue-6 by Pseudomonas desmolyticum NCIM 2112. Bioresour Technol. 2007;98:1405–1410. doi: 10.1016/j.biortech.2006.05.023. [DOI] [PubMed] [Google Scholar]
- 10.Salokhe MD, Govindwar SP. Effect of carbon source on the biotransformation enzymes in Serratia marcescens. W J Microbiol Biotechnol. 1999;15:229–232. doi: 10.1023/A:1008875404889. [DOI] [Google Scholar]
- 11.Jadhav JP, Govindwar SP. Biotransformation of malachite green by Saccharomyces cerevisiae MTCC 463. Yeast. 2006;23:315–323. doi: 10.1002/yea.1356. [DOI] [PubMed] [Google Scholar]
- 12.Fontecave M, Eliasson R, Reichard P. NAD (P) H: flavin oxidoreductase of E. coli: a ferric iron reductase participating in the generation of the free radical of ribonucleotide reductase. J Biol Chem. 1987;262:12325–12331. [PubMed] [Google Scholar]
- 13.Paszczynski A, Pasti M, Goszczynski S, Crawford R, Crawford D. Mineralization of sulfonated azo dyes and sulfanilic acid by Phanerochaete chrysosporium and Streptomyces chromofuscus. Appl Environ Microbiol. 1992;58:3598–3604. doi: 10.1128/aem.58.11.3598-3604.1992. [DOI] [PMC free article] [PubMed] [Google Scholar]
- 14.Chen KC, Huang WT, Wu JY, Houng JY. Microbial decolorization of azo dyes by Proteus mirabilis. J Ind Microbiol Biotechnol. 1998;23:686–690. doi: 10.1038/sj.jim.2900689. [DOI] [PubMed] [Google Scholar]
- 15.Banat I, Nigam P, Singh D, Marchant R. Microbial decolorization of textile dye containing effluents. Bioresour Technol. 1996;58:217–227. doi: 10.1016/S0960-8524(96)00113-7. [DOI] [Google Scholar]
- 16.Manjinder S, Harvinder S, Sharmaa DK, Chadhaa BS, Chimni SS. Decolorization of various azo dyes by bacterial consortium. Dyes Pigment. 2005;67:55–61. doi: 10.1016/j.dyepig.2004.10.008. [DOI] [Google Scholar]
- 17.Sani RK, Banerjee UC. Decolorization of triphenylmethane dyes and textile and dye-stuff effluent by Kurthia sp. Enzym Microb Technol. 1999;24:433–437. doi: 10.1016/S0141-0229(98)00159-8. [DOI] [Google Scholar]
- 18.Moosvi S, Keharia H, Madamwar D. Decolorization of textile dye reactive violet 5 by newly isolated bacterial consortium RVM-11.1. World J Microbiol Biotechnol. 2005;21:667–672. doi: 10.1007/s11274-004-3612-3. [DOI] [Google Scholar]
- 19.Collins PJ, Field JA, Teunissen P, Dobson ADW. Stabilization of lignin peroxidases in white rot fungi by tryptophan. Appl Environ Microbiol. 1997;63:2543–2548. doi: 10.1128/aem.63.7.2543-2548.1997. [DOI] [PMC free article] [PubMed] [Google Scholar]
- 20.Ghodake GS, Kalme SD, Jadhav JP, Govindwar SP. Purification and partial characterization of lignin peroxidase from Acinetobacter calcoaceticus NCIM 2890 and its application in decolorization of textile dyes. Appl Biochem Biotechnol. 2008;152:6–14. doi: 10.1007/s12010-008-8258-4. [DOI] [PubMed] [Google Scholar]
- 21.Mcmullan G, Meehan C, Conneely A, Kirby N, Robinson T, Nigam P, Banat IM, Merchant R, Smyth WF. Microbial decolorization and degradation of textile dyes. Appl Microbiol Biotechnol. 2001;56:81–87. doi: 10.1007/s002530000587. [DOI] [PubMed] [Google Scholar]
- 22.Pandey A, Singh P, Iyengar L. Bacterial decolorization and degradation of azo dyes. Int Biodeter Biodegrad. 2007;59:73–84. doi: 10.1016/j.ibiod.2006.08.006. [DOI] [Google Scholar]


