

Abstract
The four purposes of this investigation were to assess whether children acquire intelligible speech following prolonged cochlear-implant experience and examine their speech error patterns, to examine how age at implantation influences speech acquisition, to assess how speech production and speech perception skills relate, and to determine whether cochlear implant recipients who formerly used simultaneous communication (speech and manually coded English) begin to use speech without sign to communicate. Twenty-eight prelinguistically deafened children who use a Nucleus cochlear implant were assigned to one of three age groups, according to age at implantation: 2–5 yrs (N = 12), 5–8 yrs (N = 9), and 8–15 yrs (N = 7). All subjects had worn a cochlear implant for at least 24 mos, and an average of 36 mos. All subjects used simultaneous communication at the time of implantation. Subjects performed both imitative and structured spontaneous sampling speech tasks. The results permit the following conclusions: (a) children who have used a cochlear implant for at least 2 yrs acquire some intelligible speech; (b) children who receive a cochlear implant before the age of 5 yrs appear to show greater benefit in their speech production skills than children who are older, at least after a minimum of 2 yrs of use; (c) children who recognize more speech while wearing their cochlear implants are likely to speak more intelligibly; and, (d) signing does not disappear from a child's communication mode following implantation.
Keywords: cochlear implants, speech production, deaf children, aural rehabilitation, total communication
Some researchers and organizations have criticized cochlear implantation of prelinguistically deafened children (Lane, 1990; National Association for the Deaf, 1991). On the one hand, children who receive cochlear implants may not receive enough information to achieve a performance level that allows them to communicate and receive messages verbally, and to interact easily with members of the hearing community. On the other hand, because speech and listening skills receive so much attention, children may not acquire the necessary sign skills to associate with members of the Deaf community. Thus, young cochlear implant users may become culturally bereft, belonging to neither hearing nor Deaf groups (Evans, 1987).
A central role of research at this time is to document how children's speaking, listening, speechreading, language, and signing performance changes as a result of implantation. This documentation can either support or allay concerns about the efficacy of cochlear implantation, and can provide important information for counseling families and potential cochlear implant candidates and for developing habilitation programs. The present investigation had four purposes: (a) to determine the level of intelligibility that prelinguistically deafened children acquire following prolonged cochlear-implant experience and to examine their speech error patterns; (b) to examine how age at implantation influences speech acquisition; (c) to investigate how speech production skills relate to speech recognition skills; and (d) to determine whether use of sign disappears.
Speech Intelligibility After Implantation
A number of investigators have demonstrated significant improvements in speech production following cochlear implantation (e.g., Osberger et al., 1991; Tobey et al., 1991; Tobey & Hasenstab, 1991; Tye-Murray & Kirk, 1993). However, overall intelligibility remains low, at least for the first 2 yrs. For instance, Osberger, Maso, and Sam (1993) reported that the mean intelligibility score derived from a set of 10 imitated sentences was only 18% words correct for a group of 12 prelinguistically deafened children who use the Cochlear Corporation Nucleus multichannel cochlear implant.
In the present investigation, we evaluated the intelligibility of children who had worn their cochlear implants for a relatively long period of time. We performed fine-grained analyses to examine word intelligibility, phonemic errors (in both spontaneous and elicited speech tasks), and speech skills such as syllable stress production after children had acquired an average of 36 mos experience. This kind of examination not only indicates whether intelligibility changes, but also provides guidance for ordering speech treatment objectives. For example, phonemic contrasts that are shown to be produced relatively accurately might be targeted earlier in a speech treatment curriculum for new cochlear implant users; phonemic contrasts that are produced poorly might be targeted later.
Age at Implantation
Recent studies with prelinguistically deafened children suggest that children who receive a cochlear implant at a younger age might develop better speech skills than children who receive one at an older age. Osberger et al. (1993) reported that prelinguistically deafened children who receive a Nucleus cochlear implant before the age of 10 yrs achieve somewhat better speech production skills than children who receive a device later. In this investigation we examined this issue with a larger group of subjects, and three different age groups. We compared experienced users' speech performance with measures obtained pre-implant or measures obtained from children who do not use cochlear implants. We also examined the rate of progress demonstrated by younger versus older cochlear implant recipients. Such analyses and resultant data might aid family members of a particular cochlear implant candidate to develop realistic expectations about the benefits of implantation.
Relationship Between Speech Perception and Production
Children who have more residual hearing, as indexed by puretone thresholds, usually achieve greater success in speaking than children who have less residual hearing (Boothroyd, 1969; Gold, 1978; Markides, 1970; Smith, 1975). Measures of speech recognition indicate how much of the speech signal children use in a meaningful fashion. Current research suggests that hearing-aid users with good speech recognition skills do not necessarily develop good speech production skills. However, children who speak relatively well are almost always good perceivers (Osberger et al., 1993; Stark & Levitt, 1974). In this investigation we related cochlear implant users' abilities to recognize speech to their abilities to perform a number of different speaking tasks. If a strong relationship exists, then we might assume that children who receive good audiological benefit from their devices begin to rely on auditory information for speech acquisition.
Use of Sign Language
Preliminary evidence does not suggest that cochlear implantation necessarily leads to a decrease in the use of sign if a child used sign beforehand (Firszt, Reeder, Zimmerman-Phillips, Tonokawa, & Proctor, 1991; Tye-Murray & Kirk, 1993). The final purpose of this investigation was to examine whether children who relied on simultaneous communication (i.e., speech and manually coded English) prior to receiving a cochlear implant continue to integrate sign into their communication mode following implantation, even after speech skills begin to improve. Both videotaped speech samples and questionnaire data from parents were collected to address this issue.
Method
Subjects
Twenty-eight children who had prelinguistic deafness (i.e., profound hearing losses incurred no later than 18 mos of age) and who use a Nucleus cochlear implant participated in this investigation. The Nucleus cochlear implant codes information about fundamental frequency, intensity, vowel formants, and aperiodic segments of the speech signals. It presents signal information to a 22-electrode array inserted into the child's cochlea.
Subjects' age at cochlear implant connection1 ranged from 31 to 170 mos, and averaged 85 mos (SD = 47 mos). For purposes of data analysis, subjects were assigned to one of three groups according to age at implantation. The first age group (the 2–4 yrs group) included 12 subjects who were implanted between the ages of 31 and 58 mos, and an average age of 48 mos (SD = 8 mos). The second age group (the 5–8 yrs group) included 9 subjects implanted between the ages of 60 and 89 mos, and an average age of 69 mos (SD = 8 mos). The third age group (the 9–15 yrs group) included 7 children implanted between the ages of 113 and 184 mos, and an average age of 138 mos (SD = 35 mos). Subjects had to have attained at least 24 mos of experience with a cochlear implant to participate. On average, subjects had 36 mos of experience (SD = 13.5 mos). (Some subjects were also tested pre-implantation or on early dates following implantation, as indicated in the Results section.) Subjects in the 9–15 yrs group had somewhat less experience on average than subjects in the 2–4 yrs and 5–8 yrs group, 29 versus 37 and 40 mos respectively. Data from an additional 5 subjects who did not have cochlear implant experience were used in one set of analyses, where post-implant performance was compared to pre-implant performance. The biographical characteristics of these children were similar to the subjects who received cochlear implants.
All subjects lived at home and attended a public school at the time of testing. Parents reported that subjects used a simultaneous communication approach at home and at school. All but two of the subjects used Signed English (Bornstein, Saulnier, & Hamilton, 1983) or Signed Exact English (Gustason, Pfetzing, & Zawolkow, 1980), either alone or in combination with American Sign Language (ASL). All but 3 subjects were mainstreamed in a classroom for normally hearing children for part of the day. One subject attended the lowa State School for the Deaf.
In many ways, this group of subjects is representative of the population of children who have profound hearing losses in the United States. Most children who are deaf attend public schools, most live at home, and most use some form of signing (Kluwin, 1992; Moores, 1992).
Evaluation Measures of Speech Production
The test battery included the following tests: The Short-Long Sentence Test, The Story-Retell Task, the Central Institute for the Deaf (CID) Speech Intelligibility Evaluation (SPINE, Monson, Moog, & Geers, 1988),2 Audio-Visual Feature Test (Production Version) (Tyler, Fryauf-Bertschy, & Kelsay, 1991), Fundamental Speech Skills Test (FSST, Levitt, Youdelman, & Head, 1990),3 and a Parent Questionnaire (Tye-Murray & Kelsay, 1993). Because the Short-Long Sentence Test, the story-retell task, the Audio-Visual Feature Test, and the parent questionnaire were developed specifically for this investigation, they are described in greater detail below. Subjects were tested individually in a quiet room and productions were recorded via videotape with audio track. Subjects sat at a short table directly across from the examiner, who was a speech-language pathologist proficient in manually coded English. A Panasonic VHS Professional/Industrial videocamera model AG-180 was placed across from the subject and was focused so as to record all hand and facial movements.
Short-Long Sentence Test
This test consisted of 14 sentence pairs, each pair containing a short and long item. The short version sentences contained between one and three words, and were ritual or simple phrases (e.g., How are you?; Please stop.). These sentences could be produced by very young children and permitted direct comparisons between younger and older children speaking the same sentences. The long version sentences were expansions of the short versions (e.g., How are you going to get there?; Please stop making so much noise.). These items were more challenging to produce and matched the linguistic sophistication of older children. In this investigation, only the short versions were analyzed.
The speech-language pathologist presented each item with both speech and sign, and the child imitated her speech. The speech-language pathologist then transcribed the productions. The transcription was scored using a target transcription to compare with the actual production. The target transcription allowed for minor dialectal differences.4 A word was considered correct if all phonemes in the word matched the target production. The phonetic transcriptions yielded a percent phonemes correct and a percent words correct score.
The Story-Retell Task
This task was administered in order to obtain a spontaneous speech sample for articulation and intelligibility analysis. The speech-language pathologist described each of four pictures in a set, following a prepared script and using simultaneous communication. The child then retold the story using speech (and sign, if desired). This procedure was repeated until the child had retold all of six stories. If the child had difficulty in formulating a narrative, the speech-language pathologist was allowed to use a limited set of general prompts (e.g., Tell me more about this picture).
The story-retell speech samples were scored in three ways. First, the initial 100 spoken words were phonetically transcribed and the corresponding sign was orthographically transcribed. Only the initial 100 words were included in the analysis so as to control for unequal sample sizes. The accuracy of the spoken utterances was determined by referencing the phonetic transcriptions to the signed transcriptions, to yield a phoneme percent correct and word percent correct score (Tye-Murray & Kirk, 1993).
A second measure obtained from the story-retell samples was a subjective rating score. A group of 10 listeners with normal hearing who were unfamiliar with the speech of deaf talkers heard the audio portions of the speech sample recordings. The listeners rated the overall intelligibility of two stories using a 10-point ascending scale, where 1 indicated that “the speech is completely unintelligible” and 10 indicated that “the speech is completely intelligible.”5
A third measure derived from the story-retell speech samples was an identification score. This score reflected how well narrative information was conveyed verbally to unfamiliar persons. Ten new listeners (i.e., listeners who did not perform the rating task) with normal hearing and no experience listening to the speech of deaf talkers listened to the auditory signal of two stories told by each subject. As they listened, they viewed the four-picture sets that corresponded to each of the six stories. These picture sets were projected on a screen before the listeners with a slide projector. After each story presentation, the listeners indicated on a printed score sheet which of the six picture series corresponded to the story that they had just heard. Listeners must have understood more than a few words in order to have identified a sequence correctly, as the stories had similar actors (e.g., five of the six stories featured a boy) and actions occurring (e.g., four stories featured dressing or putting on clothes). An identification score for a particular child was computed by adding the number of stories correctly identified by the 10 listeners across the two stories, and then dividing by 20.
Audio-Visual Feature Test (Production Version)
(Tyler, Fryauf-Bertschy, & Kelsay, 1991). This test was comprised of items that most 4- and 5-yr-old hard-of-hearing children can recognize: seven alphabet letters (e.g., B, T) and three common words (e.g., me), all with a consonant-/i/ structure. Before testing began, subjects were shown a picture of each stimulus item and asked to name it. If a child could not name an item after two attempts, the test was not administered.
During testing, subjects produced each stimulus three times in random order. Pictures of the items were used to elicit the productions. For analysis, a subject's responses were played to four listeners who had normal hearing and who were familiar with the speech of hard-of-hearing talkers. After each production was played, each of the four listeners circled the syllable that he or she heard from among the closed set. A percent correct score was computed by averaging the scores frommthe four listeners. The responses of the listeners were also compiled into confusion matrices so that the relative error rates for the initial consonants could be examined.
Parent Questionnaire
(Tye-Murray & Kelsay, 1993). The Parent Questionnaire consisted of questions about a child's communicative skills. Each subject's parent, usually the mother, indicated agreement with each item using a 10-point scale, where 1 = Never, and 10 = Frequently. Seven items were selected from the questionnaire for analysis in this investigation, three that pertained to speech intelligibility and four that pertained to use of sign (Tye-Murray & Kelsay, 1993, p. 28).
Audiological Test Battery
The audiological test battery consisted of the 6-Choice Word Intelligibility by Picture Identification (WIPI, Ross & Lerman, 1971), the Audio-Visual Feature Test (Perception Version) (Tyler, Fryauf-Bertschy, & Kelsay, 1991), and the Children's Vowel Test (Tyler, Opie, Fryauf-Bertschy, & Gantz, 1992). The Audio-Visual Feature Test (Perception Version) (described above) was presented in an audition-only and an audition-plus-vision condition. The Children's Vowel Test, which consisted of five sets of four picture items (e.g., hit, hot, hat, hurt), and the WIPI were presented in an audition-only condition. Testing was performed live voice in a quiet room. The audiologist who administered the tests spoke at a normal conversational level.
Transcription Reliability
Phonetic and orthographic transcriptions were completed by two speech-language pathologists (SLP-1 and SLP-2) who were competent in Signed English and familiar with the speech of hard-of-hearing children. Each clinician transcribed approximately the same number of samples. To determine phonetic transcription reliability of each of the two clinicians, a total of 12 samples from the subjects were transcribed by 2 separate listeners who were also familiar with the speech of hard-of-hearing children and trained in phonetic transcription. A Lambda analysis (Hays, 1973) was performed. For this analysis, the percent of speech sound agreement was calculated by dividing the number of agreements about the occurrences of speech sounds by the total number of sounds produced. Average agreement between SLP-1 and listener/transcriber-1 was 74% (SD = 7) and average agreement between SLP-2 and listener/transcriber-2 was 73% (SD = 4). To determine reliability of the sign transcriptions, six stories from the Story-Retell task were chosen at random and transcribed orthographically by an audiologist competent in Signed English. A Lambda analysis (Hays, 1993) was performed. Average orthographic agreement was 90%.
Results
Speech Intelligibility After Implantation
In order to evaluate subjects' levels of speech intelligibility after an average of 36 mos of cochlear implant use, scores for each of the speech production tests were averaged. Scores for the entire group of subjects and also for each of the three age groups are presented in Figures 1–3.
FIGURE 1.
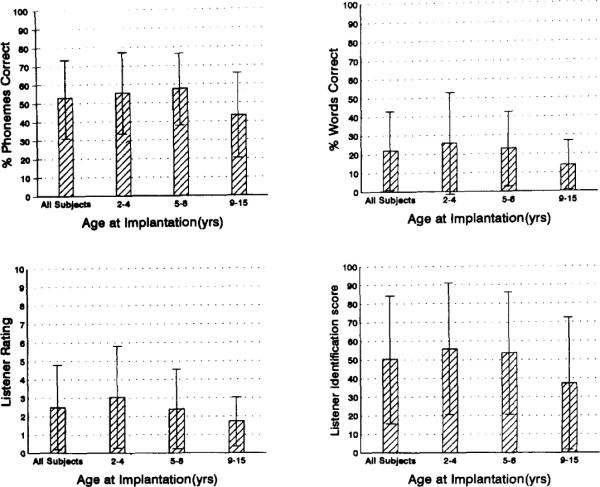
Means and standard deviations from the story-retell speech sample measures, including percent phonemes correct, percent words correct, listener ratings, and listener identification scores. Age ranges listed on x-axis represent age at implantation, not age at testing (which was at least 24 mos post-implantation).
FIGURE 3.

Means and standard deviations from the FSST for total score and suprasegmentals subtests including: number of syllables produced, stress, and intonation contours.
Results from the story-retell speech samples appear in Figure 1. On average, the entire group of subjects produced 53% of the phonemes correctly and 22% of the words correctly. Performance within age groups varied widely, as indicated by the large standard deviation bars. Scores ranged from 14 to 92% phonemes correct and from 1 to 78% words correct. Ratings of intelligibility were low, corresponding with the relatively poor word production revealed by the transcription procedure. The mean rating of the 10 raters, averaged over all subjects, was 2.5, on a scale of 1 to 10. Scores ranged from 1 to 9. Listener identification scores indicated that subjects were sometimes able to convey narrative information successfully. The 10 listeners who were assigned to the identification task identified which stories the children were describing in 51% of the samples (chance = 16%). Identification scores ranged from 5% to 100% correct.
A fine-grain analysis of the phoneme errors that occurred during the story-retell procedure was performed. Table 1 shows percent phonemes correct as a function of place of articulation. Vowels that are produced with a central place of articulation were somewhat more likely to be correct (approximately 70%) than front vowels (50%), back vowels (58%), or diphthongs (54%). Consonants that tend to be produced with visible articulatory movements were also more likely to be correct. The bilabials and labiodentals were produced more accurately (approximately 81% and 72%, respectively) than the linguadentals (47%), alveolars (47%), palatals (33%), or velars (40%). These trends were consistent across the three age groups.
Table 1.
Percent phonemes correct on average for each age group and standard deviations (in parentheses) for the story retell procedure, organized as a function of place of articulation.
| Age group (yrs) |
|||
|---|---|---|---|
| Place of articulation | 2–4 | 5–8 | 9–15 |
| Vowels | |||
| Front (/i,æ,ɝ,ɚ,ε,l/) | 56 (24) | 52 (21) | 46 (17) |
| Back (/u, U, ɔ/) | 65 (25) | 56 (36) | 54 (27) |
| Central (/ a, ʌ, ə /) | 72 (22) | 67 (22) | 69 (31) |
| Diphthongs (/O, aɪ, aU, ɔl, el/) | 64 (31) | 51 (34) | 46 (27) |
| Consonants | |||
| Bilabials (/p, b, m, w/) | 83 (17) | 87 (14) | 72 (20) |
| Labiodentals (/f, v/) | 76 (28) | 83 (19) | 57 (38) |
| Linguadentals (/ θ,ð /) | 36 (30) | 59 (26) | 46 (43) |
| Alveolars (/t, d, s, z, I, n/) | 46 (29) | 61 (31) | 34 (22) |
| Palatals (/∫,t∫, t, d, r, j/) | 33 (35) | 38 (19) | 28 (34) |
| Velars (/k, g,ŋ /) | 41 (37) | 50 (31) | 29 (30) |
The results from the syllable and sentence tests were examined next. Results from the Audio-Visual Feature Test (Production Version), the SPINE, and the short version sentences of the Short-Long Sentence Test appear in Figure 2. On average, the group of subjects scored 39% consonants correct on the Audio-Visual Feature Test (Production Version). The average score for the SPINE, which also indexes phoneme production, was 56% items correct. The percent phonemes correct score for the short version sentences of the Short-Long Sentence Test for all subjects was 54% and the percent words correct score was 25%, on average. The results from the three tests portrayed in Figure 2 suggest that the subjects produced about half of their phonemes correctly. These measurements correspond with the performance measured during the story-retell task (Figure 1).
FIGURE 2.

Means and standard deviations for the Audio-Visual Feature Test (Production Version), the SPINE, and the short version of the Short-Long Sentence Test (both percent phonemes and percent words correct).
The relative error rates for the phonemes produced by subjects during the Audio-Visual Feature Test (Production Version) were examined. The responses from all subjects were compiled into a single consonant confusion matrix, which is presented in Table 2. The stop (/p, b, t, d, k/) and the nasal consonants (/m, n/) were produced with the most accuracy (45% and 38% correct, respectively) and the fricative consonants were produced with the least accuracy (22% correct). With the exception of /s/ and /v/, the most common errors produced for a particular target phoneme usually shared all but one feature with the target. These results suggest that children were achieving a close approximation of the intended targets. Voicing errors were especially common for the stop consonants. For instance, 70% of the errors produced for /p/ were /b/ substitutions; 48% of the errors produced for /b/ were /p/ substitutions; 26% of the errors produced for /t/ were /d/ substitutions; and 33% of the errors produced for /d/ were /t/ substitutions. Manner of articulation errors were common for the nasal consonants: the nasal /m/ was most commonly substituted by the non-nasal stop /b/ (56% of the errors) and the nasal /n/ was most commonly substituted by the non-nasal stop /d/ (28% of the errors). The phoneme /s/ was most often substituted by /d/ (26% of the errors), which differs from /s/ in both manner of articulation (a stop versus a fricative) and voicing (voiced versus unvoiced). The phoneme /v/ was most often substituted by /b/ (27% of the errors). The phonemes /p, b/ were most often produced correctly (66% and 47%, respectively) and /z/ was most often produced incorrectly (14%).
Table 2.
Consonant confusion matrice for the entire group of subjects, for the production version of the Children's Consonant Feature Test (Stimulus N = 276 for each phoneme).
| Response |
|||||||||||
|---|---|---|---|---|---|---|---|---|---|---|---|
| Stimulus | /p/ | /t/ | /k / | /s/ | /b/ | /d/ | /v/ | /z/ | /n/ | /m/ | % Correct |
| /p/ | 130 | 3 | 4 | 4 | 102 | 8 | 8 | 3 | 5 | 9 | 47% |
| /t/ | 11 | 122 | 21 | 35 | 11 | 40 | 6 | 13 | 10 | 7 | 44% |
| /k/ | 11 | 48 | 92 | 20 | 12 | 25 | 7 | 13 | 27 | 21 | 33% |
| /s/ | 11 | 38 | 24 | 66 | 15 | 55 | 8 | 0 | 6 | 16 | 24% |
| /b/ | 46 | 4 | 4 | 1 | 181 | 10 | 8 | 0 | 6 | 16 | 66% |
| /d/ | 10 | 58 | 19 | 48 | 9 | 102 | 2 | 20 | 3 | 5 | 37% |
| /v/ | 45 | 23 | 6 | 14 | 54 | 26 | 78 | 10 | 7 | 13 | 28% |
| /z/ | 6 | 50 | 11 | 70 | 10 | 54 | 13 | 40 | 12 | 10 | 14% |
| /n/ | 6 | 16 | 20 | 0 | 29 | 52 | 9 | 6 | 93 | 45 | 34% |
| /m/ | 14 | 2 | 2 | 1 | 89 | 9 | 16 | 1 | 26 | 116 | 42% |
| Total | 290 | 364 | 203 | 259 | 512 | 381 | 155 | 139 | 202 | 255 | |
As shown in Figure 3, the final measure, the FSST, provided information about speech skills such as stress production and intonation contours. The total score averaged 435, and ranged from 221 to 594. Total scores are computed by adding together the percentages for the six subtests, so 600 is the highest score possible. The average total score was compared to the norms provided in the test. The total score for the present subjects fell between the 90 and 100 percentile for the test-normed age ranges of 6–9 yrs, 10 and 11 yrs and 12–14 yrs for subjects with hearing thresholds of 115+ dB. Individual subtest scores for Suprasegmentals for the entire group were 89% for correct number of syllables produced, 61% for correct production of stress, and 44% for correct production of intonation contours. All scores fall above the 70th percentile based on test norms for children with hearing thresholds of 115+ db.
Results from the parent questionnaire indicated that parents believed they recognized much of their child's speech, ranking their performance above that of family and strangers. On the following statements, parents provided the following ratings, on average: “I understand my child's speech,” average rating = 7.4 (SD = 2.0); “Strangers understand my child's speech,” average rating = 4.4 (SD = 2.0); and “Other members of the family understand my child's speech,” average rating = 6.5 (SD = 2.0).
Age at Implantation
In order to examine the effects of age at implantation on speech production, four composite variables were created: word, phoneme, speech skills, and functional speech. The word composite variable reflects how accurately subjects spoke word stimuli, and was computed by averaging together the percent-words-correct scores from the story-retell speech samples and the short version sentences of the Short/Long Sentence Test. The phoneme variable reflects phoneme production, and was computed by averaging the percent-phoneme-correct scores from the story-retell speech samples, the short version sentences of the Short/Long Sentence Test, the Audio-Visual Feature Test (Production Version), and the percent correct score for the SPINE. The speech skills composite score was the total score for the FSST, which encompasses scores from all of its subtests (see Footnote 3). A functional speech composite variable was computed by averaging the three measures from the story-retell speech samples: percent words correct, percent stories identified, and the average rating score, multiplied by 10 (so it would encompass a 100-point range, like the other two story-retell measures).
The phoneme and word production composite scores are plotted in Figures 4 and 5 as a function of age at test administration. Those subjects who were tested on more than one occasion are denoted by symbols that are connected by lines. As noted in the Methods Section, some subjects were tested before implantation or shortly thereafter. Also included in Figures 4 and 5 are data points for the 5 subjects who did not receive cochlear implants. They are denoted by filled symbols without connecting lines.
FIGURE 4.

Pre-implant and post-implant phoneme composite test scores plotted as a function of age at test administration. Filled shapes represent pre-implant test scores and unfilled shapes represent post-implant test interval scores. Lines connect scores from subjects who had data available pre-implant and post-implant, or data available from two post-implant test intervals.
FIGURE 5.

Pre-implant and post-implant word composite test scores plotted as a function of age at test administration. Filled shapes represent pre-implant test scores and unfilled shapes represent post-implant test interval scores. Lines connect scores from subjects who had data available pre-implant and post-implant, or data available from two post-implant test intervals.
Pearson correlations were performed between the composite scores and subjects' age at time of testing. The analysis revealed that older subjects tended to achieve higher scores than younger subjects prior to receiving a cochlear implant (word composite variable: r = .786, p < .001; phoneme composite variable: r = .787; functional speech variable: r = .561, p < .01; speech skills composite scores: r = .436, p > .01). However, after at least 2 yrs of experience with a cochlear implant, older children no longer performed better than the younger group. Age and post-implant performance measures were not significantly correlated (word composite scores: r = −.211, p > .01; phoneme composite scores: r = −.020, p > .01; speech skills composite variable: r = −.033, p > .01; functional speech composite scores: r = −.228, p > .01). One interpretation of these results is that younger children who use cochlear implants progress at a faster rate than older children.
In a second statistical analysis, we considered whether children who receive a cochlear implant perform better than children of the same age who do not receive a cochlear implant. Following Kirk and Hill-Brown (1985), we compared the post-implant composite scores of the younger group (ages 2–4 yrs) to the pre-implant scores of the middle age group (ages 5–8 yrs). After at least 2 yrs of cochlear implant experience, subjects in the younger group are about the same age on average as subjects in the middle age group were prior to receiving a cochlear implant. We also compared the post-implant composite scores of the middle age group to the pre-implant scores of the older group (ages 9–15 yrs).
T-tests revealed significant differences between the post-implant young age group scores and the pre-implant middle age group's scores for the word composite variable (t = −3.99, p < .001), the phoneme composite variable (t = −6.12, p < .0001), and the functional speech composite variable (t = −2.49, p < .03).6 These results suggest that children who receive a cochlear implant at a young age surpass their age-matched peers who do not use a cochlear implant on measures of speech production, after at least 2 yrs of use. Similar analyses comparing the post-implant scores of the middle age group with the pre-implant scores of the older age group did not yield significant findings for any of the four composite variables (p > .05). That is, children in the middle age group who received a cochlear implant did not perform better than similarly aged children who were tested before receiving their cochlear implants.
Relationship Between Speech Perception and Speech Production Performance
Most of the children recognized some speech when wearing their cochlear implants. Scores for the Audio-Visual Feature Test (Perception Version) in an audition-only condition averaged 28% consonants correct (SD = 18%, chance = 10%), and in an audition-plus-vision condition scores averaged 60% consonants correct (SD = 24%). Scores for the Children's Vowel Test averaged 76% vowels correct (SD = 24%, chance = 25%) and scores for the WIPI averaged 51% words correct (SD = 23%, chance = 16%).
Scores from the four speech production composite variables were correlated with the four audiological test measures in order to examine the relationship between speech production and speech recognition skills. Pearson correlation coefficients are listed in Table 3. Subjects' abilities to produce speech corresponded well with their abilities to perceive it, as all relationships were significant.
Table 3.
Correlations between the speech production composite scores and the audiological test scores.
| Audiological tests |
||||
|---|---|---|---|---|
| Audio-Visual Feature Test | Children's Vowel Test | WIPI | ||
| Condition: | A | A+V | A | A |
| Speech production composite scores | ||||
| Word | .898* | .839** | .569** | .739** |
| Phoneme | .807** | .730** | .464* | .683** |
| Speech skills | .771** | .751** | .450* | .790** |
| Functional speech | .935** | .899** | .589** | .789** |
A = audition, V = Vision
p = .01
p = .001
Scores for the production version of the Audio-Visual Feature Test were correlated with scores from the perception version. This analysis provided a direct comparison of subjects' abilities to produce and perceive the same stimulus items. Performance on the production version was significantly correlated with recognition performance when the test was presented in an audition-only condition (r = .550, p < .01) and also an audition-plus-vision condition (r = .525, p < .01). These results are presented in Figure 6.
FIGURE 6.

Scores for the Audio-Visual Feature Test (Production Version) plotted as a function of performance on the perception version of the test, administered in an audition-only and an audition-plus-vision condition.
Use of Sign Language
To ascertain whether children who have been implanted use primarily speech and little sign, we examined both the story-retell samples and the responses to the parental questionnaire. Performance on the story-retell task revealed that subjects clearly relied on both sign and speech to communicate with a speech-language pathologist, even after at least 2 yrs experience with a cochlear implant. Subjects used both sign and speech for an average of 83 words (SD = 29 words) within their 100-word samples. Subjects used speech-only for an average of nine words (SD = 26 words) and sign without speech for an average of seven words (SD = 16 words). Parents assigned an average agreement score of 4.8 (SD = 2.7) to the questionnaire statement, “My child communicates without sign, using speech only.” Thus, the questionnaire results indicate a lower incidence of signing than in the story-retell procedure.
Discussion
This investigation included subjects who use simultaneous communication and who receive a public education in their home communities. On these two counts, these subjects are representative of the majority of children who have profound hearing loss in the United States. They may not be representative of children who attend private schools, or children who receive an aural/oral education. The subjects had prelinguistic profound hearing loss and wore a Nucleus cochlear implant for a minimum of 24 mos, and an average of 36 mos.
Speech Production After Implantation
Phoneme production accuracy for the present subjects exceeded reported performance levels of children with profound hearing loss who use hearing aids. The present subjects scored 53% phonemes (vowels and consonants combined) correct on the story-retell task and 54% phonemes correct on the Short-Long Sentence Test. Markides (1970) reports scores from a picture-naming task of 44% vowels correct and 28% consonants correct for a group of profoundly hard-of-hearing hearing-aid users.
Overall intelligibility levels for the present subjects, however, were low, as indicated by the story-retell samples. Listeners assigned subjects low intelligibility ratings (2.5 on average, from a 10-point ascending scale). and only 22% of the words in the samples, on average, were produced without any phonemic errors. On the other hand, naive listeners were able to identify half of the stories from a closed set of six choices.
The relative error rates for the phonemes produced for the Audio-Visual Feature Test (Production Version) suggest that subjects often approximate a target phoneme when they speak an error. Typically, the most common error made for a particular phoneme differed from the target by only one feature (i.e., voicing, manner of articulation, place of articulation). In some ways, their errors resemble those produced by children who have severe or profound hearing loss and use hearing aids. For instance, Smith (1975) reported that her subjects frequently produced errors of voicing, which were also common in this investigation. Her subjects produced consonants that are visible on the mouth (/b, m, p/) relatively accurately and the fricative /z/ with many errors, as did the present subjects during both the story-retell task and the Audio-Visual Feature Test (Production Version).
Most subjects performed well on the FSST, scoring above average for the normative data presented by the test developers. This good performance may indicate that the cochlear implant is especially beneficial for the development of suprasegmental aspects of speech, such as syllable stress and intonation. In addition or alternatively, changes in suprasegmental aspects of speech may be precursors to changes in segmental aspects. Ling's (1976) hierarchical stages of speech acquisition suggest that children who are hard-of-hearing may master syllable stress and intonation production before acquiring the skills to speak many speech sounds.
Age at Implantation
Children who are deaf and who receive a Nucleus cochlear implant before the age of 5 yrs may show greater benefit in terms of speech production measures than children who receive a cochlear implant after the age of 5 yrs. This tentative conclusion is based on two findings. First, younger subjects appeared to demonstrate a faster rate of improvement in their speaking skills than older subjects after receiving a cochlear implant, as indicated in Figures 4 and 5. The slopes of the lines connecting subjects' pre-implant and post-implant phoneme and word composite scores in these figures were steeper for younger children than for older children, indicating that they were demonstrating an accelerated rate of improvement over time. The younger children may eventually surpass the older children with continued cochlear implant experience. It is possible, however, that their improvement rate may begin to plateau with maturation and begin to resemble the improvement rate of older children.
The second indication that younger children may show greater benefit than older children comes from the analyses comparing the pre-implant measures of an older age group with the post-implant measures of a younger age group. The post-implant composite scores achieved by children in the 2–4 yrs age group were significantly better than the pre-implant scores achieved by children in the 5–8 yrs age group. A similar analysis comparing the post-implant scores of the 5–8 yrs age group to the pre-implant scores of the 9–15 yrs age group revealed no significant differences. Thus, younger children who used cochlear implants tended to perform better than similarly aged children who used hearing aids. This was not true for older children.
Two caveats must be appended to this conclusion regarding age at implantation. First, it is quite possible that older children will also continue to improve their intelligibility with continued cochlear-implant experience. Progress may occur at a slower rate, or require longer lengths of experience. Secondly, even in the middle and older age groups, performance generally increased after subjects received a cochlear implant. This finding suggests that some older children may improve in their speaking behaviors. Future research must determine the proportion of older children who are likely to benefit from implantation, and identify those characteristics that predict gains.
Relationship Between Speech Perception and Production
Subjects' speech production skills were significantly correlated with their speech recognition skills. Children with better speech production skills were more likely to have better speech recognition skills. Certainly the degree of speech recognition afforded by the cochlear implant appears to be an important factor in the variability that was noted in subjects' speech production performance.
These results underscore the importance of auditory information during speech acquisition. Tye-Murray (1992) suggests that auditory information plays at least five roles. First, auditory information potentiates the development of specific principles of articulatory organization. For instance, by listening to the speech of others in their community, children learn how to regulate their speech breathing, they learn how to flex and extend their tongue bodies, and they learn how to alternate rhythmically between open and closed postures of articulation. Secondly, by listening to others, children learn how to produce specific speech events. For instance, they learn to distinguish /p/ with a relatively rapid velocity opening gesture and /w/ with slow velocity. Thirdly, children develop a system of phonological performance (i.e., they learn the phonemes of their language community). Through listening, they also learn linguistic rules; for example, they learn which phonemes may occur in series (e.g., /tn/ does not occur in syllable-initial position). Fourthly, auditory feedback informs children about the consequences of their articulatory gestures, and how these consequences compare to sounds produced by other talkers. Finally, auditory feedback may provide information for monitoring ongoing speech production and for detecting errors.
The present results hint that a degraded signal (i.e., that provided via a cochlear implant) can perform some of the roles of an intact auditory system. For example, the significant correlations between scores for the production and perception versions of the children's Audio-Visual Feature Test suggest that new listening skills are leading subjects to expand their systems of phonological performance. Their good performance on the FSST, compared to that of children who use hearing aids, suggests that access to auditory information is leading them to learn organizational principles, such as appropriate speech breathing behaviors.
Use of Sign Language
Results from the story-retell procedure suggest that children who used manual communication or simultaneous communication prior to receiving a cochlear implant do not discontinue signing after receiving a cochlear implant. Use of simultaneous communication increases. The results from the parent questionnaire indicate a somewhat lower incidence of signing. Scores from the questionnaire probably reflect the child's performance in the home setting, where listeners are familiar with the child's speech and perhaps not very fluent in sign language. We have noted clinically that some children have sign skills that surpass those of their parents. It is possible that they might attempt to communicate with only speech more often when interacting with their parents than when interacting with a clinician who knows sign.
Summary
The present study suggests that cochlear implantation leads to enhanced speech development, particularly if children are able to recognize some speech auditorally with their devices. Receipt of a cochlear implant may be more beneficial for younger children than older children, although additional data are needed to understand the effects of age more completely. Overall, children's intelligibility remains low after an average of 3 yrs of device use, although some children speak remarkably well. Cochlear implantation and subsequent improvements in speech skills appear not to eliminate children's use of sign to communicate.
Acknowledgments
This work was supported by National Institutes of Health Grants DC00242 and DC00976-01, Grant RR59 from the General Clinical Research Centers Program, Division of Research Resources NIH, and a grant from the Lions Clubs of Iowa. The audiological data reported in this investigation were collected in an experimental protocol supervised by Richard S. Tyler. We thank Karen Iler Kirk for her assistance in the early stages of this project. We also thank Elizabeth Gilbert, Stephanie McCarthy, Barb Mullin, Shelley Witt, and Melissa Figland for their help with data analysis.
Footnotes
“Cochlear implant connection” refers to the time that a child actually begins to wear the device. Connection typically occurs 4 to 6 wks following cochlear implant surgery.
The SPINE requires a subject to name four sets of picture cards that are similar in phonemic context (e.g., bat/bag; bell/ball). The examiner records via pen and answer sheet which word she thought was said, to yield a percent words correct. The SPINE does not provide normative data with which to compare the present results.
The FSST is comprised of a battery of subtests. It is designed to assess speech production skills that include breath stream capacity, elementary articulation, pitch control, syllabification, stress, and intonation contour.
Dialectical differences were allowed so that children were not penalized for using a regional dialect.
Although rating scales do not provide specific information about articulation errors (Samar & Metz, 1988), they provide information about listeners' subjective impressions of intelligibility (Tye-Murray, Barkmeier, & Folkins, 1991).
Because only two children in the younger group completed the FSST, we did not analyze the speech skills composite scores.
References
- Bornstein H, Saulnier K, Hamilton L, editors. The comprehensive signed English dictionary. Gallaudet University Press; Washington, DC: 1983. [Google Scholar]
- Boothroyd A. Distribution of hearing levels in the student population of Clarke School for the Deaf. Clarke School for the Deaf; Northampton, MA: 1969. SARP Report #3. [Google Scholar]
- Firszt JB, Reeder RM, Zimmerman-Phillips S, Tonokawa L, Proctor LA. Rehabilitative plans and resulting performance of children using cochlear implants. Paper presented at the Academy of Rehabilitative Audiology Summer Institutes XXV; Breckenridge, CO. 1991. [Google Scholar]
- Fryauf-Bertschy H, Tyler RS, Kelsay D, Gantz BJ. Performance over time of congenitally deaf and postlingually deafened children using a multichannel cochlear implant. Journal of Speech and Hearing Research. 1992;35:913–920. doi: 10.1044/jshr.3504.913. [DOI] [PubMed] [Google Scholar]
- Gantz BJ, Woodworth GG, Knutson JF, Abbas PJ, Tyler RS. Multivariate predictors of success with cochlear implants. Annals of Otology, Rhinology, and Laryngology. 1993;102:909–916. doi: 10.1177/000348949310201201. [DOI] [PubMed] [Google Scholar]
- Gold T. Unpublished doctoral dissertation. City University of New York Graduate Center; NY: 1978. Speech and hearing: A comparison between hard of hearing and deaf children. [Google Scholar]
- Gustason G, Pfetzing D, Zawolkow E. Signing Exact English. Modern Sign Press; Los Alamitos, CA: 1980. [Google Scholar]
- Hays WL. A measure of predictive association. In: Hays WL, editor. Statistics for the social sciences. 2nd ed. Holt, Rinehart and Winston, Inc.; New York: 1973. pp. 745–749. [Google Scholar]
- Kirk KI, Hill-Brown C. Speech and language results in children with a cochlear implant. Ear and Hearing. 1985;6:365–475. doi: 10.1097/00003446-198505001-00008. [DOI] [PubMed] [Google Scholar]
- Kluwin TN. What does “Local public school” program mean? In: Kluwin TN, Moores DF, Gawstad MG, editors. Toward effective public school programs for deaf students: Context, process, and outcomes. Teachers College Press; New York: 1992. pp. 7–29. [Google Scholar]
- Lane H. Cultural and infirmity models of deaf Americans. Journal of the Academy of Rehabilitative Audiology. 1990;23:11–26. [Google Scholar]
- Levitt H, Youdelman K, Head J. Fundamental speech skills test. Research Point, Inc.; Englewood, CO: 1990. [Google Scholar]
- Ling D. Speech and the hearing impaired child: Theory and practice. Alexander Graham Bell Association for the Deaf; Washington, DC: 1976. [Google Scholar]
- Markides A. The speech of deaf and partially hearing children with special references to factors affecting intelligibility. British Journal of Disorders of Communication. 1970;5:126–140. doi: 10.3109/13682827009011511. [DOI] [PubMed] [Google Scholar]
- Monsen R, Moog JS, Geers AE. CID Picture SPINE. Central Institute for the Deaf; St. Louis: 1988. [Google Scholar]
- Moores DF. An historical perspective on school placement. In: Kluwin TN, Moores DF, Gaustad MG, editors. Toward effective public school programs for deaf students: Context, process and outcomes. Teachers College Press; New York, NY: 1992. pp. 7–29. [Google Scholar]
- National Association of the Deaf . The NAD Broadcaster, 13. author; Silver Spring, MD: 1991. Cochlear implants in children. [Google Scholar]
- Osberger MJ, Maso M, Sam LK. Speech intelligibility of children with cochlear implants, tactile aids, or hearing aids. Journal of Speech and Hearing Research. 1993;36:186–203. doi: 10.1044/jshr.3601.186. [DOI] [PubMed] [Google Scholar]
- Osberger MJ, Robbins A, Berry S, Todd S, Hesketh L, Sedy A. Analysis of the spontaneous speech samples of children with cochlear implants or Tactile Aids. American Journal of Otology. 1991;12(Suppl.):151–164. [PubMed] [Google Scholar]
- Smith C. Residual hearing and speech production in deaf children. Journal of Speech and Hearing Research. 1975;18:795–811. doi: 10.1044/jshr.1804.795. [DOI] [PubMed] [Google Scholar]
- Stark R, Levitt H. Prosodic feature reception and production in deaf children. Journal of the Acoustical Society of America. 1974;55(Suppl.):S23. [Google Scholar]
- Tobey EA, Angelette S, Murchinson C, Nicosia J, Sprague S, Staller S, Brimacombe J, Beiter AL. Speech production performance in children with multichannel cochlear implants. American Joumal of Otology. 1991;12(Suppl.):165–173. [PubMed] [Google Scholar]
- Tobey EA, Hasenstab MS. Effects of a Nucleus multichannel cochlear implant upon speech production in children. Ear and Hearing. 1991;12(Suppl.):48S–54S. doi: 10.1097/00003446-199108001-00007. [DOI] [PubMed] [Google Scholar]
- Tye-Murray N. Articulatory organizational strategies and the roles of audition. Volta Review. 1992;94:243–260. [Google Scholar]
- Tye-Murray N, Kelsay D. A communication training program for parents of cochlear implant users. The Volta Review. 1993;95:21–31. [Google Scholar]
- Tye-Murray N, Kirk K. Vowel and diphthong production by young users of cochlear implants. Journal of Speech and Hearing Research. 1993;36:488–502. doi: 10.1044/jshr.3603.488. [DOI] [PubMed] [Google Scholar]
- Tyler RS, Fryauf-Bertschy H, Kelsay D. Audiovisual feature test for young children. The University of Iowa Hospitals, Department of Otolaryngology—Head and Neck Surgery; Iowa City: 1991. [Google Scholar]
- Tyler RS, Opie JM, Fryauf-Bertschy H, Gantz BJ. Future directions in cochlear implants. Journal of Speech-Language Pathology. 1992;16(2):151–164. [Google Scholar]