

Abstract
Sjögren's syndrome (SS) is a chronic, progressive autoimmune disease primarily affecting women. Diagnosis of SS requires an invasive salivary gland tissue biopsy and a long delay from the start of the symptoms to final diagnosis has been frequently observed. In this study, we aim to identify salivary autoantibody biomarkers for primary SS (pSS) using a protein microarray approach. Immune-response protoarrays were used to profile saliva autoantibodies from patients with pSS (n=14), patients with systemic lupus erythematosus (SLE, n=13), and healthy control subjects (n=13). We identified 24 potential autoantibody biomarkers that can discriminate patients with pSS from both patients with SLE and healthy individuals. Four saliva autoantibody biomarkers, anti-transglutaminase, anti-histone, anti-SSA, and anti-SSB, were further tested in independent pSS (n=34), SLE (n=34), and healthy control (n=34) subjects and all were successfully validated with ELISA. This study has demonstrated the potential of a high-throughput protein microarray approach for the discovery of autoantibody biomarkers. The identified saliva autoantibody biomarkers may lead to a clinical tool for simple, noninvasive detection of pSS at low cost.
Keywords: Autoantibody biomarker, Protein arrays, Protein microarray, Sjögren's syndrome
1 Introduction
Sjögren's syndrome (SS) is one of the most common autoimmune diseases, with an estimated prevalence of 1–4 million patients in the US. The syndrome is characterized by lymphocytic infiltration of the exocrine glands resulting in significant reduction of saliva and tear production (dry eyes and mouth) [1]. Approximately, one-third of the SS patients present with systemic manifestations contributing to the burden of the disease. The patients also have a much higher risk of developing lymphoma than the general population [2], and the most common forms are mucosa-associated lymphoid tissue (MALT) lymphomas that remain localized to the salivary glands. SS primarily affects women, with a ratio of 9:1 over the occurrence in men. The disease may occur alone as primary SS (pSS) or present as secondary SS (sSS), which is associated with other autoimmune diseases such as rheumatoid arthritis (RA) or systemic lupus erythematosus (SLE).
Diagnosing SS is complicated by the range of nonspecific symptoms a patient may manifest, and the similarity between symptoms from SS and those caused by other autoimmune disorders. As a result, diagnosis usually lags symptom onset by years in the patients with SS. Current diagnostic criteria for SS include dry mouth, dry eyes, circulating autoantibodies to Ro/SS-A and La/SS-B, and lymphocytic infiltration of salivary glands [3]. Tear and salivary tests have been applied in SS to measure the production of saliva and tears from glands. These tests, however, lack specificity because salivary and lachrymal function declines with age or may be impaired from other medical conditions. Salivary gland (minor or parotid) biopsy remains a highly specific diagnostic tool for SS, but the procedure is invasive, requires the evaluation from an expert histopathologist, and may have invertible sequelae [4]. In recent years, there has been increasing interest in developing saliva protein biomarkers for noninvasive diagnosis of pSS [5–9]. As saliva is directly secreted from salivary glands, analysis of the salivary proteomes from patients with SS, a salivary gland disorder, represents a promising approach to searching diagnostic biomarkers for the disease. Proteomic analysis of saliva could also reveal classification biomarkers to distinguish the primary and secondary variants of the syndrome [10].
The presence of autoantibodies is a hallmark of many autoimmune diseases, which has long been used for the diagnosis and classification of these diseases. Autoantibodies may exist years before the diagnosis of an autoimmune disease, and could be used for early prediction of the disease onset [11]. The most widely used biomarkers of SS are serum IgG autoantibodies against two nuclear proteins, Ro-52/SSA and La/SSB. In clinical setting, these antibodies are measured in serum for diagnostic purpose. IgG anti-La/SSB antibodies represent the major serum antibody class, whereas IgA and IgM can be detected at very low titer. IgG antibodies, rarely IgA, are also detected in saliva from patients with SS. As for anti-Ro/SSA, IgG remains to be the main class and there has not been observation of IgA or IgM classes [12, 13]. Although anti-SSA and anti-SSB are clinically useful biomarkers, they are neither specific to SS nor correlated with clinical severity of SS [14]. In addition, anti-SSA and anti-SSB antibodies are present only in 5–15% of patients with SS secondary to RA and 38.5% of patients with SS secondary to SLE [15].
In this study, we have discovered novel autoantibody biomarkers for pSS using a high-throughput proteomics approach. Saliva autoantibodies present in patients with pSS or SLE and healthy control subjects were profiled with protein microarrays. Statistical analysis of the microarray data revealed 24 autoantibody biomarkers that can differentiate pSS from both SLE and healthy controls. We have also successfully validated four saliva autoantibody biomarkers in independent patient and control populations using commercially available ELISA.
2 Materials and methods
2.1 Study design, patients, and saliva samples
The purpose of this study is to discover autoantibody biomarkers for pSS using a new protein microarray platform. The study design is shown in Fig. 1. Initially, we used 40 human ProtoArray microarrays to profile saliva autoantibodies in 14 pSS patients, 13 SLE patients (non-SS autoimmune disease control), and 13 healthy control subjects. Afterward, M-statistics was used for the analysis of microarray data to reveal the candidate' autoantibody biomarkers. Only the autoantibodies that are significantly over-presented in patients with pSS compared with both healthy and SLE controls were considered as the candidate' autoantibody biomarkers for pSS. Finally, we selected four saliva autoantibodies whose ELISA kits are commercially available for further validation.
Figure 1.

The study design for discovery and validation of saliva autoantibody biomarkers of pSS.
In total, 48 pSS, 47 SLE, and 47 healthy control subjects were recruited at the University Medical Center Groningen, the Netherlands, for this study. The pSS patients fulfilled the European–US criteria for pSS (3), whereas the SLE patient fulfilled the American College of Rheumatology criteria for SLE but did not qualify for sSS. The three study groups (pSS, SLE, and healthy control) were well matched for age, gender, and ethnicity. All the enrolled subjects were Caucasian women because pSS primarily affects women. Both University of California-Los Angeles and University Medical Center Groningen committees had approved the use of clinical samples for this project. The information pertaining to the human samples were recorded in a manner that the subjects cannot be identified, directly or through identifiers linked to the subjects. Whole saliva samples were collected using the method described previously [7] and centrifuged at 2600 × g for 15 min. The supernatant was then removed, aliquoted, and stored at −80°C.
2.2 Protein microarray profiling
All enrolled subjects for the discovery phase were female Caucasians and age-matched among the three groups (ppSS versus SLE = 0.34; ppSS versus Ctrl = 0.75). The mean ± SD age was 35.4 ± 9.7 years in the pSS patients (n=14), 39.8 ± 13.5 years in the SLE patients (n=13), and 36.6 ± 9.4 (n=13) years in the healthy control subjects.
The ProtoArray human protein microarrays (Invitrogen, ProtoArray, v4.0) were used to profile autoantibodies in a total of 40 saliva samples. The microarray slides were initially treated with the blocking buffer (Invitrogen ProtoArray Kit) at 4°C for 1h with gentle agitation. After blocking, arrays were removed and probed with a 1:10 dilution of each saliva sample diluted in freshly prepared PBST buffer (1 × PBS, 0.1% Tween-20, and 1% BSA). The incubation lasted for 2h at 4°C and the arrays were washed five times with the probe buffer with gentle agitation. Afterward, the arrays were washed again five times (5 min per wash) in PBST Buffer. An Alexa Fluor®647-conjugated goat anti-human IgG antibody diluted in 5 mL probe buffer to a 1 μg/mL final concentration was then added to each array and allowed to incubate with gentle shaking at 4°C for 90 min. After the secondary antibody was removed, the arrays were washed as described above and then scanned using an Axon GenePix 4000B fluorescent microarray scanner. Finally, the protein arrays were scanned and analyzed using the Prospector Imager and Analyzer (Invitrogen). A negative control assay was run in parallel with the samples as described below. Since the proteins are spotted twice on the array, the mean values of duplicates from the array are used for data analysis.
2.3 Array assay controls and performance
In the negative control assay, a protein microarray was treated in an identical manner to the experimental assays, except that it was incubated with buffer containing no saliva prior to incubation with the Alexa Fluor®647-anti-human IgG detection reagent. Each ProtoArray micro-array contains control proteins (Alexa Fluor®-conjugated antibody, human IgG, etc.), which are used to provide reference points for data acquisition and analysis. The Alexa Fluor®-conjugated antibody allows proper alignment of the spot-finding software for data acquisition. Each subarray contains a gradient of human IgG, which serves as a control for proper performance of the detection reagent. In addition, anti-human IgG antibody is also spotted as a gradient in every subarray. The antibody binds to IgG present in the saliva sample and serves as a positive control for proper assay performance. In this study, all the array images showed good signal-to-background levels in all samples tested. The background signals from the three group samples are summarized in Supporting Information Table 1.
2.4 Statistical analysis of microarray data
The ProtoArray Prospector software (Invitrogen) was used for statistical analysis of protein microarray data. The software performs all aspects of the analysis, including background correction, normalization, and M-statistic calculations of significance. A standard Z-score normalization was used to compare each probe signal to that of all the signals from the entire protein-feature population, as described in the previous studies [16, 17]. Statistical analysis was focused separately on each of the two-group comparisons instead of a three-way comparison/classification.
The output from the comparative analysis includes information on the number of patients in each population that exhibited an immune response against each ProtoArray protein that was above the M-statistic threshold established for that protein. These numbers correspond to the “Count” summarized in Tables 1 and 2. Additional thresholds were imposed requiring that background-subtracted, normalized signals at least 500 relative fluorescence units (RFU), and a minimum signal difference of 200 RFU must be observed between the samples from two populations in order for a particular sample to be included in the M-statistic count. The maximal population prevalence is reported for each protein based on the sample size and the M-statistic count. These numbers correspond to the “Prevalence” values listed in Tables 1 and 2.
Table 1. A list of 24 proteins showing significantly elevated interaction with the saliva autoantibodies in pSS patients compared with both SLE patients and healthy control subjects.
| Protoarray database ID |
Mean signal (pSS) |
Mean signal (SLE) |
Mean signal (Ctrl) |
Median signal (pSS) |
Median signal (SLE) |
Median signal (Ctrl) |
p-Value (pSS vs. SLE) |
p-Value (pSS vs. Ctrl) |
Protein description |
|---|---|---|---|---|---|---|---|---|---|
| BC069328.1 | 1159.0 | 477.0 | 927.0 | 1049.0 | 232.0 | 282.0 | 1.57E–02 | 1.57E–02 | Bcl2 modifying factor (BMF) |
| Cardiolipin | 13 678.1 | 4449.3 | 4743.2 | 8457.0 | 4288.5 | 4646.0 | 1.01E–02 | 2.14E–02 | Cardiolipin – known autoantigen |
| NM_022101.1 | 1345.7 | 228.3 | 505.7 | 1207.8 | 20.0 | 351.0 | 1.03E–03 | 4.77E–03 | Chromosome Xopen-reading frame 56 (CXorf56) |
| XM_375456.2 | 770.5 | 366.6 | 344.6 | 877.5 | 275.0 | 170.0 | 1.30E–02 | 1.30E–02 | Hypothetical protein DKFZp761G2113 |
| NM_018664.1 | 910.4 | 414.2 | 361.3 | 258.5 | 268.5 | 344.0 | 2.48E–02 | 2.48E–02 | Jun dimerization protein p21SNFT (SNFT) |
| La | 38 649.2 | 1137.0 | 9398.0 | 58 625.0 | 1026.0 | 621.5 | 4.27E–04 | 8.76E–03 | La/SS-B – known autoantigen |
| BC053667.1 | 2194.1 | 1229.6 | 1134.1 | 1779.0 | 1009.5 | 948.0 | 1.51E–02 | 1.51E–02 | Lectin, galactoside-binding, soluble, 3 (LGALS3) |
| NM_002307.1 | 2758.2 | 1288.9 | 1506.4 | 1899.0 | 1312.5 | 1110.5 | 1.01E–02 | 1.59E–02 | Lectin, galactoside-binding, soluble, 7 (LGALS7) |
| PV3370 | 28 635.8 | 11 573.2 | 16 783.6 | 23 728.8 | 11 057.0 | 15 405.0 | 1.35E–03 | 2.14E–02 | Megakaryocyte-associated tyrosine kinase (MATK) |
| BC032852.2 | 921.5 | 339.0 | 427.8 | 642.0 | 204.0 | 239.5 | 2.48E–02 | 2.48E–02 | Melanoma antigen, family B, 4 (MAGEB4) |
| NM_004527.2 | 2191.2 | 1366.1 | 1377.8 | 1641.8 | 1200.0 | 1343.0 | 2.48E–02 | 2.48E–02 | Mesenchyme homeo box 1 (MEOX1) |
| NM_024946.1 | 2326.8 | 3110.1 | 1106.6 | 2228.8 | 1430.0 | 1329.5 | 1.57E–02 | 1.30E–02 | NEFA-interacting nuclear protein NIP30 (NIP30) |
| AB065630.1 | 398.1 | 137.9 | 202.0 | 304.3 | 121.0 | 185.5 | 2.48E–02 | 2.48E–02 | Olfactory receptor, family 6, subfamily N, member 2 (OR6N2) |
| BC010629.1 | 3307.4 | 1750.5 | 2080.0 | 3015.5 | 1780.0 | 1889.5 | 2.79E–05 | 5.80E–03 | Outer dense fiber of sperm tails 2 (ODF2) |
| NM_015993.1 | 1641.6 | 487.8 | 856.9 | 1557.3 | 281.5 | 751.0 | 3.39E–05 | 5.30E–03 | Plasma membrane proteolipid (plasmolipin) (PLLP) |
| P2996 | 5900.6 | 3587.5 | 4452.8 | 5069.0 | 3324.0 | 3264.5 | 4.77E–03 | 1.57E–02 | Protein kinase C,6 (PRKCQ) |
| PV3831 | 7322.9 | 3455.0 | 3183.7 | 4050.3 | 3765.5 | 2670.0 | 2.48E–02 | 1.65E–02 | Ribosomal protein S6 kinase, polypeptide 2 (RPS6KB2) |
| Ro-52 | 35 279.6 | 1763.6 | 10 734.4 | 34 463.0 | 1519.5 | 1687.5 | 2.79E–05 | 4.77E–03 | Ro-52/SS-A – known autoantigen |
| BC034554.1 | 2469.5 | 891.0 | 856.8 | 1583.3 | 890.0 | 829.5 | 2.48E–02 | 8.76E–03 | Serpin peptidase inhibitor, clade A, member 3 (SERPINA3) |
| BC014051.1 | 4542.0 | 2655.1 | 1912.8 | 4172.3 | 2748.5 | 1712.0 | 1.01E–02 | 3.86E–03 | Small inducible cytokine subfamily E, member 1 (SCYE1) |
| BC028366.1 | 1521.2 | 714.8 | 778.2 | 1107.8 | 494.5 | 610.0 | 2.14E–02 | 2.48E–02 | Testis specific, 10 (TSGA10) |
| PV3652 | 9624.5 | 5903.6 | 4835.3 | 6823.5 | 4874.0 | 4265.0 | 2.48E–02 | 1.01E–02 | TAO kinase 3 (TAOK3) |
| Transglutaminase | 6714.2 | 1124.1 | 3584.5 | 5155.8 | 1075.5 | 516.5 | 1.19E–04 | 1.57E–02 | Transglutaminase – known autoantigen |
| Histone | 6077.4 | 2721.1 | 2300.6 | 3438.0 | 2509.5 | 2593.0 | 2.48E–02 | 2.14E–02 | Unfrac. Whole histone – known autoantigen |
Table 2. ELISA validation of anti-transglutaminase and anti-histone in pSS, SLE, and healthy control subjects (n=34 for each group).
| p-Value (pSS vs. SLE) | p-Value (pSS vs. ctrl) | p-Value (SLE vs. ctrl) | AUROC value (pSS vs. SLE) | AUROC value (pSS vs. ctrl) | |
|---|---|---|---|---|---|
| Anti-histone | 2.40E–05 | 1.20E–08 | 1.70E–03 | 0.82 | 0.95 |
| Anti-transglutaminase | 4.40E–04 | 3.20E–05 | 1.20E–02 | 0.74 | 0.87 |
| Anti-SSA | 3.10E–06 | 2.90E–09 | 4.30E–02 | 0.85 | 0.93 |
| Anti-SSB | 4.30E–04 | 9.50E–06 | 3.10E–04 | 0.77 | 0.94 |
| Anti-SSA1anti-SSB | 0.86 | 0.94 | |||
| Anti-SSA1anti-SSB1anti-histone1 anti-transglutaminase | 0.90 | 0.99 |
Listed are p-values and ROC values for the four biomarkers based on the ELISA measurements.
2.5 Validation of autoantibody biomarkers
Four autoantibody biomarkers, including anti-SSA, anti-SSB, anti-transglutaminase, and anti-histone, were further validated using completely independent pSS (n=34), SLE (n=34), and healthy control populations (n=34). The four autoantibodies were chosen for additional validation because their ELISA kits are commercially available (BIOQUANT and ORGENTEC). As described previously [18], all the enrolled subjects for validation studies were female Caucasians recruited from the University Medical Center Groningen and their ages were matched among the three groups (ppSS versus SLE = 0.73; p pSS versus Ctrl = 0.03). The mean±SD age was 47±15 years for the pSS patients (n=34), 46±15 years for the SLE patients (n=34), and 41±9 (n=34) years for the healthy control subjects. Receiver-operating characteristic (ROC) analysis was used to estimate the sensitivity and specificity of the validated biomarkers.
3 Results
The purpose of this study is to identify specific saliva autoantibody biomarkers for pSS using the immune-response profiling microarrays. We included the samples from pSS, SLE, and healthy control subjects for both discovery and validation studies. SLE patients were enrolled as a non-SS autoimmune control group in this study because the disease is often associated with SS and shares a common immunopathological background. Figure 2A shows representative ProtoArray images for the saliva autoantibodies from pSS, SLE, and healthy control subjects. This microarray platform represents a new approach to biomarker discovery by identifying proteins that are recognized by antibodies present in body fluids such as serum or saliva. The data produced by current ProtoArray platform should be evaluated for the presence or absence of a significant signal, which is a commonly used approach for data analysis when using ELISA kits for autoantibody measurement. Therefore, the ProtoArray data were analyzed using the M-statistics function of the ProtoArray Prospector software in our study. In fact, M-statistics was previously compared with other commonly used statistics such as t- and U-tests (Mann–Whitney) for the analysis of DNA microarray data, and the p-values computed from the t-, U-, and M-statistics for gene ranking were found very similar [19].
Figure 2.
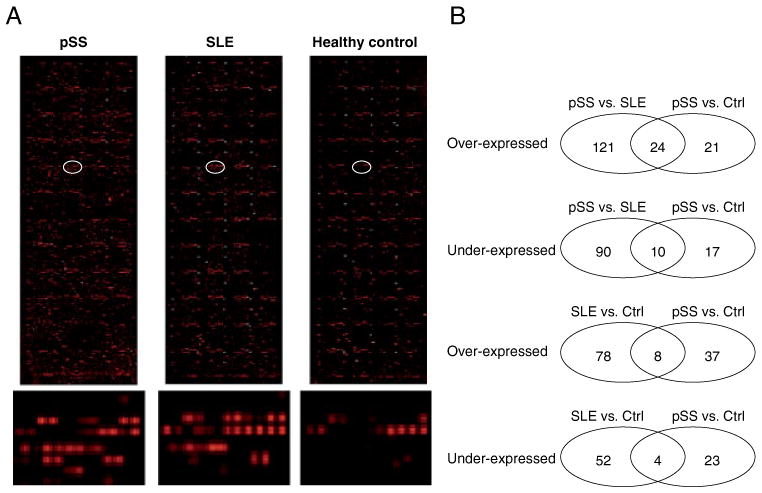
Protein microarray profiling of saliva autoantibodies in pSS, SLE, and healthy control subjects (n=13 for each group). (A) Microarray images for salivary autoantibodies in pSS, SLE, and healthy control subjects. The bottom panel shows the closeup images for the circled array spots. (B) Venn diagrams showing the number of saliva autoantibodies either over-expressed or under-expressed based on each of the two-group comparisons.
Based on the microarray profiling, 145 proteins exhibited significantly elevated (p<0.05) interaction with saliva autoantibodies in pSS patients compared with those from SLE patients who met the same threshold criteria. These 145 candidate autoantigens, ranked by p-value, are summarized in Supporting Information Table 2. Twenty-four of the 145 proteins (17%, highlighted) were also identified as candidate autoantigens for pSS when compared with the healthy control group. Conversely, 100 proteins had significantly decreased interaction with autoantibodies in pSS patients compared with those in the SLE control group. These 100 proteins, ranked by p-value, are summarized in Supporting Information Table 3. Ten of these 100 proteins (10%, highlighted) also showed decreased interaction with autoantibodies in SS patients compared wih the healthy controls.
Forty-five proteins exhibited significantly elevated interaction with autoantibodies in saliva samples from pSS patients relative to the samples from healthy control subjects (Supporting Information Table 4). Twenty-four of these 45 proteins (53%, highlighted) were also identified as candidate autoantigens for pSS when compared with the SLE control group. These proteins are summarized in Table 1 and a heatmap of the corresponding candidate autoantibodies is shown in Fig. 3. Saliva autoantibodies to these 24 proteins are highly specific to pSS because they are significantly over-expressed in pSS patients compared with both the SLE patients and healthy control subjects. On the other hand, 27 proteins showed decreased interaction with saliva autoantibodies in the pSS patients relative to those in the healthy control group (Supporting Information Table 5). Ten of these 27 proteins (37%, highlighted) also had significantly decreased interaction with autoantibodies in pSS patients relative to SLE patients.
Figure 3.
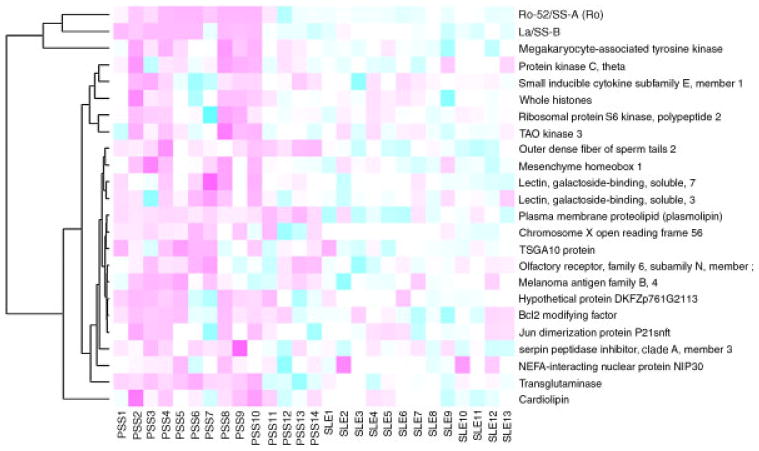
A heatmap of 24 candidates autoantibodies between pSS and SLE groups based on the protein microarray assay.
Eighty-six proteins exhibited significantly elevated interaction with autoantibodies in the SLE patients relative to those from healthy control subjects (Supporting Information Table 6). Eight of these 86 proteins (9%, highlighted) showed significantly higher interaction with saliva autoantibodies from pSS patients relative to those from the healthy control subjects. As such, autoantibodies directed against these proteins may not be specific for SS. Notably, 91% of the proteins are potential autoantigens specific to SLE, including the ones involved in signaling pathways such as TNFα (e.g. CSNK2A2 and CSNK2A1) or T-cell and B-cell receptor signaling (e.g. CMTM3, PSMD4, CDK2, and CD16). On the contrary, 56 proteins had significantly lower interaction with autoantibodies in the SLE patients compared with the healthy control subjects (Supporting Information Table 7). Four of the 56 proteins (7%, highlighted) also showed decreased interaction with saliva autoantibodies from pSS patients relative to those from the healthy controls. These findings are shown in Fig. 2B.
There are commercially available ELISA kits for four autoantibodies listed in Table 1, anti-SSA, anti-SSB, anti-histone, and anti-transglutaminase. Therefore, we further validated the four autoantibody biomarkers in saliva samples from independent patient and control populations including 34 pSS, 34 SLE, and 34 healthy control subjects. Figure 4A shows the levels of the four autoantibody biomarkers (anti-SSA, anti-SSB, anti-transglutaminase, and anti-histone) between the pSS and the SLE groups based on the protein microarray profiling. The four autoantibodies were all significantly over-expressed in pSS patients compared with both SLE patients and healthy controls, suggesting that they are valid biomarkers for pSS (Fig. 4B). Table 2 summarizes the p-values and AUROC (area under ROC curve) values for the four saliva autoantibody biomarkers, anti-SSA, anti-SSB, anti-histone, and anti-transglutaminase based on the ELISA measurements. We also performed the correlation analysis of the ELISA data between 68 saliva (34 pSS and 34 SLE) and 68 serum samples (34 pSS and 34 SLE). The correlation coefficient for anti-SSA was determined as 0.55 and the one for anti-SSB was 0.46.
Figure 4.
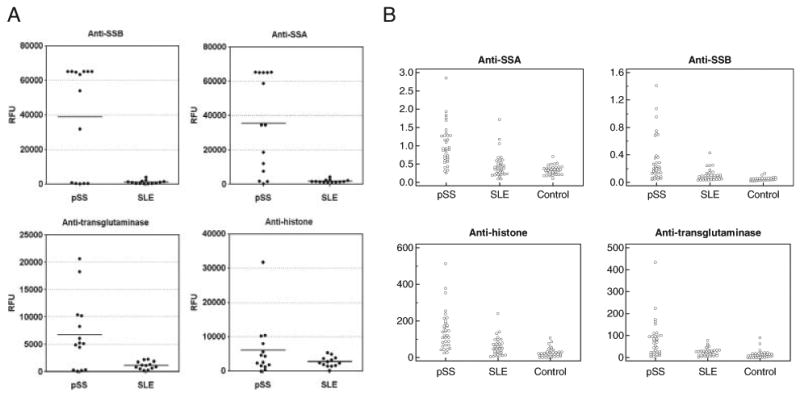
Validation of autoantibody biomarkers using commercially available ELISA kits. (A) The fluorescence signals of four autoantibodies, anti-SSA, anti-SSB, anti-transglutaminase, and anti-histone, measured by the protein microarrays. The mean fluorescence values from duplicates of the array spots are reported in RFU, and mean group value is given by the horizontal bar. (B) ELISA of anti-SSA, anti-SSB, anti-transglutaminase, and anti-histone, in pSS patients (n=34), SLE patients (n=34), and healthy control subjects (n=34).
4 Discussion
Although autoantibodies have long been used for diagnostics in autoimmune diseases, there are two major factors that confound the effective use of autoantibody biomarkers for clinical applications. First, an autoantibody biomarker is often present in multiple autoimmune diseases. For instance, several autoantibodies present in pSS patients were also found in patients with SLE and RA, two diseases often coexisting with SS [11]. To differentiate these autoimmune diseases, we need to perform a comprehensive analysis of the autoantibodies present in these disease patients so that the most specific ones can be identified. Second, the development of autoantibodies to any given protein is typically found in only a fraction of patients. Consequently, to provide sensitive and reliable clinical tests for a specific autoimmune disease, we need to identify multiple autoantibody biomarkers to improve the sensitivity and specificity.
Protein microarrays are solid-phase ligand-binding assays using immobilized proteins on the surfaces such as glass or cellulose membranes. At present, the most common protein microarray is the antibody microarray, where a collection of capture antibodies are spotted on a well-defined chip surface for the detection of proteins or other analytes. In this study, we have used a “reverse capture” protoarray microarray to identify autoantibody biomarkers for pSS. Instead of antibodies, this microarray contains more than 8000 human proteins for probing saliva autoantibodies in patients with pSS or SLE. As the majority of proteins are full length, antibodies reactive with conformational epitopes are easily recognized on the microarray [20]. This microarray platform has provided researchers with a rapid profiling approach to identify autoantibody biomarkers in body fluids for RA, colorectal cancer, ovarian cancer, and neurological disorders [21]. The assay requires a minute amount of sample, which represents an important advantage for clinical studies because clinical sample procurement is often difficult. In this study, 10 μL of each sample was used for autoantibody profiling. Such a global analysis of autoantibody responses within readily accessible body fluids represents a promising screening approach to delineating biomarker signatures in autoimmunity.
In addition to the discovery of autoantibody biomarkers for pSS, the present study may facilitate our understanding of the molecular mechanism underlying the disease. Based on the microarray profiling of pSS and SLE samples, we found that 145 proteins had significantly stronger interaction with saliva autoantibodies in patients with pSS (Supporting Information Table 2). These proteins can be grouped into several categories that span diverse biological processes: (i) Proteins that have been reported previously as biomarkers of autoimmune diseases, or have been implicated in their pathology. These include Ro-52/SS-A, transglutaminase, La/SS-B, SRPK, KIT, PRKCQ, cardiolipin, IAN4L1, CTTN, BTK, SERPINA3, LGALS3, and histones. (ii) Proteins that have known functions in immune response. These include KIT, PRKCQ, PRKCD, BMX, CAMK1D, IAN4L1, AFF4, MATK, GZMA, LGALS3, RPS6KB2, PBK, and LCP2. (iii) Proteins that function in MAPK signaling, including PBK, MAP2K3, MAPKAPK3, PAK6, EPHA8, and MAP3K3. Similarly, we revealed that 45 proteins had significantly stronger interaction with saliva autoantibodies in pSS patients based on the profiling of saliva samples from pSS patients and healthy controls (Supporting Information Table 4). These proteins fall into the similar functional categories discussed above: (i) Proteins that have been reported as biomarkers of autoimmune diseases. These include Ro-52/SSA, La/SSB, transglutaminase, ATF6, SERPINA3, PRKCQ, cardiolipin, NIP30, LGALS3, histones, MARK2, and FLT3. (ii) Proteins that have known functions in immune response. These include SCYE1, ARID3A, PRKCB1, PRKCQ, LGALS3, MATK, and MARK2. Two protein kinase C isoforms, PRKCB1, and PRKCQ, are known to participate in important immune response signaling pathways. PRKCB1 functions in B-cell receptor signaling [22] and PRKCQ plays important roles in T-cell activation and T-cell-mediated inflammation [23]. (iii) Proteins that function in MAPK signaling include MARK2, PRKCB1, TAOK3, and BMF. We also compared the present protein microarray data with the previous DNA microarray data obtained for the analysis of mRNA expression in parotid gland tissues of pSS patients [24]. Within the 45 proteins showing significantly higher interaction with saliva autoantibodies in pSS patients than in healthy controls, 20 genes were also found upregulated in pSS at the mRNA level based on the DNA microarray profiling. These genes, as implicated by both genomic and proteomic analyses, may serve as potential targets for pSS diagnosis and treatment.
To the best of our knowledge, this is the first application of protein microarrays to the discovery of saliva autoantibody biomarkers in human diseases. Many of the autoantibodies summarized in Table 1 have not been reported in pSS previously and would discriminate pSS from SLE, an autoimmune disease closely associated with SS. We have validated four saliva autoantibody biomarkers, anti-SSA, anti-SSB, anti-transglutamine, and anti-histone, using commercially available ELISA kits. Although these are known autoantibodies in SS, they were usually measured in serum samples of patients with SS for diagnostics [13, 25, 26]. Our study suggests that testing of these autoantibodies in saliva may be valuable for the diagnosis of pSS. Due to lack of commercial ELISA kits, we were unable to validate other autoantibodies summarized in Table 1. Therefore, it is important to develop ELISA or microfluidics-based assays [27] for quantitative measurement of these saliva autoantibodies. Further testing of these biomarkers in multicenter clinical trials is also necessary to prepare for their use in clinical setting. Once successfully validated, these autoantibody biomarkers can lead to a simple clinical tool for noninvasive diagnosis of pSS in saliva.
Based on the ELISA measurements, saliva anti-SSA or anti-SSB alone seems to lack sensitivity for detecting pSS. The kits from BIOQUANT were designed for testing anti-SSA and anti-SSB in serum samples. According to the instruction manual of the ELISA kits, the index number for anti-SSA or anti-SSB needs to be above 1.1 to be considered as “positive” in serum samples. Among the 34 pSS saliva samples tested, 14 were positive for anti-SSA (versus 3 out of 34 SLE samples) and only two were positive for anti-SSB (none is positive out of 34 SLE samples). This implies that the “cut-off” index number may need to be established for saliva testing. Nevertheless, the index numbers for saliva anti-SSA and anti-SSB were both found significantly higher in pSS patients than those in SLE and healthy control subjects (Fig. 4 and Table 2).
In the future, it would be valuable to discover the autoantibody biomarkers for sSS using protein microarrays. The spectrum of presentation of sSS is very broad, ranging from the local consequences of exocrine gland dysfunction to major, life-threatening systemic complications. This makes diagnosis of sSS rather complicated because any diagnostic approach must provide accurate assessment of the disease manifestations as well as differentiation between the primary and the secondary variants of the syndrome. Patients with more than one autoimmune disorder such as sSS likely develop multiple detectable autoantibodies, which may respectively reflect the particular disease phenotypes. These signature autoantibodies, once identified and validated, will allow a clinical tool for the diagnosis of sSS in patients with SLE or RA and also for differentiation of two forms of SS. In fact, the previous studies have shown an association between the presence of anti-SSA/anti-SSB and the development of sSS in patients with SLE, which provided evidence of using autoantibodies to classify the patients with sSS [28]. In addition, the microarray approach can also be used to reveal autoantibody biomarkers for SS-associated MALT lymphoma, which is a cancer of B-cell lymphocytes (extranodal marginal zone B-cell lymphoma). Autoantibodies against autologus tumor-associated antigens are detectable in the asymptomatic stage of human cancers. Using protein microarrays, such autoantibodies have been identified from serum samples to serve as biomarkers for early cancer diagnosis [29, 30]. Similarly, saliva autoantibody biomarkers may be identified for the diagnosis of MALT lymphoma in the early stage or predict progressiveness of SS patients. Because of the high rate of relapse in patients with MALT lymphoma [31], these biomarkers may also be useful for long-term follow-up of patients with SS/MALT lymphoma.
Acknowledgments
This work was supported by PHS grants R01DE017593.
Abbreviations
- MALT
mucosa-associated lymphoid tissue
- pSS
primary Sjögren's syndrome
- RA
rheumatoid arthritis
- RFU
relative fluorescence unit
- ROC
receiver-operating characteristic
- SLE
systemic lupus erythematosus
- SS
Sjögren's syndrome
- sSS
Secondary Sjögren's syndrome
Footnotes
The authors have declared no conflict of interest.
References
- 1.Fox R. Sjogren's syndrome. Lancet. 2005;366:321–331. doi: 10.1016/S0140-6736(05)66990-5. [DOI] [PubMed] [Google Scholar]
- 2.Hansen A, Lipsky PE, Dorner T. B-cell lymphoproliferation in chronic inflammatory rheumatic diseases. Nat Clin Pract Rheum. 2007;3:561–569. doi: 10.1038/ncprheum0620. [DOI] [PubMed] [Google Scholar]
- 3.Vitali C, Bombardieri S, Jonsson R, Moutsopoulos HM, et al. Classification criteria for Sjogren's syndrome: a revised version of the European criteria proposed by the American-European Consensus Group. Ann Rheum Dis. 2002;61:554–558. doi: 10.1136/ard.61.6.554. [DOI] [PMC free article] [PubMed] [Google Scholar]
- 4.Pijpe J, Kalk WWI, van der Wal JE, Vissink A, et al. Parotid gland biopsy compared with labial biopsy in the diagnosis of patients with primary Sjogren's syndrome. Rheumatology. 2007;46:335–341. doi: 10.1093/rheumatology/kel266. [DOI] [PubMed] [Google Scholar]
- 5.Giusti L, Baldini C, Bazzichi L, Bombardieri S, Lucacchini A. Proteomic diagnosis of Sjogren's syndrome. Expert Rev Proteomics. 2007;4:757–767. doi: 10.1586/14789450.4.6.757. [DOI] [PubMed] [Google Scholar]
- 6.Giusti L, Baldini C, Bazzichi L, Ciregia F, et al. Proteome analysis of whole saliva: a new tool for rheumatic diseases–the example of Sjögren's syndrome. Proteomics. 2007;7:1634–1643. doi: 10.1002/pmic.200600783. [DOI] [PubMed] [Google Scholar]
- 7.Hu S, Wang J, Meijer J, Ieong S, et al. Salivary proteomic and genomic biomarkers for primary Sjögren's syndrome. Arthritis Rheum. 2007;56:3588–3600. doi: 10.1002/art.22954. [DOI] [PMC free article] [PubMed] [Google Scholar]
- 8.Peluso G, De Santis M, Inzitari R, Fanali C, et al. Proteomic study of salivary peptides and proteins in patients with Sjögren's syndrome before and after pilocarpine treatment. Arthritis Rheum. 2007;56:2216–2222. doi: 10.1002/art.22738. [DOI] [PubMed] [Google Scholar]
- 9.Ryu OH, Atkinson JC, Hoehn GT, Illei GG, Hart TC. Identification of parotid salivary biomarkers in Sjogren's syndrome by surface-enhanced laser desorption/ionization time-of-flight mass spectrometry and two-dimensional difference gel electrophoresis. Rheumatology. 2006;45:1077–1086. doi: 10.1093/rheumatology/kei212. [DOI] [PubMed] [Google Scholar]
- 10.Baldini C, Giusti L, Bazzichi L, Lucacchini A, Bombardieri S. Proteomic analysis of the saliva: a clue for understanding primary from secondary Sjögren's syndrome? Autoimmun Rev. 2008;7:185–191. doi: 10.1016/j.autrev.2007.11.002. [DOI] [PubMed] [Google Scholar]
- 11.Arbuckle MR, McClain MT, Rubertone MV, Scofield RH, et al. Development of autoantibodies before the clinical onset of systemic lupus erythematosus. N Engl J Med. 2003;349:1526–1533. doi: 10.1056/NEJMoa021933. [DOI] [PubMed] [Google Scholar]
- 12.Franceschini F, Cavazzana I. Anti-Ro/SSA and La/SSB antibodies. Autoimmunity. 2009;38:55–63. doi: 10.1080/08916930400022954. [DOI] [PubMed] [Google Scholar]
- 13.Venables P, Charles P, Buchanan R, Yi T, et al. Quantitation and detection of isotypes of anti-SS-B antibodies by ELISA and Farr assays using affinity purified antigens. An approach to the investigation of Sjögren's syndrome and systemic lupus erythematosus. Arthritis Rheum. 1983;26:146–155. doi: 10.1002/art.1780260205. [DOI] [PubMed] [Google Scholar]
- 14.Goëb V, Salle V, Duhaut P, Jouen F, et al. Clinical significance of autoantibodies recognizing Sjögren's syndrome A (SSA), SSB, calpastatin and alpha-fodrin in primary Sjögren's syndrome. Clin Exp Immunol. 2007;148:281–287. doi: 10.1111/j.1365-2249.2007.03337.x. [DOI] [PMC free article] [PubMed] [Google Scholar]
- 15.Manoussakis MN, Georgopoulou C, Zintzaras E, Spyropoulou M, et al. Sjögren's syndrome associated with systemic lupus erythematosus: clinical and laboratory profiles and comparison with primary Sjögren's syndrome. Arthritis Rheum. 2004;50:882–891. doi: 10.1002/art.20093. [DOI] [PubMed] [Google Scholar]
- 16.Schnack C, Danzer KM, Hengerer B, Gillardon F. Protein array analysis of oligomerization-induced changes in alpha-synuclein protein-protein interactions points to an interference with Cdc42 effector proteins. Neuroscience. 2008;154:1450–1457. doi: 10.1016/j.neuroscience.2008.02.049. [DOI] [PubMed] [Google Scholar]
- 17.Schnack C, Hengerer B, Gillardon F. Identification of novel substrates for Cdk5 and new targets for Cdk5 inhibitors using high-density protein microarrays. Proteomics. 2008;8:1980–1986. doi: 10.1002/pmic.200701063. [DOI] [PubMed] [Google Scholar]
- 18.Hu S, Gao K, Pollard R, Arellano-Garcia M, et al. Preclinical validation of salivary biomarkers for primary Sjögren's syndrome. Arthritis Care Res. 2010;62:1633–1638. doi: 10.1002/acr.20289. [DOI] [PMC free article] [PubMed] [Google Scholar]
- 19.Chen JJ, Wang SJ, Tsai CA, Lin CJ. Selection of differentially expressed genes in microarray data analysis. Pharmacogenomics J. 2006;7:212–220. doi: 10.1038/sj.tpj.6500412. [DOI] [PubMed] [Google Scholar]
- 20.Predki PF, Mattoon D, Bangham R, Schweitzer B, Michaud G. Protein microarrays: a new tool for profiling antibody cross-reactivity. Hum Antibodies. 2005;14:7–15. [PubMed] [Google Scholar]
- 21.Mattoon D, Michaud G, Merkel J, Schweitzer B. Biomarker discovery using protein microarray technology platforms: antibody-antigen complex profiling. Expert Rev Proteomics. 2005;2:879–889. doi: 10.1586/14789450.2.6.879. [DOI] [PubMed] [Google Scholar]
- 22.Kang SW, Wahl MI, Chu J, Kitaura J, et al. PKC-beta modulates antigen receptor signaling via regulation of Btk membrane localization. EMBO J. 2001;20:5692–5702. doi: 10.1093/emboj/20.20.5692. [DOI] [PMC free article] [PubMed] [Google Scholar]
- 23.Hayashi K, Altman A. Protein kinase C theta (PKC theta): a key player in T cell life and death. Pharmacol Res. 2007;55:537–544. doi: 10.1016/j.phrs.2007.04.009. [DOI] [PMC free article] [PubMed] [Google Scholar]
- 24.Hu S, Zhou M, Jiang J, Wang J, et al. Systems biology analysis of sjögren's syndrome and mucosa-associated lymphoid tissue lymphoma in parotid glands. Arthritis Rheum. 2009;60:81–92. doi: 10.1002/art.24150. [DOI] [PMC free article] [PubMed] [Google Scholar]
- 25.Davies ML, Taylor EJ, Gordan C, Young SP, et al. Candidate T cell epitopes of the human La/SSB autoantigen. Arthritis Rheum. 2002;46:209–214. doi: 10.1002/1529-0131(200201)46:1<209::AID-ART10066>3.0.CO;2-1. [DOI] [PubMed] [Google Scholar]
- 26.Luft LM, Barr SG, Martin LO, Chan EKL, Fritzler MJ. Autoantibodies to tissue transglutaminase in Sjogren's syndrome and related rheumatic diseases. J Rheu-matol. 2003;30:2613–2619. [PubMed] [Google Scholar]
- 27.Wei F, Patel P, Liao W, Chaudhry K, et al. Electrochemical sensor for multiplex biomarkers detection. Clin Cancer Res. 2009;15:4446–4452. doi: 10.1158/1078-0432.CCR-09-0050. [DOI] [PMC free article] [PubMed] [Google Scholar]
- 28.Prabu A, Marshall T, Gordon C, Plant T, et al. Use of patient age and anti-Ro/La antibody status to determine the probability of patients with systemic lupus erythematosus and sicca symptoms fulfilling criteria for secondary Sjogren's syndrome. Rheumatology. 2003;42:189–191. doi: 10.1093/rheumatology/keg048. [DOI] [PubMed] [Google Scholar]
- 29.Tan H, Low J, Lim S, Chung M. Serum autoantibodies as biomarkers for early cancer detection. FEBS J. 2009;276:6880–6904. doi: 10.1111/j.1742-4658.2009.07396.x. [DOI] [PubMed] [Google Scholar]
- 30.Kijanka G, Murphy D. Protein arrays as tools for serum autoantibody marker discovery in cancer. J Proteomics. 2009;72:936–944. doi: 10.1016/j.jprot.2009.02.006. [DOI] [PubMed] [Google Scholar]
- 31.Raderer M, Streubel B, Woehrer S, Puespoek A, et al. High relapse rate in patients with MALT lymphoma warrants lifelong follow-up. Clin Cancer Res. 2005;11:3349–3352. doi: 10.1158/1078-0432.CCR-04-2282. [DOI] [PubMed] [Google Scholar]