

Abstract
Eukaryotic translation requires a suite of proteins known as eukaryotic initiation factors (eIFs). These molecular effectors oversee the highly regulated initiation phase of translation. Essential to eukaryotic translation initiation is the protein eIF2, a heterotrimeric protein composed of the individually distinct subunits eIF2α, eIF2β, and eIF2γ. The ternary complex, formed when eIF2 binds to GTP and Met-tRNAi, is responsible for shuttling Met-tRNAi onto the awaiting 40S ribosome. As a necessary component for translation initiation, much attention has been given to the phosphorylation of eIF2α. Despite several previous investigations into eIF2 phosphorylation, most have centered on α- or β- subunit phosphorylation yet little is known regarding γ-subunit phosphorylation. Herein, we report eight sites of phosphorylation on the largest eIF2 subunit with seven novel phosphosite identifications via high resolution mass spectrometry. Of the eight sites identified, three are located in either the switch regions or nucleotide binding pocket domain. In addition, we have identified a possible kinase of eIF2, protein kinase C (PKC), which is capable of phosphorylating threonine 66 (thr-66) on the intact heterotrimer. These findings may shed new light on the regulation of ternary complex formation and alternate molecular effectors involved in this process prior to 80S ribosome formation and subsequent translation elongation and termination.
Keywords: eukaryotic initiation factor 2, phosphorylation, mass spectrometry, targeted kinase involvement
INTRODUCTION
The process of translation initiation involves intricately regulated assembly and disassembly of various proteins, protein complexes, and nucleotides.1-2 Essential to this process is the anticodon pairing of Met-tRNAi to the AUG start codon of mRNA. Preceding Met-tRNAi-mRNA pairing, a ternary complex forms as GTP, Met-tRNAi, and eukaryotic initiation factor 2, eIF2. As a heterotrimeric protein, eIF2 (comprised of individually distinct α-, β-, and γ-subunits) binds GDP and subsequently Met-tRNAi following GDP-GTP exchange via the heteropentameric initiation factor, eIF2B.3 Once assembled, the ternary complex can then shuttle tRNA onto the awaiting 40S ribosome. Following the pairing of Met-tRNAi to AUG, eIF2 is recycled back to its inactive form via eIF5 directed hydrolysis as eIF2-GTP reverts back to eIF2-GDP.4
Phosphorylation of the eIF2 subunits regulates the heterotrimer’s overall function. While only two sites of phosphorylation to date have been identified on eIF2α, the smallest of the eIF2 subunits, numerous investigations have focused on ser-51 phosphorylation.5-8 During ternary complex formation, the phosphorylated ser-51 α-subunit converts the heterotrimer from an activator to an inhibitor of eIF2B catalyzed GDP-GTP exchange. Unbound to GTP, affinity for eIF2 to form a ternary complex is compromised, ultimately leading to overall protein translation inhibition.6, 8-9 Previous studies on phosphorylation of the β-subunit show minimal physiological impact as compared to that of the α-subunit but do show binding implications.10-14 Physiologically, the β-subunit interacts with Met-tRNAi, mRNA, and other initiation factors such as eIF2B, eIF3, eIF1, and eIF5.15-21 As for the largest subunit, eIF2γ, only one site of phosphorylation has been previously identified.22 Identification of phosphorylation on thr-109 stems from studies involving serum starvation, yet neither physiological significance nor responsible kinases have been identified for this specific site.
As the largest of the three subunits, the 472 amino acid human eIF2γ protein contains several binding domains, has a molecular weight of roughly 51.8 kDa, and shares 72% sequence homology to that of its counterpart in Saccharomyces cerevisiae.9, 13, 23 The γ-subunit binds directly to GDP/GTP and Met-tRNAi and serves as the heterotrimer’s core, which binds to the other subunits.24-28 The N-terminus of eIF2γ binds glycoprotein p67 which has a direct role in protecting eIF2α ser-51 phosphorylation.29-30 The γ-subunit shares homology with eEF1A, a tRNA binding protein, and has structural homology to the eubacteria G-protein EF1A.28, 31-32 Comparison of primary sequences from bacteria to mammals shows approximately 59% sequence identity and as much as 69% homology with the G binding domain, although this high sequence identity does not necessarily translate to high structural identity.13, 28 The GTP γ-phosphate regulating proteins eIF5 and eIF2B directly bind the γ-subunit.33
Despite previous investigations into eIF2γ function, the regulatory mechanisms governing these functions remain poorly understood.28, 31, 34 Although phosphorylation has been shown to directly impact binding between the α- and β-subunits, no investigations to date have directly probed for phosphorylation on human eIF2γ.14 Mutation studies have been previously performed on the γ-subunit, and results have shown that mutation of threonine, a residue known to bind phosphate, suppresses the binding efficiency of this subunit to Met-tRNAi.35
Given this interesting finding and its potential important implication to tRNA binding, we chose to more closely investigate this subunit. We probed for sites of phosphorylation using mass spectrometry, a method that has and continues to be the favored method to ascertain these post-translational modifications.36-41 Tandem mass spectrometry, coupled with nano high-performance liquid chromatography (also known as nanoLC-MS/MS), has the ability to accurately measure macromolecules and in a previous study, we successfully used nanoLC-MS/MS following phosphoenrichment via immobilized metal affinity chromatography (IMAC) and/or titanium dioxide to identify phosphosites on the largest eukaryotic initiation factor, eIF3.42-45
The goal of this study is to accurately determine phosphorylation of eIF2γ and to begin to address the enzymatic pathway leading to this specific post translational modification. To this end we have utilized high resolution nanoLC-MS/MS together with phosphoenrichment to identify potential novel sites of phosphorylation on eIF2γ. Using an LTQ-Orbitrap XL mass spectrometer, we have identified 8 sites of phosphorylation, 7 of them novel, on the γ-subunit derived from HeLa cell lysate. Subsequent to novel phosphosite identification, we used a mass spectrometric technique traditionally used for global quantification analysis of peptides/proteins to identify a potential kinase for one of the novel phosphosites. We have applied Tandem Mass Tags (TMT) to specifically target a potential kinase of eIF2γ. These primary amine reactive isobaric tags release reporter ions upon collision induced dissociation (CID), which allows for quantification of a given peptide/protein.46-47 Accordingly, we demonstrate that protein kinase C (PKC) has the capability of phosphorylating thr-66 of the γ-subunit. We specifically chose to probe kinase phosphorylation of thr-66 due to both its evolutionary conservation and its integral binding region placement within the protein. Intriguingly, PKC has been implicated in the process of translation initiation as it phosphorylates eIF2β and binds the ribosomal protein RACK1.10, 48-49 Identification of both novel phosphosites and a possible kinase on eIF2γ may ultimately reveal modes of regulation not only for eIF2 but potentially the entire process of protein translation.
EXPERIMENTAL PROCEDURES
Purification of eIF2 from HeLa cell lysate
Purification of eIF2 from HeLa cell lysate follows the published protocol for the isolation of eIF3 except for minor changes.43 HeLa cell lysate (from approximately 30L cells) was quickly thawed in a 37°C water bath and supplemented with 10% glycerin, 1 mM EDTA, 1 mM EGTA, 50 mM NaF, 50 mM beta-glycerol phosphate, 10 mM benzamidine, 1 mM DTT, and 1X protease inhibitor mixture (Roche). The resulting lysate was stirred for 10 minutes at 4°C followed by centrifugation at 20,000 × g for 20 minutes at 4°C. To the resulting supernatant, KCl was added to a final concentration of 450 mM followed by centrifugation in a Beckman Ti-45 rotor for 4 hours at 4°C at 45,000 rpm. The middle two-thirds of the supernatant was carefully removed and stirred at 4°C while saturated ammonium sulfate was added to a final concentration of 40%. After stirring on ice for 1 hour, the suspension was centrifuged at 20,000 × g for 10 minutes at 4°C and the pellet (this is known as the A cut) was frozen for future use. To the remaining supernatant, ammonium sulfate was added to a final concentration of 70%. After stirring for 1 hour, the mixture was centrifuged at 20,000 × g for 10 minutes at 4°C. The pellet (the B cut) was resuspended in 50 ml of buffer A (20 mM HEPES, pH 7.5, 10% glycerol, 1 mM EDTA, 1mM EGTA, 50 mM NaF, 50 mM beta-glycerol phosphate, 10 mM benzamidine, 1 mM DTT) containing 50 mM KCl and dialyzed in two liters of the same buffer for 2.5 h at 4°C. Following dialysis, the lysate was passed through a 0.2 μm syringe filter and loaded onto a MonoQ (10/10) column (GE Healthcare, Sunnyvale, California). The column was eluted with a linear gradient of 100 to 500 mM KCl in buffer A at 2 ml/min with 3 ml fractions collected. Fractions were then loaded onto an SDS-PAGE gel along with previously purified eIF2 to verify the location of the heterotrimer. The fractions that contained eIF2 were then, pooled, dialyzed against buffer A containing 100 mM KCl for 2.5 hours at 4°C, and loaded onto a MonoS (10/10) column (GE Healthcare, Sunnyvale, California). The same gradient was applied as that of the MonoQ column and fractions from the MonoS column were analyzed using SDS-PAGE in a similar fashion. Fractions containing eIF2 were pooled and loaded onto a hydroxyapatite column made in-house using commercial hydroxyapatite (Calbiochem, San Diego, California). Elution was performed using a linear gradient from 0 to 100% 0.5M potassium phosphate buffer at pH 7.5. Fractions were again analyzed via SDS-PAGE in a similar manner to those eluting from either the MonoQ or MonoS columns. Fractions containing the now purified eIF2 were pooled and concentrated using Amicon Ultra filtration devices with a MWCO of 10,000 Da to yield a final concentration between 1 and 2 mg/ml (Supplemental Fig. S1). Final verification for the presence of eIF2γ was performed using a western blot.
In silico analysis of eIF2γ
The FASTA primary sequences of eIF2γ derived from a) Homo sapiens (accession number: P41091), b) Saccharomyces cerevisiae (accession number: P32481), c) Methanocaldococcus jannaschii (accession number: Q58657), and d) Pyrococcus abyssi (accession number: Q9V1G0), were retrieved from the website http://www.uniprot.org/.50 For multiple sequence alignment, the clustalW2 program was used from the website http://www.ebi.ac.uk/Tools/msa/clustalw2/ using default parameters.51 For kinase prediction, the FASTA primary sequence of eIF2γ derived from Homo sapiens was input into the NetPhosK 1.0 Server at the website http://www.cbs.dtu.dk/services/NetPhosK/.52 The method used was “Prediction without filtering (fast)” and threshold was set at 0.50.
Buffer exchange of eIF2
Prior to mass spectrometric analysis, eIF2 was buffer exchanged using P10 biospin columns (BioRad, Hercules, California). The original buffer in the biospin column was exchanged 4 times with 100 mM ammonium acetate according to the manufacturer’s protocol. After exchange, 150 μl of 10 mg/ml BSA solution was loaded onto the column and spun for 4 min at 1000 × g. The column was then re-equilibrated with 4 exchanges of 100 mM ammonium acetate prior to addition of 50 μg of eIF2. Once the sample was loaded, the biospin column was spun for 4 min at 1000 × g and the resultant solution was kept in a separate tube at 4°C until ready for use.
In solution digest of eIF2 protein complex
Approximately 100 nmol of eIF2 buffer-exchanged protein was first reduced at 56°C for 45 minutes in 5.5 mM DTT followed by alkylation for one hour in the dark with iodoacetamide added to a final concentration of 10 mM. Trypsin was added at a final enzyme:substrate mass ratio of 1:50 and digestion carried out overnight at 37°C. The reaction was quenched by flash freezing in liquid nitrogen and the digest was lyophilized.
Enrichment of phosphopeptides via TiO2
One hundred nmols of reduced, alkylated, and trypsin-digested eIF2 were reconstituted in 0.1% TFA with 10% acetonitrile. Microtips filled with TiO2 purchased from Glygen (Glygen, Columbia, Maryland) were used according to the manufacturer’s instructions. Briefly, the TiO2 was equilibrated with 0.1% TFA and 10% acetonitrile prior to sample loading. Unbound peptides were washed away and bound peptides were eluted with 200 mM NH4OH. Eluted samples were dried and reconstituted in 2% acetonitrile with 0.1% TFA prior to nano-LC-MS/MS analysis.
Nano-LC-MS/MS of eIF2
Nano-LC-MS/MS was performed on both the phospho- and non-phospho-enriched eIF2 sample using an LTQ-Orbitrap XL (Thermo Fisher, San Jose, CA) mass spectrometer equipped with an ADVANCE ion max source (Michrom Bioresources Inc, Auburn, CA), a Surveyor MS pump (Thermo Fisher, San Jose, CA), and a microautosampler (Thermo Fisher, San Jose, CA). The online column consisted of 15 cm of C18 Magic beads (Michrom Bioresources Inc, Auburn, CA), particle size 5 μm with 100 Å pore size, packed into 100 μm ID fused silica. The column was equilibrated with solvent A (0.1% (v/v) formic acid in water) for 15 minutes prior to sample injection. The sample was loaded onto the column for 30 minutes at 2% solvent B (0.1% (v/v) formic acid in acetonitrile) with 98% solvent A at a flow rate of 750 nl/min. Peptides were eluted off the column at 750 nl/min using the following gradient: 2-10% solvent B for 5 minutes, 10-35% solvent B for 65 minutes, 35-70% solvent B for 5 minutes, 35-70% solvent B for 5 minutes, 70-90% solvent B for 5 minutes, 90% solvent B for 5 minutes, then reversed to 2% solvent B for 10 minutes. All ions with TMT labels were analyzed via HCD, all others with CID. The LTQ-Orbitrap XL was set to data-dependent scan of the top 5 most abundant ions with a minimum signal threshold of 55,000. Collision energy in the ion trap was set at 35% normalized collision energy and resolution was set at 30,000. Dynamic exclusion was set for 60 seconds with repeat count set to 2 and repeat duration set to 30 seconds. All data were searched via SEQUEST Bioworks 3.3.1 (Thermo Fisher, San Jose, CA) and manually validated. Those peptides with Xcorr scores greater than 2.5 were considered for further manual validation. An in-house database consisting of 584 proteins was constructed for all SEQUEST searches containing the sequences of all known mammalian eukaryotic initiation factors as well as their reversed sequences. Common contaminants including human keratins, porcine trypsin, bovine serum albumin, bovine beta-casein, PKC, and their reversed sequences were also included. We performed searches with tryptic specificity and allowed for three missed cleavages with a tolerance of 20 ppm in MS mode and 0.2 Da in MS2 mode. Possible structure modifications inputted were N-terminal and lysine TMT labeling, methionine oxidation, carbamidomethylation of cysteine, and serine, threonine, and tyrosine phosphorylation. There were three biological replicates for all experiments.
MALDI-TOF-TOF mass spectrometric analysis
For the matrix-assisted laser desorption/ionization (MALDI) mass spectrometric analysis, all mass spectra were acquired on a 4700 MALDI-TOF/TOF mass spectrometer (AB Sciex, Foster City, CA) equipped with a 200 Hz ND-YAG laser source (355 nm). The instrument was operated at an accelerating voltage of 20 kV. All spectra were taken from signal averaging of 1000 laser shots. The laser intensity was kept constant for all of the samples.
A 0.5 μl sample was mixed with an equal volume of 10 mg/ml α-Cyano-4-hydroxycinnamic acid (Sigma-Aldrich, St Louis, MO) in 50% acetonitrile aqueous solution containing 0.1% formic acid and deposited onto a standard MALDI plate 53. After drying for approximately 10 min at room temperature, the MALDI plate was loaded into the mass spectrometer and the analyses were performed in the reflector detection mode with mass range 700-4000 m/z. All MS data were further processed using Data Explorer 4.5 (AB Sciex).
Kinase Reaction
For kinase reaction validation, we incubated 10 μg of the known PKC peptide substrate neurogranin (Promega, Madison, WI) in a 60 μl reaction containing the following: 20 mM HEPES at pH7.5, 1.7 mM CaCl2, 10 mM MgCl2, 1 mM DTT, 600 ng/μl phosphatidylserine, 1 μg/μl Type III-S histone, 0.33 mM ATP, and 125 ng PKC (Promega, Madison, WI). The kinase reaction was incubated at 30°C for one hour. Efficacy of the reaction was determined via MALDI-MS (Supplemental Fig. S2). The PKC used in this study was reported to contain primarily the α, β, and γ isoforms, but also contained lesser amounts of the δ and ζ isoforms.
For the human serum albumin (HSA) kinase reaction, 50 μg HSA was equally split in half. Half of the sample underwent reduction, alkylation, and trypsin digestion. The remaining half was incubated with PKC. After sufficient incubation time with PKC, HSA was then reduced, alkylated, and trypsin digested. Peptides incubated with PKC were subsequently reacted with an excess amount of one of the TMT duplex tags, TMT-127 (Thermo Fisher, San Jose, CA). Those peptides not incubated with PKC were incubated with the other duplex tag, TMT-126. Incubation with an excess amount of TMT reagent ensured the maximum possible incorporation of the reagent onto the peptides. After incubation, all peptides were then combined and analyzed via nanoLC-MS/MS.
TMT reaction
Incorporation of TMT duplex tags (Thermo Fisher, San Jose, CA) was performed according to the manufacturer’s protocol. Briefly, both of the duplex tags were equilibrated to room temperature prior to addition of 41 μl of anhydrous acetonitrile. The reagents were allowed to dissolve for five minutes with vortexing performed twice during the dissolving time. To the peptides incubated with PKC, 20 μl of TMT-127 was added; to the peptides without PKC incubation, 20 μl of TMT-126 was added. Reaction with TMT reagent was carried out for one hour at room temperature. To quench the reaction, 5 μl of 5% hydroxylamine was added and allowed to react for 15 minutes. Peptides incubated with TMT-127 were combined with those incubated with TMT-126 and were flash frozen prior to lyophilization. Samples were reconstituted in 10 μl of 2% acetonitrile with 0.1% TFA prior to loading onto the LTQ-Orbitrap.
RESULTS
Phosphosite identification on eIF2γ
Phosphorylated eIF2 residues were identified from purified HeLa cell lysate, which was reduced, alkylated, and trypsin digested prior to nanoLC-MS/MS.43, 54 The purified heterotrimer eluted from ion exchange columns was verified via western blot (Supplemental Fig. S1). Half of the trypsin digested eIF2 underwent titanium dioxide phosphoenrichment. Both enriched and non-enriched peptide mixtures were separately loaded onto a nano-LC reversed phase (C18) column coupled to the LTQ-Orbitrap XL. All MS/MS spectra were searched with an in-house database using SEQUEST with subsequent manual validation of each spectrum in order to confirm the presence and/or absence of phosphorylation. The non phosphoenriched peptides were identified yielding 78% sequence coverage to the γ-subunit (Fig. 1).
Figure 1.
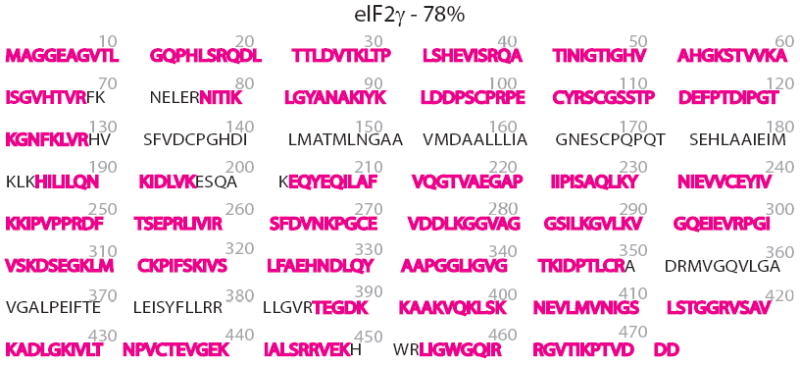
Shown is the amino acid sequence of eIF2γ. Residues in red were mapped with mass spectrometry. Total sequence coverage of the protein is 78%.
A total of 8 phosphosites were identified on eIF2γ (Table 1). All phosphorylations, identified via neutral loss, were observed only in the phosphoenriched sample suggesting low stoichiometric abundance which is typical for phosphorylated residues.54-56 An illustration of phosphorylation identification using neutral loss is shown for thr-435 (Fig. 2). To identify thr-435 phosphorylation, we selected the top 5 abundant scans for each given MS scan automatically isolating an ion at 791.4 m/z in the linear ion trap and subsequently subjecting it to CID to produce the corresponding MS/MS spectra. Multiple b and y ions were detected showing phosphate and neutral phosphate loss unambiguously identifying thr-435 phosphorylation on the γ-subunit. Similar results were observed for the remaining 7 sites identified on eIF2γ yielding a total of 8 phosphorylation sites (Supplemental Figs. S3-S5).
Table 1.
Shown are the phosphorylation sites identified via tandem mass spectrometry. The corresponding mass of the peptide along with the charge at which the peptide was observed is also shown in the table.
| Sequence | phosphorylated residue | start-end | [M + H] (Da) | z |
|---|---|---|---|---|
| IVLTNPVCTEVGEK | T435 | 427-440 | 1581.76 | 2 |
| SCGSSTPDEFPTDIPGTK | T109 | 104-121 | 1918.78 | 2 |
| STVVKAISGVHTVR | S55, T56, T66 | 55-68 | 1693.75 | 3 |
| NEVLMVNIGSLSTGGRVSAVKADLGK | S412, T413, S418 | 401-426 | 2871.31 | 3 |
Figure 2.
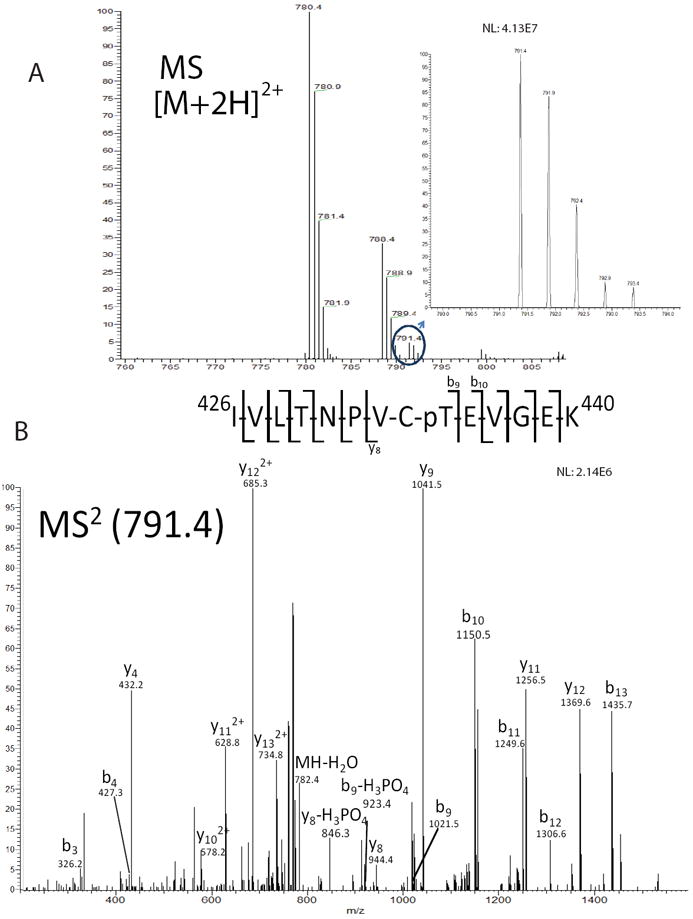
Identification of the phosphorylation site thr-435 from eIF2γ derived from HeLa cell lysate. (A) Precursor mass scan of the [M+2H]2+ ion is shown. Inset shows zoomed view of spectrum of m/z ion 791.4. (B) MS/MS spectra of m/z ion 791.4 illustrating phosphorylation of thr-435 on human eIF2γ. Diagnostic ions are labeled that indicate the phosphosite.
In silico analysis of eIF2γ
In order to further assess structural and/or functional information of the novel eIF2γ phosphosites, we performed a multiple sequence alignment of the human sequence against that of yeast and two archaea species, the latter of which had been previously crystallized (Supplemental Fig. S4).28, 31, 51 Multiple sequence alignment analyses revealed that only thr-66 phosphorylation exhibited evolutionary conservation across all four species. Structurally, thr-66 is of further interest as it resides within the switch 1 region of the protein.28 The switch regions of eIF2γ, undergo dramatic conformational rearrangements upon GTP binding, bind eIF5 or the 40S ribosome, and assist the heterotrimer in ternary complex formation.28, 35 While mutation studies have been performed on the switch regions in yeast, there have been no studies to date regarding the implication of phosphorylation within this structurally sensitive region of the protein.35
As thr-66 of eIF2γ lies within the structurally important switch 1 region and exhibits evolutionary conservation, we next probed for a kinase capable of thr-66 phosphorylation. While initially using an in silico method (see Experimental), PKC emerged as a candidate kinase that potentially phosphorylates not only thr-66, but also thr-56, the latter of which was also observed as phosphorylated in the current study (Table 2).52 The homolog to human thr-56 in Saccharomyces cerevisiae is thr-115 which has been mapped to the G1 domain and is implicated in the binding of the α-phosphate of GTP. Mutation of thr-115 to alanine on yeast suppresses eIF2 binding to Met-tRNAi.35 For the purposes of the current study, however, we directed our efforts on determining PKC’s reactivity with human thr-66 due to its evolutionary conservation. Ongoing studies are aimed at investigating PKC’s reactivity with thr-56 and also its effect on eIF2 binding with Met-tRNAi.
Table 2.
Probabilities of certain kinases phosphorylating specific residues shown here corresponding to eIF2γ. The closer the probability score is to 1, the more likely that residue is phosphorylated by the kinase listed. For thr-66, PKC has a 0.86 score to phosphorylate that residue. This computer program is available at: http://www.cbs.dtu.dk/services/NetPhosK/
| residue | kinase | probability |
|---|---|---|
| Thr-29 | p38MAPK | 0.57 |
| Ser-55 | cdc2 | 0.51 |
| Thr-56 | PKC | 0.87 |
| Thr-66 | PKC | 0.86 |
| Thr-78 | PKA | 0.53 |
| Tyr-83 | INSR | 0.53 |
| Ser-95 | cdc2 | 0.50 |
| Thr-109 | CKII | 0.57 |
| Thr-115 | CKII | 0.51 |
Establishing a kinase assay using Tandem Mass Tags
Previous investigations have implemented mass spectrometry in the global analysis of kinase activity along with their specific phosphorylated substrates.57-60 Amine-reactive isobaric reagents such as TMT or iTRAQ (isobaric tag for relative and absolute quantitation) are widely used for global quantification of peptides/proteins.47, 61 In order to analyze for individual rather than global phosphorylation, immunoblotting techniques have traditionally been used but are primarily restricted to previously established, and not novel, phosphosites. Radioactive 32P labeling coupled with mass spectrometry has also been shown to monitor stoichiometric levels of phosphorylation.62 In this strategy we describe a technique that foregoes the use of radio labels and modifies TMT to exclusively identify the kinase of specific substrates (Fig. 3).
Figure 3.
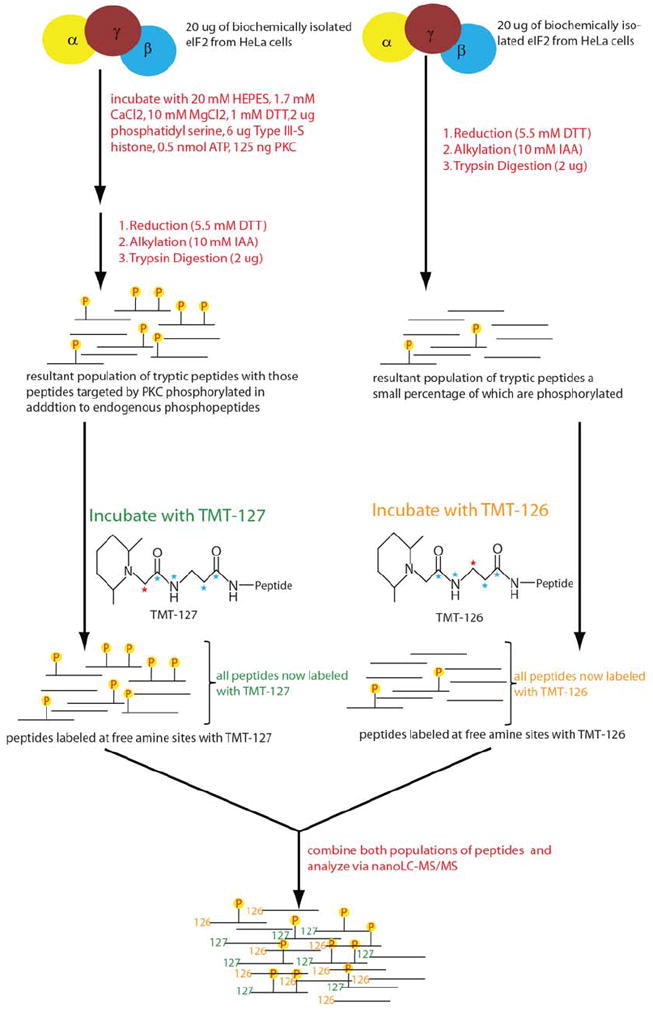
Shown is a flow diagram of our scheme to decipher possible kinases for known phosphosites.
For verification of our targeted kinase identification protocol illustrating PKC’s ability to phosphorylate thr-66 of eIF2γ, we first validated our in vitro parameters by demonstrating PKC’s efficacy at phosphorylating a known PKC peptide substrate (Supplemental Fig. S2). Next, we assessed the use of TMT to identify potential kinase substrates by looking for potential phosphorylation PKC sites on human serum albumin (HSA).63 HSA was reacted with PKC or left unreacted (see Experimental), then subjected to reduction, alkylation, and trypsin digestion. Unreacted HSA peptides were incubated with the light TMT duplex reagent and PKC reacted HSA peptides were incubated with the heavy TMT duplex reagent. After incubation, equal amounts of both TMT reacted peptides were combined and analyzed via nanoLC-MS/MS. Prior nanoLC-MS/MS analysis of HSA peptides without TMT, PKC incubation, nor phosphoenrichment revealed no detectable levels of phosphorylation on ser-82. An increase, however, in ser-82 phosphorylation was detected upon PKC incubation (Fig. 4). This finding suggests that PKC is capable of in vitro phosphorylation of HSA at ser-82. Additionally, low levels of phosphorylation become detectable without prior phosphoenrichment upon proper kinase incubation.
Figure 4.
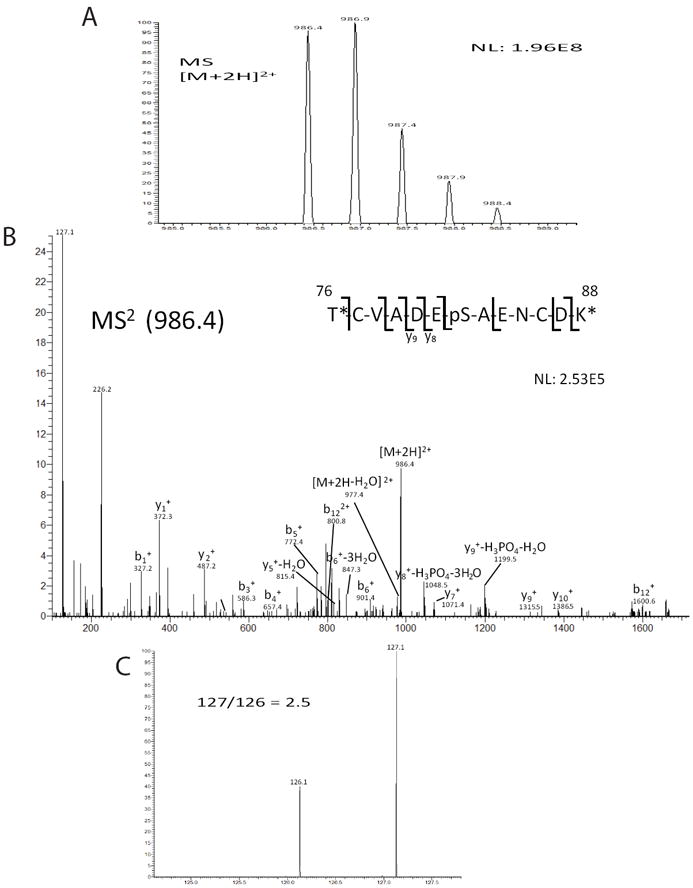
Identification of an increase of phosphorylation of thr-82 on human serum albumin (HSA) upon PKC incubation. (A) Precursor mass scan of the [M+2H]2+ ion is shown. (B) MS/MS spectra of m/z ion 986.4 illustrating phosphorylation of thr-82. Diagnostic ions are labeled that indicate the phosphosite. An asterisk is used to demarcate location of TMT label. (C) The reporter ions for TMT tags indicate a 127:126 ratio of 2.5. This indicates an increase of this phosphopeptide upon PKC incubation.
Phosphorylation of eIF2γ via PKC
After utilizing the TMT method for ser-82 of HSA, we next incubated purified eIF2 with PKC. Since eIF2γ itself has not been reported to function once removed from the trimeric complex, we decided to investigate PKC phosphorylation of thr-66 on a biologically relevant heterotrimer rather than on a single subunit or a residue present within a synthetically synthesized peptide. Analogous to prior HSA analysis, eIF2 was reacted with PKC (herein referred to as eIF2-PKC) or left unreacted (herein referred to as eIF2-nonPKC). The protein was then reduced, alkylated, and trypsin digested prior to incubation with TMT: heavy TMT duplex incubated with eIF2-PKC and light TMT duplex incubated with eIF2-nonPKC. Phosphoenrichment was then used to ensure detection of thr-66 phosphorylation on the γ-subunit. Equal amounts of each of the TMT labeled peptides were mixed and subjected to nanoLC-MS/MS analysis. Analysis of the peptide with thr-66 specifically revealed TMT reporter ions for eIF2-PKC, which were roughly four times the abundance compared to those of eIF2-nonPKC (Fig. 5). This outcome suggests that the relative amount of phosphorylation of thr-66 increased upon PKC incubation thus implicating thr-66 as a target for PKC. The absolute amounts of phosphorylation will be determined in future studies.
Figure 5.
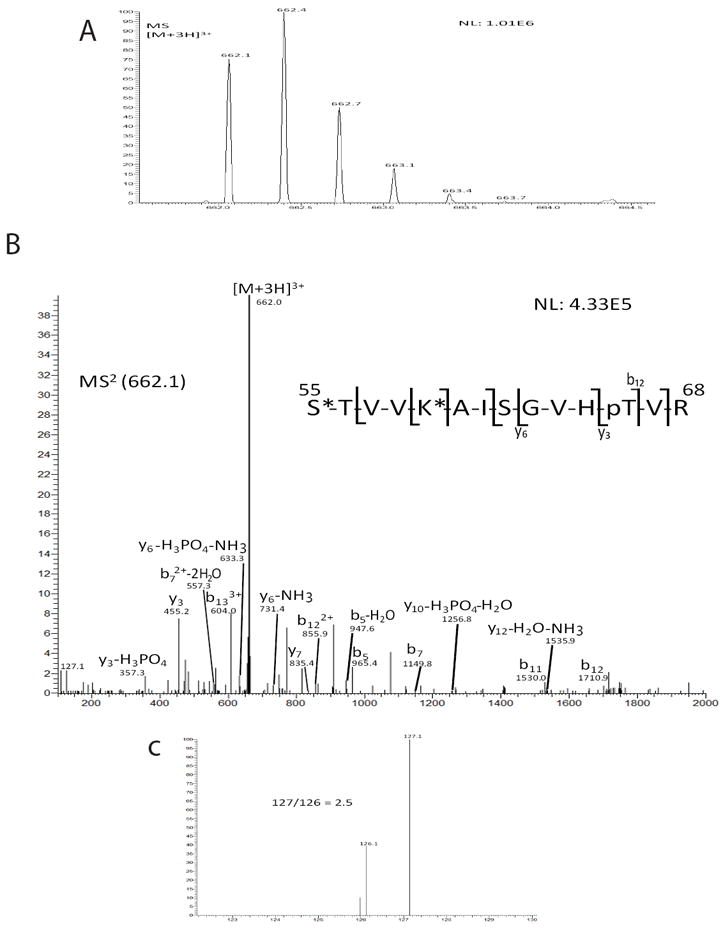
Identification of phosphorylation increase of thr-66 on eIF2γ upon PKC incubation. (A) Precursor mass scan of the [M+3H]3+ ion is shown. (B) MS/MS spectra of m/z ion 662.1 illustrating phosphorylation of thr-66. Diagnostic ions are labeled that indicate the phosphosite. An asterisk is used to demarcate location of TMT label. (C) The reporter ions for TMT tags indicate a 127:126 ratio of 2.5. This indicates an increase of this phosphopeptide upon PKC incubation.
The relatively small amount of phosphorylation for thr-66 suggests that it may be buried within the heterotrimer and possibly results in decreased accessibility for the kinase. If indeed this is the case, this raises concerns about possible temporal aspects of phosphorylation which have been previously reported for HeLa cells.64 The precise nature of thr-66 phosphorylation may vary substantially during complex formation, nucleotide binding, or even during binding of eIF2 to other initiation factors. Future studies will probe the overall dynamics of thr-66 phosphorylation and its interplay with trimer complex formation and nucleotide binding. Additional studies will investigate other possible kinases involved in the phosphorylation of not only thr-66, but the other novel phosphosites identified within this study.
Structural mapping of identified phosphorylation sites
Due to a lack of available crystal structure data on human eIF2γ, we mapped our novel phosphosites onto an archaea homolog crystal structure to better define potential biological roles for these novel sites of phosphorylations (Fig. 6).65 Although we have directed our efforts on thr-66, both ser-55 and thr-56 are phosphosites that are also within eIF2’s nucleotide binding pocket. Future investigations will determine the role of phosphorylation on GTP, magnesium, and Met-tRNAi binding for these residues.
Figure 6.
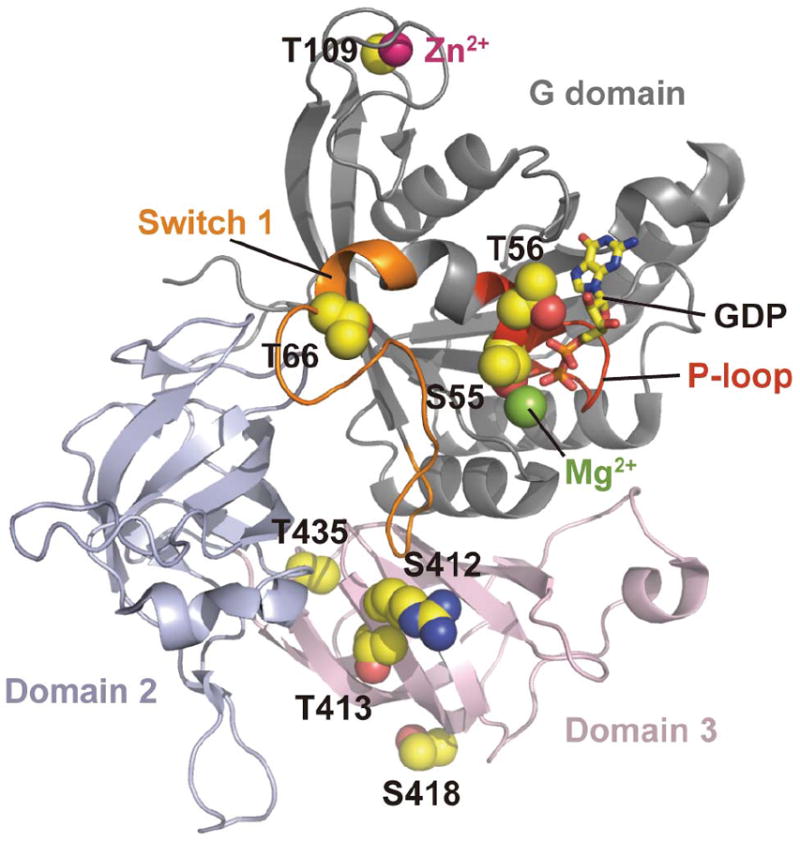
The 8 identified phosphorylation sites mapped onto archaeal eIF2γ homolog structure.64 The side chains of the residues corresponding to the phosphorylation sites are indicated as sphere models, where carbon, oxygen and nitrogen atoms are colored yellow, red, and blue respectively. The residue numbers shown correspond to those in the human factor. The GDP molecule is shown as a stick model, magnesium and zinc ions are shown as green and magenta spheres. The P-loop and switch 1 region are colored as red and orange. Domains are separated by different coloring as indicated.
The C-terminal novel phosphosites: ser-412, thr-413, ser-418, and thr-435, all structurally cluster on either domain 2 or domain 3 of the protein. Domains 2 and 3 bind eIF2α and Met-tRNAi.34 Clustering of phosphosites have also been observed on the three largest subunits of eIF3.43 Although not precisely defined, recent investigations suggest that the central core of the 13 subunit eIF3 protein consists of either eIF3a, eIF3b, and/or eIF3c. Interestingly, phosphorylation on these potential eIF3 core proteins are present as clusters and this clustering of phosphorylation sites will be a subject of future investigation on core proteins of various eIF proteins.43, 66-68 Lastly, thr-109 is located near the zinc binding domain of the γ-subunit and phosphorylation of this site has previously been reported. Discovery of additional phosphosites in the current targeted investigation suggests that potential novel phosphorylation sites may be inadvertently overlooked under global proteomic investigations.22 Additionally, thr-109 phosphorylation may be increased relative to other γ-subunit phosphorylations as its location on the periphery of the protein may cause increased kinase accessibility. Nonetheless, thr-109 phosphorylation will also be investigated regarding its role in zinc binding and subsequently its role in heterotrimer formation.
CONCLUSION
The goal of this study was to investigate novel phosphorylation sites on human eIF2γ, the largest subunit of the eIF2 heterotrimer. While only one investigation prior to our study revealed one site of phosphorylation using global phosphoenrichment of lysate, our targeted study corroborated that finding and unveiled seven additional sites of phosphorylation, all of which appear to be present at low sub-stoichiometric levels. Additionally, we have developed and made use of TMT, a common global quantification mass spectrometry reagent, to investigate potential kinase-substrate recognition. We have shown that protein kinase C is capable of in vitro phosphorylation of thr-66 on eIF2γ, and lastly, structural mapping of the phosphorylation sites revealed thr-66 mapping to the nucleotide binding pocket of the γ-subunit. Future studies will be directed at both the in vivo effect PKC phosphorylation has on eIF2 and the biological impact these phosphosites may have on the overall process of translation.
Supplementary Material
Supplemental Figure 1. Shown are UV traces of fractions eluting off a strong anion exchange column (Mono Q 10 10 column). UV reading in mAu is plotted against fraction number. (A) Fractions corresponding to eIF2 are encircled in red. Inset shows western blot of fractions 25 & 26 using an antibody against eIF2γ. Fractions 25-28 are collected for subsequent monoS 5 5 separation. (B) Fractions corresponding to eIF2 are encircled in red and further validated using imperial staining of the pooled fraction (shown in inset).
Supplemental Figure 2. MALDI-ToF of a peptide from the protein neurogranin, a known substrate of PKC. Without PKC, there is no presence of a phosphorylated peptide (upper panel). When incubated with PKC, a phosphorylated peptide appears with an increase of mass of 80 Da compared to the non-phosphorylated peptide.
Supplemental Figure 3. Identification of the phosphorylation site thr-109 from eIF2γ derived from HeLa cell lysate. (A) Precursor mass scan of the [M+2H]2+ ion is shown. (B) MS/MS spectra of m/z ion 959.9 illustrating phosphorylation of threonine 109 on human eIF2γ. Diagnostic ions are labeled that indicate the phosphosite. An asterisk is used to demarcate location of TMT label.
Supplemental Figure 4. Identification of the phosphorylation sites ser-55, thr-56, and thr-66 from eIF2γ derived from HeLa cell lysate. (A) Precursor mass scan of the [M+3H]3+ ion is shown. (B) MS/MS spectra of m/z ion 565.3 illustrating phosphorylation of ser-55, thr-56, and thr-66 on human eIF2γ. Diagnostic ions are labeled that indicate the phosphosites. An asterisk is used to demarcate location of TMT label.
Supplemental Figure 5. Identification of the phosphorylation sites ser-412, thr-413, and ser-418 from eIF2γ derived from HeLa cell lysate. (A) Precursor mass scan of the [M+3H]3+ ion is shown. (B) MS/MS spectra of m/z ion 957.8 illustrating phosphorylation of ser-412, thr-413, and ser-418 on human eIF2γ. Diagnostic ions are labeled that indicate the phosphosites. An asterisk is used to demarcate location of TMT label.
Supplemental Table 1. Shown are the phosphorylation sites identified via tandem mass spectrometry with the SEQUEST scores. The corresponding mass of the peptide along with the charge at which the peptide was observed is also shown in the table.
Acknowledgments
We would like to thank R. Tijian for HeLa cell cytoplasmic extracts. This work was funded by the National Institutes of Health Program Project Grant GM073732.
Footnotes
Supporting Information Available: More detailed technical information of eIF2 isolation from HeLa cell lysate, spectra of identified phosphorylation sites, and multiple sequence alignment results. This material is available free of charge via the Internet at http://pubs.acs.org
References
- 1.Marintchev A, Wagner G. Translation initiation: structures, mechanisms and evolution. Q Rev Biophys. 2004;37(3-4):197–284. doi: 10.1017/S0033583505004026. [DOI] [PubMed] [Google Scholar]
- 2.Kapp LD, Lorsch JR. The molecular mechanics of eukaryotic translation. Annu Rev Biochem. 2004;73:657–704. doi: 10.1146/annurev.biochem.73.030403.080419. [DOI] [PubMed] [Google Scholar]
- 3.Williams DD, Price NT, Loughlin AJ, Proud CG. Characterization of the mammalian initiation factor eIF2B complex as a GDP dissociation stimulator protein. J Biol Chem. 2001;276(27):24697–703. doi: 10.1074/jbc.M011788200. [DOI] [PubMed] [Google Scholar]
- 4.Kimball SR. Eukaryotic initiation factor eIF2. Int J Biochem Cell Biol. 1999;31(1):25–9. doi: 10.1016/s1357-2725(98)00128-9. [DOI] [PubMed] [Google Scholar]
- 5.Dever TE. Gene-specific regulation by general translation factors. Cell. 2002;108(4):545–56. doi: 10.1016/s0092-8674(02)00642-6. [DOI] [PubMed] [Google Scholar]
- 6.Dever TE, Dar AC, Sicheri F. Translational Control in Biology and Medicine. Cold Spring Harbor Laboratory Press; Cold Spring Harbor, New York: 2007. [Google Scholar]
- 7.Kudlicki W, Wettenhall RE, Kemp BE, Szyszka R, Kramer G, Hardesty B. Evidence for a second phosphorylation site on eIF-2 alpha from rabbit reticulocytes. FEBS Lett. 1987;215(1):16–20. doi: 10.1016/0014-5793(87)80105-9. [DOI] [PubMed] [Google Scholar]
- 8.Ron D, Harding HP. Translational Control in Biology and Medicine. Cold Spring Harbor Laboratory Press; Cold Spring Harbor, New York: 2007. [Google Scholar]
- 9.Proud CG. eIF2 and the control of cell physiology. Semin Cell Dev Biol. 2005;16(1):3–12. doi: 10.1016/j.semcdb.2004.11.004. [DOI] [PubMed] [Google Scholar]
- 10.Welsh GI, Price NT, Bladergroen BA, Bloomberg G, Proud CG. Identification of novel phosphorylation sites in the beta-subunit of translation initiation factor eIF-2. Biochem Biophys Res Commun. 1994;201(3):1279–88. doi: 10.1006/bbrc.1994.1843. [DOI] [PubMed] [Google Scholar]
- 11.Suragani RN, Ghosh S, Ehtesham NZ, Ramaiah KV. Expression and purification of the subunits of human translational initiation factor 2 (eIF2): phosphorylation of eIF2 alpha and beta. Protein Expr Purif. 2006;47(1):225–33. doi: 10.1016/j.pep.2005.10.003. [DOI] [PubMed] [Google Scholar]
- 12.Ting NS, Kao PN, Chan DW, Lintott LG, Lees-Miller SP. DNA-dependent protein kinase interacts with antigen receptor response element binding proteins NF90 and NF45. J Biol Chem. 1998;273(4):2136–45. doi: 10.1074/jbc.273.4.2136. [DOI] [PubMed] [Google Scholar]
- 13.Erickson FL, Nika J, Rippel S, Hannig EM. Minimum requirements for the function of eukaryotic translation initiation factor 2. Genetics. 2001;158(1):123–32. doi: 10.1093/genetics/158.1.123. [DOI] [PMC free article] [PubMed] [Google Scholar]
- 14.Rajesh K, Iyer A, Suragani RN, Ramaiah KV. Intersubunit and interprotein interactions of alpha- and beta-subunits of human eIF2: Effect of phosphorylation. Biochem Biophys Res Commun. 2008;374(2):336–40. doi: 10.1016/j.bbrc.2008.07.022. [DOI] [PubMed] [Google Scholar]
- 15.Asano K, Krishnamoorthy T, Phan L, Pavitt GD, Hinnebusch AG. Conserved bipartite motifs in yeast eIF5 and eIF2Bepsilon, GTPase-activating and GDP-GTP exchange factors in translation initiation, mediate binding to their common substrate eIF2. EMBO J. 1999;18(6):1673–88. doi: 10.1093/emboj/18.6.1673. [DOI] [PMC free article] [PubMed] [Google Scholar]
- 16.Das S, Maiti T, Das K, Maitra U. Specific interaction of eukaryotic translation initiation factor 5 (eIF5) with the beta-subunit of eIF2. J Biol Chem. 1997;272(50):31712–8. doi: 10.1074/jbc.272.50.31712. [DOI] [PubMed] [Google Scholar]
- 17.Kimball SR, Heinzinger NK, Horetsky RL, Jefferson LS. Identification of interprotein interactions between the subunits of eukaryotic initiation factors eIF2 and eIF2B. J Biol Chem. 1998;273(5):3039–44. doi: 10.1074/jbc.273.5.3039. [DOI] [PubMed] [Google Scholar]
- 18.Laurino JP, Thompson GM, Pacheco E, Castilho BA. The beta subunit of eukaryotic translation initiation factor 2 binds mRNA through the lysine repeats and a region comprising the C2-C2 motif. Mol Cell Biol. 1999;19(1):173–81. doi: 10.1128/mcb.19.1.173. [DOI] [PMC free article] [PubMed] [Google Scholar]
- 19.Singh CR, Yamamoto Y, Asano K. Physical association of eukaryotic initiation factor (eIF) 5 carboxyl-terminal domain with the lysine-rich eIF2beta segment strongly enhances its binding to eIF3. J Biol Chem. 2004;279(48):49644–55. doi: 10.1074/jbc.M409609200. [DOI] [PubMed] [Google Scholar]
- 20.Valasek L, Nielsen KH, Hinnebusch AG. Direct eIF2-eIF3 contact in the multifactor complex is important for translation initiation in vivo. EMBO J. 2002;21(21):5886–98. doi: 10.1093/emboj/cdf563. [DOI] [PMC free article] [PubMed] [Google Scholar]
- 21.Dennis MD, Person MD, Browning KS. Phosphorylation of plant translation initiation factors by CK2 enhances the in vitro interaction of multifactor complex components. J Biol Chem. 2009;284(31):20615–28. doi: 10.1074/jbc.M109.007658. [DOI] [PMC free article] [PubMed] [Google Scholar]
- 22.Hornbeck PV, Chabra I, Kornhauser JM, Skrzypek E, Zhang B. PhosphoSite: A bioinformatics resource dedicated to physiological protein phosphorylation. Proteomics. 2004;4(6):1551–61. doi: 10.1002/pmic.200300772. [DOI] [PubMed] [Google Scholar]
- 23.Gaspar NJ, Kinzy TG, Scherer BJ, Humbelin M, Hershey JW, Merrick WC. Translation initiation factor eIF-2. Cloning and expression of the human cDNA encoding the gamma-subunit. J Biol Chem. 1994;269(5):3415–22. [PubMed] [Google Scholar]
- 24.Anthony DD, Jr, Kinzy TG, Merrick WC. Affinity labeling of eukaryotic initiation factor 2 and elongation factor 1 alpha beta gamma with GTP analogs. Arch Biochem Biophys. 1990;281(1):157–62. doi: 10.1016/0003-9861(90)90426-y. [DOI] [PubMed] [Google Scholar]
- 25.Westermann P, Nygard O, Bielka H. The alpha and gamma subunits of initiation factor eIF-2 can be cross-linked to 18S ribosomal RNA within the quaternary initiation complex, eIF-2.Met-tRNAf.GDPCP.small ribosomal subunit. Nucleic Acids Res. 1980;8(14):3065–71. doi: 10.1093/nar/8.14.3065. [DOI] [PMC free article] [PubMed] [Google Scholar]
- 26.Bommer UA, Kurzchalia TV. GTP interacts through its ribose and phosphate moieties with different subunits of the eukaryotic initiation factor eIF-2. FEBS Lett. 1989;244(2):323–7. doi: 10.1016/0014-5793(89)80555-1. [DOI] [PubMed] [Google Scholar]
- 27.Nika J, Rippel S, Hannig EM. Biochemical analysis of the eIF2beta gamma complex reveals a structural function for eIF2alpha in catalyzed nucleotide exchange. J Biol Chem. 2001;276(2):1051–6. doi: 10.1074/jbc.M007398200. [DOI] [PubMed] [Google Scholar]
- 28.Roll-Mecak A, Alone P, Cao C, Dever TE, Burley SK. X-ray structure of translation initiation factor eIF2gamma: implications for tRNA and eIF2alpha binding. J Biol Chem. 2004;279(11):10634–42. doi: 10.1074/jbc.M310418200. [DOI] [PubMed] [Google Scholar]
- 29.Ghosh A, Datta R, Majumdar A, Bhattacharya M, Datta B. The N-terminal lysine residue-rich domain II and the 340-430 amino acid segment of eukaryotic initiation factor 2-associated glycoprotein p67 are the binding sites for the gamma-subunit of eIF2. Exp Cell Res. 2006;312(16):3184–203. doi: 10.1016/j.yexcr.2006.03.034. [DOI] [PubMed] [Google Scholar]
- 30.Clemens MJ. Initiation factor eIF2 alpha phosphorylation in stress responses and apoptosis. Prog Mol Subcell Biol. 2001;27:57–89. doi: 10.1007/978-3-662-09889-9_3. [DOI] [PubMed] [Google Scholar]
- 31.Schmitt E, Blanquet S, Mechulam Y. The large subunit of initiation factor aIF2 is a close structural homologue of elongation factors. EMBO J. 2002;21(7):1821–32. doi: 10.1093/emboj/21.7.1821. [DOI] [PMC free article] [PubMed] [Google Scholar]
- 32.Nikonov O, Stolboushkina E, Nikulin A, Hasenohrl D, Blasi U, Manstein DJ, Fedorov R, Garber M, Nikonov S. New insights into the interactions of the translation initiation factor 2 from archaea with guanine nucleotides and initiator tRNA. J Mol Biol. 2007;373(2):328–36. doi: 10.1016/j.jmb.2007.07.048. [DOI] [PubMed] [Google Scholar]
- 33.Alone PV, Dever TE. Direct binding of translation initiation factor eIF2gamma-G domain to its GTPase-activating and GDP-GTP exchange factors eIF5 and eIF2B epsilon. J Biol Chem. 2006;281(18):12636–44. doi: 10.1074/jbc.M511700200. [DOI] [PubMed] [Google Scholar]
- 34.Yatime L, Mechulam Y, Blanquet S, Schmitt E. Structural switch of the gamma subunit in an archaeal aIF2 alpha gamma heterodimer. Structure. 2006;14(1):119–28. doi: 10.1016/j.str.2005.09.020. [DOI] [PubMed] [Google Scholar]
- 35.Alone PV, Cao C, Dever TE. Translation initiation factor 2gamma mutant alters start codon selection independent of Met-tRNA binding. Mol Cell Biol. 2008;28(22):6877–88. doi: 10.1128/MCB.01147-08. [DOI] [PMC free article] [PubMed] [Google Scholar]
- 36.McLafferty FW. Mass spectrometry across the sciences. Proc Natl Acad Sci U S A. 2008;105(47):18088–9. doi: 10.1073/pnas.0800784105. [DOI] [PMC free article] [PubMed] [Google Scholar]
- 37.Witze ES, Old WM, Resing KA, Ahn NG. Mapping protein post-translational modifications with mass spectrometry. Nat Methods. 2007;4(10):798–806. doi: 10.1038/nmeth1100. [DOI] [PubMed] [Google Scholar]
- 38.Tyers M, Mann M. From genomics to proteomics. Nature. 2003;422(6928):193–7. doi: 10.1038/nature01510. [DOI] [PubMed] [Google Scholar]
- 39.Aebersold R, Mann M. Mass spectrometry-based proteomics. Nature. 2003;422(6928):198–207. doi: 10.1038/nature01511. [DOI] [PubMed] [Google Scholar]
- 40.Fenn JB, Mann M, Meng CK, Wong SF, Whitehouse CM. Electrospray ionization for mass spectrometry of large biomolecules. Science. 1989;246(4926):64–71. doi: 10.1126/science.2675315. [DOI] [PubMed] [Google Scholar]
- 41.Costello CE. Bioanalytic applications of mass spectrometry. Curr Opin Biotechnol. 1999;10(1):22–8. doi: 10.1016/s0958-1669(99)80005-6. [DOI] [PubMed] [Google Scholar]
- 42.Bodenmiller B, Mueller LN, Mueller M, Domon B, Aebersold R. Reproducible isolation of distinct, overlapping segments of the phosphoproteome. Nat Methods. 2007;4(3):231–7. doi: 10.1038/nmeth1005. [DOI] [PubMed] [Google Scholar]
- 43.Damoc E, Fraser CS, Zhou M, Videler H, Mayeur GL, Hershey JW, Doudna JA, Robinson CV, Leary JA. Structural characterization of the human eukaryotic initiation factor 3 protein complex by mass spectrometry. Mol Cell Proteomics. 2007;6(7):1135–46. doi: 10.1074/mcp.M600399-MCP200. [DOI] [PubMed] [Google Scholar]
- 44.Larsen MR, Thingholm TE, Jensen ON, Roepstorff P, Jorgensen TJ. Highly selective enrichment of phosphorylated peptides from peptide mixtures using titanium dioxide microcolumns. Mol Cell Proteomics. 2005;4(7):873–86. doi: 10.1074/mcp.T500007-MCP200. [DOI] [PubMed] [Google Scholar]
- 45.Meng F, Forbes AJ, Miller LM, Kelleher NL. Detection and localization of protein modifications by high resolution tandem mass spectrometry. Mass Spectrometry Reviews. 2005;24(2):126–34. doi: 10.1002/mas.20009. [DOI] [PubMed] [Google Scholar]
- 46.Schlosser A, Lehmann WD. Five-membered ring formation in unimolecular reactions of peptides: a key structural element controlling low-energy collision-induced dissociation of peptides. J Mass Spectrom. 2000;35(12):1382–90. doi: 10.1002/1096-9888(200012)35:12<1382::AID-JMS84>3.0.CO;2-6. [DOI] [PubMed] [Google Scholar]
- 47.Thompson A, Schafer J, Kuhn K, Kienle S, Schwarz J, Schmidt G, Neumann T, Johnstone R, Mohammed AK, Hamon C. Tandem mass tags: a novel quantification strategy for comparative analysis of complex protein mixtures by MS/MS. Anal Chem. 2003;75(8):1895–904. doi: 10.1021/ac0262560. [DOI] [PubMed] [Google Scholar]
- 48.Yu Y, Ji H, Doudna JA, Leary JA. Mass spectrometric analysis of the human 40S ribosomal subunit: native and HCV IRES-bound complexes. Protein Sci. 2005;14(6):1438–46. doi: 10.1110/ps.041293005. [DOI] [PMC free article] [PubMed] [Google Scholar]
- 49.Slager RE, Devasure JM, Pavlik JA, Sisson JH, Wyatt TA. RACK1, a PKC targeting protein, is exclusively localized to basal airway epithelial cells. J Histochem Cytochem. 2008;56(1):7–14. doi: 10.1369/jhc.7A7249.2007. [DOI] [PMC free article] [PubMed] [Google Scholar]
- 50.Jain E, Bairoch A, Duvaud S, Phan I, Redaschi N, Suzek BE, Martin MJ, McGarvey P, Gasteiger E. Infrastructure for the life sciences: design and implementation of the UniProt website. BMC Bioinformatics. 2009;10:136. doi: 10.1186/1471-2105-10-136. [DOI] [PMC free article] [PubMed] [Google Scholar]
- 51.Chenna R, Sugawara H, Koike T, Lopez R, Gibson TJ, Higgins DG, Thompson JD. Multiple sequence alignment with the Clustal series of programs. Nucleic Acids Res. 2003;31(13):3497–500. doi: 10.1093/nar/gkg500. [DOI] [PMC free article] [PubMed] [Google Scholar]
- 52.Blom N, Sicheritz-Ponten T, Gupta R, Gammeltoft S, Brunak S. Prediction of post-translational glycosylation and phosphorylation of proteins from the amino acid sequence. Proteomics. 2004;4(6):1633–49. doi: 10.1002/pmic.200300771. [DOI] [PubMed] [Google Scholar]
- 53.Beavis RC, Chaudhary T, Chait BT. Alpha-Cyano-4-Hydroxycinnamic Acid as a Matrix for Matrix-Assisted Laser Desorption Mass-Spectrometry. Organic Mass Spectrometry. 1992;27(2):156–158. [Google Scholar]
- 54.Mann M, Ong SE, Gronborg M, Steen H, Jensen ON, Pandey A. Analysis of protein phosphorylation using mass spectrometry: deciphering the phosphoproteome. Trends Biotechnol. 2002;20(6):261–8. doi: 10.1016/s0167-7799(02)01944-3. [DOI] [PubMed] [Google Scholar]
- 55.Villen J, Beausoleil SA, Gygi SP. Evaluation of the utility of neutral-loss-dependent MS3 strategies in large-scale phosphorylation analysis. Proteomics. 2008;8(21):4444–52. doi: 10.1002/pmic.200800283. [DOI] [PMC free article] [PubMed] [Google Scholar]
- 56.Aguiar M, Haas W, Beausoleil SA, Rush J, Gygi SP. Gas-phase rearrangements do not affect site localization reliability in phosphoproteomics data sets. J Proteome Res. 2010;9(6):3103–7. doi: 10.1021/pr1000225. [DOI] [PMC free article] [PubMed] [Google Scholar]
- 57.Cutillas PR, Geering B, Waterfield MD, Vanhaesebroeck B. Quantification of gel-separated proteins and their phosphorylation sites by LC-MS using unlabeled internal standards: analysis of phosphoprotein dynamics in a B cell lymphoma cell line. Mol Cell Proteomics. 2005;4(8):1038–51. doi: 10.1074/mcp.M500078-MCP200. [DOI] [PubMed] [Google Scholar]
- 58.Gerber SA, Rush J, Stemman O, Kirschner MW, Gygi SP. Absolute quantification of proteins and phosphoproteins from cell lysates by tandem MS. Proc Natl Acad Sci U S A. 2003;100(12):6940–5. doi: 10.1073/pnas.0832254100. [DOI] [PMC free article] [PubMed] [Google Scholar]
- 59.Blagoev B, Ong SE, Kratchmarova I, Mann M. Temporal analysis of phosphotyrosine-dependent signaling networks by quantitative proteomics. Nat Biotechnol. 2004;22(9):1139–45. doi: 10.1038/nbt1005. [DOI] [PubMed] [Google Scholar]
- 60.Cutillas PR, Khwaja A, Graupera M, Pearce W, Gharbi S, Waterfield M, Vanhaesebroeck B. Ultrasensitive and absolute quantification of the phosphoinositide 3-kinase/Akt signal transduction pathway by mass spectrometry. Proc Natl Acad Sci U S A. 2006;103(24):8959–64. doi: 10.1073/pnas.0602101103. [DOI] [PMC free article] [PubMed] [Google Scholar]
- 61.Ross PL, Huang YN, Marchese JN, Williamson B, Parker K, Hattan S, Khainovski N, Pillai S, Dey S, Daniels S, Purkayastha S, Juhasz P, Martin S, Bartlet-Jones M, He F, Jacobson A, Pappin DJ. Multiplexed protein quantitation in Saccharomyces cerevisiae using amine-reactive isobaric tagging reagents. Mol Cell Proteomics. 2004;3(12):1154–69. doi: 10.1074/mcp.M400129-MCP200. [DOI] [PubMed] [Google Scholar]
- 62.Goodlett DR, Aebersold R, Watts JD. Quantitative in vitro kinase reaction as a guide for phosphoprotein analysis by mass spectrometry. Rapid Commun Mass Spectrom. 2000;14(5):344–8. doi: 10.1002/(SICI)1097-0231(20000315)14:5<344::AID-RCM866>3.0.CO;2-W. [DOI] [PubMed] [Google Scholar]
- 63.Han G, Ye M, Zhou H, Jiang X, Feng S, Tian R, Wan D, Zou H, Gu J. Large-scale phosphoproteome analysis of human liver tissue by enrichment and fractionation of phosphopeptides with strong anion exchange chromatography. Proteomics. 2008;8(7):1346–61. doi: 10.1002/pmic.200700884. [DOI] [PubMed] [Google Scholar]
- 64.Olsen JV, Blagoev B, Gnad F, Macek B, Kumar C, Mortensen P, Mann M. Global, in vivo, and site-specific phosphorylation dynamics in signaling networks. Cell. 2006;127(3):635–48. doi: 10.1016/j.cell.2006.09.026. [DOI] [PubMed] [Google Scholar]
- 65.Sokabe M, Yao M, Sakai N, Toya S, Tanaka I. Structure of archaeal translational initiation factor 2 betagamma-GDP reveals significant conformational change of the beta-subunit and switch 1 region. Proc Natl Acad Sci U S A. 2006;103(35):13016–21. doi: 10.1073/pnas.0604165103. [DOI] [PMC free article] [PubMed] [Google Scholar]
- 66.Siridechadilok B, Fraser CS, Hall RJ, Doudna JA, Nogales E. Structural roles for human translation factor eIF3 in initiation of protein synthesis. Science. 2005;310(5753):1513–5. doi: 10.1126/science.1118977. [DOI] [PubMed] [Google Scholar]
- 67.Zhou M, Sandercock AM, Fraser CS, Ridlova G, Stephens E, Schenauer MR, Yokoi-Fong T, Barsky D, Leary JA, Hershey JW, Doudna JA, Robinson CV. Mass spectrometry reveals modularity and a complete subunit interaction map of the eukaryotic translation factor eIF3. Proc Natl Acad Sci U S A. 2008;105(47):18139–44. doi: 10.1073/pnas.0801313105. [DOI] [PMC free article] [PubMed] [Google Scholar]
- 68.Cai Q, Todorovic A, Andaya A, Gao J, Leary JA, Cate JH. Distinct regions of human eIF3 are sufficient for binding to the HCV IRES and the 40S ribosomal subunit. J Mol Biol. 2010;403(2):185–96. doi: 10.1016/j.jmb.2010.07.054. [DOI] [PMC free article] [PubMed] [Google Scholar]
Associated Data
This section collects any data citations, data availability statements, or supplementary materials included in this article.
Supplementary Materials
Supplemental Figure 1. Shown are UV traces of fractions eluting off a strong anion exchange column (Mono Q 10 10 column). UV reading in mAu is plotted against fraction number. (A) Fractions corresponding to eIF2 are encircled in red. Inset shows western blot of fractions 25 & 26 using an antibody against eIF2γ. Fractions 25-28 are collected for subsequent monoS 5 5 separation. (B) Fractions corresponding to eIF2 are encircled in red and further validated using imperial staining of the pooled fraction (shown in inset).
Supplemental Figure 2. MALDI-ToF of a peptide from the protein neurogranin, a known substrate of PKC. Without PKC, there is no presence of a phosphorylated peptide (upper panel). When incubated with PKC, a phosphorylated peptide appears with an increase of mass of 80 Da compared to the non-phosphorylated peptide.
Supplemental Figure 3. Identification of the phosphorylation site thr-109 from eIF2γ derived from HeLa cell lysate. (A) Precursor mass scan of the [M+2H]2+ ion is shown. (B) MS/MS spectra of m/z ion 959.9 illustrating phosphorylation of threonine 109 on human eIF2γ. Diagnostic ions are labeled that indicate the phosphosite. An asterisk is used to demarcate location of TMT label.
Supplemental Figure 4. Identification of the phosphorylation sites ser-55, thr-56, and thr-66 from eIF2γ derived from HeLa cell lysate. (A) Precursor mass scan of the [M+3H]3+ ion is shown. (B) MS/MS spectra of m/z ion 565.3 illustrating phosphorylation of ser-55, thr-56, and thr-66 on human eIF2γ. Diagnostic ions are labeled that indicate the phosphosites. An asterisk is used to demarcate location of TMT label.
Supplemental Figure 5. Identification of the phosphorylation sites ser-412, thr-413, and ser-418 from eIF2γ derived from HeLa cell lysate. (A) Precursor mass scan of the [M+3H]3+ ion is shown. (B) MS/MS spectra of m/z ion 957.8 illustrating phosphorylation of ser-412, thr-413, and ser-418 on human eIF2γ. Diagnostic ions are labeled that indicate the phosphosites. An asterisk is used to demarcate location of TMT label.
Supplemental Table 1. Shown are the phosphorylation sites identified via tandem mass spectrometry with the SEQUEST scores. The corresponding mass of the peptide along with the charge at which the peptide was observed is also shown in the table.