

Abstract
ULK1 (Unc51-like kinase, hATG1) is a Ser/Thr kinase that plays a key role in inducing autophagy in response to starvation. ULK1 is phosphorylated and negatively regulated by the mammalian target of rapamycin complex 1 (mTORC1). Previous studies have shown that ULK1 is not only a downstream effector of mTORC1 but also a negative regulator of mTORC1 signaling.1–3 Here, we investigated how ULK1 regulates mTORC1 signaling, and found that ULK1 inhibits the kinase activity of mTORC1 and cell proliferation. Deficiency or knockdown of ULK1 or its homolog ULK2 enhanced mTORC1 signaling, cell proliferation rates and accumulation of cell mass, whereas overexpression of ULK1 had the opposite effect. Knockdown of Atg13, the binding partner of ULK1 and ULK2, mimicked the effects of ULK1 or ULK2 deficiency or knockdown. Both insulin and leucine stimulated mTORC1 signaling to a greater extent when ULK1 or ULK2 was deficient or knocked down. In contrast, Atg5 deficiency did not have a significant effect on mTORC1 signaling and cell proliferation. The stimulatory effect of ULK1 knockdown on mTORC1 signaling occurred even in the absence of tuberous sclerosis complex 2 (TSC2), the negative regulator of mTORC1 signaling. In addition, ULK1 was found to bind raptor, induce its phosphorylation, and inhibit the kinase activity of mTORC1. These results demonstrate that ULK1 negatively regulates the kinase activity of mTORC1 and cell proliferation in a manner independent of Atg5 and TSC2. The inhibition of mTORC1 by ULK1 may be important to coordinately regulate cell growth and autophagy with optimized utilization of cellular energy.
Key words: ULK1, ULK2, Atg5, raptor, mTOR
Introduction
Unfavorable growth conditions such as nutrient starvation, cellular stress and limited availability of growth factors induce macroautophagy (hereafter autophagy) in eukaryotic cells. Through degradation of cellular components, autophagy provides energy for cell survival or for cellular restructuring during differentiation.4–8 Autophagy is under the control of the mTORC1 pathway that regulates cell growth.9–11 In favorable growth conditions, mTORC1 stimulates protein synthesis and cell growth and suppresses autophagy. Under unfavorable growth conditions, mTORC1 is inhibited resulting in suppression of cell growth and induction of autophagy.3,11–15 Although the dependence of autophagy on mTORC1 implies intimate crosstalk between autophagy and cell growth, the exact mechanism and the functional significance of the crosstalk remain unclear. Defining this mechanism is important for understanding the role of autophagy in cell growth and cancer, which will lead to the development of better strategies to prevent or treat cancer.
mTORC1 inhibits autophagy via phosphorylation of ULK1.3,12–14,16 ULK1 and its homolog ULK2 are key molecules involved in the induction of autophagy.3,13,14,16–20 Although the exact function of ULK in autophagy induction remains unresolved, it has been shown that ULK1 participates upstream of phosphatidyl-inositol-3-kinase class III (PI3KC3), another key mediator of autophagy induction, to regulate the formation of the phagophores, the precursor form of the autophagosome.3,12–14,19–21 Thus, ULK1 is considered as a key molecule that mediates mTORC1 signaling to the PI3KC3 autophagy machinery. ULK1 interacts with Atg13, FIP200 and Atg101 to form a protein complex.3,12–14,19,20,22,23 ULK2 also binds to the same proteins to form a distinct protein complex. Recent studies revealed that mTORC1 and 5′ AMP-activated protein kinase (AMPK) bind and phosphorylate ULK1.16,18,24 mTORC1 and AMPK have opposing effects on ULK1 activity. AMPK phosphorylation of ULK1 stimulates ULK1 and autophagy induction, whereas mTORC1 phosphorylation of ULK1 prevents AMPK from binding to ULK1 thus inhibiting autophagy induction.16
Although ULK1 is largely known to regulate autophagy induction, recent studies have shown that ULK1 and its homolog Atg1 in Drosophila melanogaster and Caenorhabditis elegans can negatively regulate mTORC1 signaling.1–3 ULK1 deficiency or ULK2 knockdown in mammalian cells and deletion of Atg1 gene in flies were shown to increase the phosphorylation of S6 kinase (S6K1), the key downstream target of mTORC1.1,3 Consistently, overexpression of Atg1 in Drosophila fat body reduced S6K1 phosphorylation and cell size dramatically.2 The regulation of cell growth by Atg1 and other autophagy elements has also been shown in C. elegans.25 These results suggest that ULK1/Atg1 negatively regulates mTORC1 activity and cell growth through a mechanism that may be conserved in C. elegans, Drosophila and mammals.
In this study, we sought to determine the mechanism underlying the regulation of mTORC1 by ULK1. We found that either deficiency or knockdown of ULK1, ULK2 or Atg13, but not deficiency of Atg5, enhanced mTORC1 signaling, cell proliferation rates and accumulation of cell mass. The stimulatory effect of ULK1 deficiency on mTORC1 signaling occurred independently of tuberous sclerosis complex 2 (TSC2), an upstream negative regulator of mTORC1. We found that ULK1 binds raptor, induces its phosphorylation and inhibits the kinase activity of mTORC1. These findings suggest that there is a reciprocal relationship between ULK1 and mTORC1. This regulation likely depends on the direct interaction between ULK1 and mTORC1 and is independent of Atg5-mediated autophagy. The reciprocal regulation between mTORC1 and ULK1 may be important for coordinate regulation of cell growth and autophagy in response to cellular energy and stress condition.
Results
ULK negatively regulates mTORC1.
Previous studies have shown that ULK1, ULK2 and their Drosophila homolog have negative effects on mTORC1 signaling in mammalian cells and fruit flies.1–3 We confirmed these previous results by showing that the phosphorylation of S6K1 at Thr389, the site phosphorylated by mTORC1, is highly increased in ULK1−/− MEFs and ULK1-silenced 293T cells relative to ULK1-positive control cells (Fig. 1A). We also found that knockdown of Atg13 or ULK2 in 293T cells enhanced the S6K1 phosphorylation (Fig. 1A). This result suggests that ULK1 and ULK2 negatively regulate mTORC1 signaling and the negative effects may be mediated through interaction with Atg13. Consistent with the negative effect of ULK1 on S6K1 phosphorylation, overexpression of ULK1 in 293T cells reduced S6K1 phosphorylation (Fig. 1B). The increase in the S6K1 phosphorylation was not observed with Atg5-deficient MEFs (Fig. 1A). This result suggests that ULK negatively regulates mTORC1 signaling in a manner independent of Atg5-mediated autophagy.
Figure 1.

ULK1, ULK2 and Atg13, but not Atg5, negatively regulate mTORC1 signaling. (A) Knockdown of ULK1, ULK2 and Atg13, but not Atg5, increased mTORC1 signaling. 293T cells were transduced by Atg13, ULK1, ULK2 or scrambled shRNA (control). The phosphorylation of s6K1 (p-Thr389) and the expression levels of proteins were analyzed by protein gel blotting. β-actin was a loading control. (B) Overexpression of ULK1 inhibited S6K1 phosphorylation. Cell lysate was obtained from 293T cells overexpressing myc-tagged ULK1 or cells transduced by mock vector. The phosphorylation state of endogenous S6K1 (p-Thr389) was analyzed by protein gel blotting. (C) ULK1 deficiency increased leucine-stimulated S6K1 phosphorylation. ULK1 MEFs were cultured in RPMI medium deprived of leucine for 40 min before cells were supplemented with leucine (52 µg/ml) for different periods of time. The phosphorylation state (p-Thr389) and expression level of S6K1 were analyzed by protein gel blotting. Glyceraldehyde 3-phosphate dehydrogenase (GAPDH) was a loading control. (D) ULK1 deficiency increased insulin-stimulated S6K1 phosphorylation. ULK1 MEFs were incubated in DMEM without serum overnight and treated with insulin (10 nM) for different periods of incubation time. The phosphorylation states of S6K1 (p-Thr389) and Akt (p-Ser473) and their expression levels were analyzed by protein gel blotting. β-actin was monitored as a loading control. (E) ULK1 knockdown increasesd S6K1 phosphorylation in 293T cells. 293T cells transduced by ULK1 shRNA or scrambled shRNA (control) were treated with insulin (100 nM) as described in (D). The phosphorylation states and expression levels of proteins were analyzed by protein gel blotting. (F) ULK2 knockdown increased S6K1 phosphorylation in 293T cells. The cells transduced by ULK2 shRNA or scrambled shRNA (control) were treated with insulin, and the phosphorylation state of S6K1 was analyzed as described (D). (G) Atg5 deficiency did not increase S6K1 phosphorylation. Atg5 MEFs were treated with insulin as described in (D).
To understand further how ULK regulates mTORC1 signaling, we analyzed the effects of ULK deficiency or knockdown on the response of S6K1 phosphorylation to leucine and insulin. Leucine supplementation increased S6K1 phosphorylation to a greater extent in ULK1−/− MEFs than ULK1+/+ MEFs (Fig. 1C). S6K1 phosphorylation was reduced after leucine supplementation for 10 min, indicating that the S6K1-mediated negative feedback loop26–28 is likely intact in ULK1-deficient MEFs. Insulin also stimulated S6K1 phosphorylation to a greater extent in ULK1−/− MEFs than ULK1+/+ MEFs (Fig. 1D). The S6K1 phosphorylation in ULK1−/− MEFs remained high for 60 min of insulin stimulation, then decreased to a basal level. On the other hand, the S6K1 phosphorylation in ULK1+/+ MEFs decreased to a basal level in less time (Fig. 1D). This result suggests that ULK1 is somehow involved in the negative feedback inhibition of S6K1 phosphorylation in response to insulin. It is noteworthy that the basal level of S6K1 phosphorylation in the absence of leucine or insulin was higher in ULK1-deficient MEFs or ULK2-silenced 293T cells (Fig. 1C–F and Fig. S1), suggesting that ULK is required for complete inhibition of mTORC1 under starvation conditions. Combined, these results suggest that ULK suppresses mTORC1 signaling not only under starvation but also under favorable growth conditions such as high levels of amino acids and insulin.
ULK1 negatively regulates mTORC1 signaling in a manner independent of Akt and Atg5.
We wondered whether the increase in S6K1 phosphorylation in ULK1-deficient cells is due to upregulation of Akt that positively regulates mTORC1. We found that insulin stimulated the phosphorylation of Akt at Ser473, which reflects the activation of Akt, to a lesser extent in ULK1−/− MEFs than ULK1+/+ MEFs (Fig. 1D). Despite the lower phosphorylation of Akt and the higher phosphorylation of S6K1, the level of insulin receptor substrate-1 (IRS-1), the protein targeted by S6K1 for phosphorylation and degradation,26–28 was increased in ULK1−/− MEFs compared with ULK1+/+ MEFs (Fig. S1). Although it is unclear how ULK1 deficiency suppresses Akt activation and increases the level of IRS-1, the result implies that ULK1 deficiency induces mTORC1 activation in a manner independent of Akt.
Insulin also stimulated S6K1 phosphorylation to a greater extent in ULK1-silenced 293T cells than control cells (Fig. 1E). The S6K1 phosphorylation in response to insulin was sustained longer in 293T cells than in MEFs. A similar result was obtained with knockdown of ULK2 in 293T cells (Fig. 1F). Consistent with the result where ULK1 MEFs were used, insulin-stimulated Akt phosphorylation at Ser473 was lowered by ULK1 knockdown in 293T cells (Fig. 1E). By contrast, Atg5 knockout did not have a significant effect on insulin-stimulated phosphorylation of S6K1 and Akt (Fig. 1G). Taken together, these results suggest that the negative effect of ULK on mTORC1 signaling is independent of Akt activity and Atg5-mediated autophagy.
ULK negatively regulates cell proliferation and accumulation of cell mass.
Since mTORC1 is a key regulator of cell growth and proliferation,29,30 we investigated the effects of ULK on these processes. Knockdown of ULK1 in HeLa cells significantly increased cell proliferation rate by 1.5-2 fold (Fig. 2A). Similarly, knockdown of Atg13 or ULK2 in HeLa cells enhanced cell proliferation to a similar extent as knockdown of ULK1 (Fig. 2A). Knockdown of ULK1 in 293T cells also significantly increased cell proliferation rate by 1.3 fold (Fig. 2B). We also observed a 2-fold increase in cell proliferation rate for ULK1−/− MEFs compared with ULK1+/+ MEFs (Fig. 2C). Consistent with the negative effect of ULK1 on cell proliferation, overexpression of ULK1 in 293T cells dramatically reduced cell proliferation rate (Fig. 2D). By contrast, we could not detect a significant difference in cell proliferation rates between Atg5−/− and Atg5+/+ MEFs (Fig. 2E). Combined, these results suggest that ULK1, ULK2 and their associated protein Atg13 negatively regulate cell proliferation in a manner independent of Atg5-mediated autophagy.
Figure 2.

ULK1, ULK2 and Atg13, but not Atg5, negatively regulate cell proliferation and cell mass accumulation. (A) Knockdown of ULK1, ULK2 or Atg13 in HeLa cells increased cell proliferation rate. HeLa cells were stably transduced by shRNA for ULK1, ULK2, Atg13 or scrambled sequence (control) using lentiviral vectors. Cell number was counted on day 1, 2 and 3 (see Materials and Methods for details). Values are means ± std. *p < 0.01 between control cells and each of the shRNA transduced cells. (B) Knockdown of ULK1 in 293T cells increased cell proliferation rate. (c) ULK1 deficiency in MEFs enhanced cell proliferation. (D) ULK1 overexpression in 293T cells reduced cell proliferation rate. 293T cells were transduced by either plasmid encoding myc-tagged ULK1 or empty vetor. (e) Atg5 deficiency in MEFs did not have a significant effect on cell proliferation. (F) Knockdown of ULK1 or Atg13 in HeLa cells reduced cell size. shRNA-transduced HeLa cells were analyzed for their cell sizes (see Materials and Methods for details). Average diameters of cells were 16.23 ± 0.11, 15.02 ± 0.07 and 14.99 ± 0.04 µm for scrambled, ULK1- and Atg13-shRNA transduced cells, respectively. (G) Knockdown of ULK1, ULK2 and Atg13 in 293T cells reduced cell size. Average diameters of cells were 14.72 ± 0.08, 14.35 ± 0.11, 14.25 ± 0.09 and 14.10 ± 0.13 µm for scrambled, ULK1, Atg13 and ULK2 shRNA transduced cells, respectively. (H) ULK1 deficiency in MEFs reduced cell size. Average diameters of cells were 17.42 ± 0.14 and 17.17 ± 0.09 µm for ULK1+/+ and ULK1−/− MEFs, respectively. (I) Atg5 deficiency in MEFs increased cell size slightly. Average diameters of cells were 17.55 ± 0.12 and 17.86 ± 0.10 µm for Atg5+/+ and Atg5−/− MEFs, respectively. (J) Knockdown of ULK1, ULK2 or Atg13 in HeLa cells increased total cell mass. Total cell mass was calculated using cell number and cell volume on day 3. Values of mean ± std for total cell mass were converted to percent values relative to the mass of cells from the control group. *p < 0.05 between control cells and each of shRNA-transduced cells. (K) Knockdown of ULK1 in 293T cells increased total cell mass. Data were analyzed as described in (J). (L) ULK1 deficiency in MEFs increased total cell mass. (M) Atg5 deficiency in MEFs marginally increased total cell mass.
The increase in cell proliferation rate was accompanied by a dramatic decrease in cell size. All three cell types used (HeLa, 293T and MEFs) showed reduction in cell size when ULK1, ULK2 or Atg13 was knocked down (Fig. 2F–H). This result is consistent with the previous report that Unc-51 knockout in C. elegans reduced cell size in the worm.25 Despite the reduction in cell size by ULK1, ULK2 or Atg13 deficiency or knockdown, total cell mass was greatly increased due to the increase in cell number (Fig. 2J–L). Knockdown or deficiency of ULK1, ULK2 or Atg13 increased the total mass of cells by 20–45%. By contrast, Atg5 deficiency in MEFs did not have a significant effect on cell size and total cell mass (Fig. 2I and M). These results are consistent with the role of the ULK1/2-Atg13 complex in the negative regulation of mTORC1 signaling and accumulation of cell mass.
ULK1 regulates mTORC1 signaling independently of TSC2.
To understand the mechanism by which ULK1 negatively regulates mTORC1 signaling and cell proliferation, we inquired whether tuberous sclerosis complex 2 (TSC2) is involved. TSC2 is a substrate of Akt and a negative regulator of mTORC1.31–33 If ULK1 inhibits mTORC1 via TSC2, the negative effects of ULK1 on mTORC1 signaling would not be seen with TSC2-null cells. However, it was not the case because knockdown of ULK1 in TSC2−/− MEFs could still enhance S6K1 phosphorylation (Fig. 3). The increase of S6K1 phosphorylation by ULK1 knockdown was observed for both insulin-stimulated and unstimulated conditions in TSC2-null MEFs. Akt phosphorylation at Ser473 was greatly reduced in TSC2-deficient MEFs as we would expect if the S6K1-mediated negative feedback loop is intact.26–28 Combined, these results suggest that the negative effect of ULK1 on mTORC1 signaling is independent of TSC2.
Figure 3.
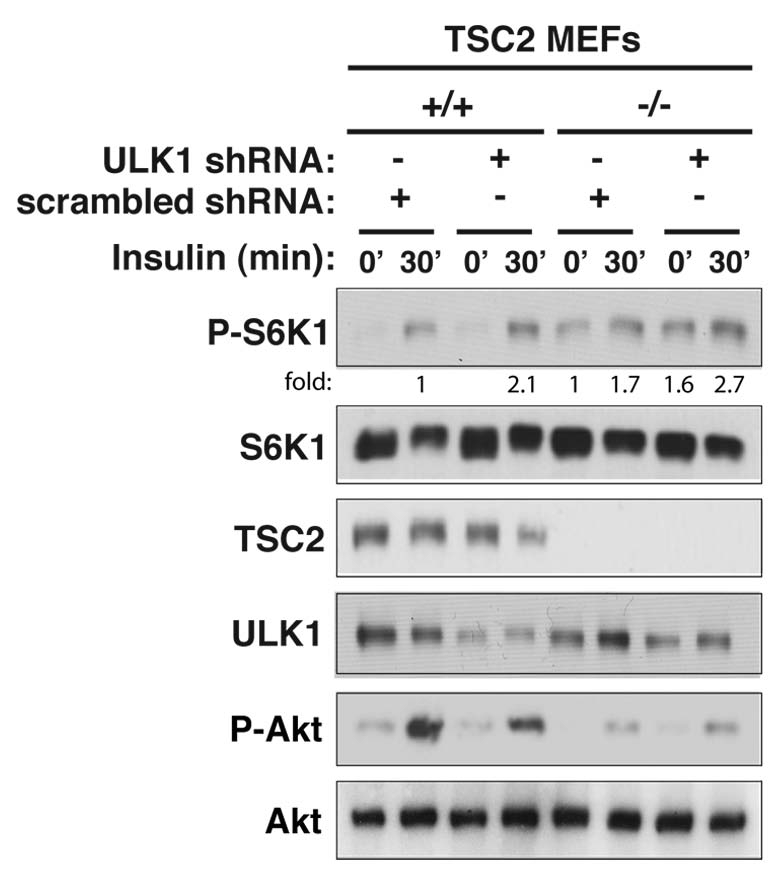
ULK1 inhibits mTORC1 signaling independently of TSC2. TSC2+/+ and TSC2−/− MEFs were stably transduced by ULK1 or scrambed shRNA using lentiviral vectors. The shRNA-transduced cells were cultured in the absence of serum overnight and treated with insulin (10 nM) for 30 min. The phosphorylation states and the expression levels of S6K1 and Akt were analyzed by protein gel blotting.
ULK1 and ULK2 bind to raptor.
Knowing that ULK1 affects mTORC1 signaling independently of Akt and TSC2, we sought to determine if ULK1 can directly affect mTORC1. A previous study has shown that ULK1 interacts with mTORC1 in a nutrient-dependent manner.14 Using recombinant proteins, we confirmed that raptor interacts with ULK1, ULK2 and Atg13 (Fig. 4A and B). We confirmed the interaction at endogenous levels by detecting endogenous ULK1 in raptor immunoprecipitate but not in rictor immunoprecipitate or immune complex obtained using pre-immune serum (Fig. 4C and D). Here, rictor was used as a negative control as it forms mTORC2, an mTOR complex distinct from mTORC1. We were also able to detect endogenous raptor in ULK1 immunoprecipitate (Fig. S2).
Figure 4.

ULK1 and ULK2 bind to raptor. (A) ULK1, ULK2 and Atg13 bind to raptor. Myc-tagged constructs were expressed with HA-tagged raptor in 293T cells. Forty-eight hours post-transfection, the amount of HA-raptor isolated by immunoprecipitation using anti-myc antibody was analyzed by protein gel blotting. HA-tagged S6K1 was used as a negative control. (B) HA-tagged ULK1 was co-immunoprecipitated with myc-tagged raptor from 293T cells. Myc-tagged tubulin and S6K1 were used as negative controls. (C) Confirmation of the ULK1-raptor interaction at endogenous levels. Raptor and rictor immunoprecipitates were obtained from 293T cells using anti-raptor and anti-rictor antibodies, respectively. The amount of ULK1 in the immune complex was assayed by protein gel blotting. The asterisk symbol (*) indicates a nonspecific band near 150 kDa. (D) Confirmation of the raptor-ULK1 interaction at endogenous levels in 293T cells. Pre-immune serum was used as a negative control. (E) Atg13 is not required for the interaction between raptor and ULK1. 293T cells transduced by shRNA were subjected to raptor immunoprecipitation. The amounts of ULK1, Atg13 and raptor in raptor immunoprecipitates were analyzed by protein gel blotting. (F) Raptor requires its full length for binding to ULK1. The full length (aas 1–1,335) or fragments derived from raptor were expressed as HA-tagged versions in 293T cells together with myc-tagged ULK1. The amount of myc-ULK1 in HA immunoprecipitates was analyzed by protein gel blotting.
To better define the interaction between ULK1 and mTORC1, we investigated whether Atg13 is necessary for the interaction. Atg13 knockdown did not affect the interaction between raptor and ULK1 in 293T cells (Fig. 4E). On the other hand, ULK1 knockdown almost completely suppressed the binding of Atg13 to raptor (Fig. 4E). Although we could not exclude the involvement of other components in the interaction, this result suggests that the ULK1-raptor interaction does not require Atg13 and that ULK1 is likely a direct binder of raptor. This result is consistent with the previous report in reference 14. Atg13 knockdown did not reduce the expression level of ULK1 in this experiment, indicating that Atg13 might not always be required for the stability of ULK1.3,13,14,23 Hosokawa et al.14 has determined that raptor binds to the Pro/Ser-rich (PS) domain in the middle region of ULK1. We determined that ULK2 also utilizes its PS domain to bind raptor (Fig. S3). Through a delimitation experiment, we determined that raptor requires its full size for the interaction with ULK1 (Fig. 4F). This is similar to what was observed for raptor interaction with mTOR and PRAS40.34,35
ULK1 regulates the mTOR-raptor interaction in response to insulin.
Knowing that ULK1 binds to raptor, we wondered whether ULK1 could affect the integrity of mTORC1 and thereby inhibit mTORC1 activity. Previously, it was shown that leucine or insulin in cell culture medium, relative to their deprivation, sensitizes the mTOR-raptor interaction to disruption by the zwitterionic detergent CHAPS in lysis buffer.34,35 Although the molecular basis for this sensitization is unknown, the con-formational state of mTORC1 destabilized by the detergent correlated with a higher kinase activity of mTORC1.34,35 As shown previously in reference 35, insulin reduced the affinity of the mTOR-raptor interaction in the CHAPS-containing lysis buffer (Fig. 5A). The reduction was greater when ULK1 was deficient in MEFs and correlated with increases of S6K1 phosphorylation (Fig. 5A). The most drastic change in the interaction occurred when cells were incubated with insulin for 10 min. A similar result was obtained with ULK2 knockdown in 293T cells (Fig. 5B). Because ULK1 and ULK2 likely have redundant functions, we inquired whether knockdown or deficiency of both ULK1 and ULK2 might accentuate the difference. We found that ULK2 knockdown in ULK1-null MEFs further reduced the affinity of the raptor-mTOR interaction (Fig. S4). In particular, the affinity of interaction was not recovered at the incubation with insulin for 120 min, while control cells showed recovery of the interaction. This result supports the involvement of both ULK1 and ULK2 in the regulation of mTORC1 integrity in response to insulin.
Figure 5.

ULK1 regulates the mTOR-raptor interaction in response to insulin and induces raptor phosphorylation. (A) ULK1 deficiency destabilized the mTOR-raptor interaction in vitro in response to insulin, and the destabilization correlated with higher levels of S6K1 phosphorylation. ULK1 MEFs were treated with insulin as described in Figure 1D. mTOR immunoprecipitate was obtained using anti-mTOR antibody in cell lysis buffer containing 0.3% CHAPS, and the amount of raptor was analyzed by protein gel blotting. (B) ULK2 knockdown in 293T cells destabilized the mTOR-raptor interaction in response to insulin. shRNA-transduced 293T cells were treated with insulin as described in Figure 1D. The amount of raptor in mTOR immunoprecipitate was analyzed by co-immunoprecipitation and protein gel blotting. (C) ULK1 knockdown suppressed the mobility shift of raptor on SDS-PAGE. Raptor from shRNA-transduced 293T cells, which were treated with insulin for 30 min, was analyzed on SDS-PAGE. (D) ULK1 deficiency suppressed the mobility shift of raptor. Raptor from ULK1 MEFs treated with insulin for 30 min was analyzed. (E) ULK1 induces phosphorylation of raptor. HA-tagged raptor was expressed with myc-tagged ULK1 wild-type (wt) or M92A kinase dead mutant (kd) in 293T cells. HA-raptor and myc-ULK1 were isolated by immunoprecipitation using anti-myc antibody. Migration patterns of raptor and ULK1 on SDS-PAGE were analyzed by protein gel blotting after the myc immunoprecipitate was treated with or without lambda phosphatase.
A previous study showed that amino acids regulate the interaction between mTORC1 and ULK1.14 We wondered whether insulin also regulates the mTORC1-ULK1 interaction. Insulin did not have a significant effect on the interaction between raptor and ULK1 (Fig. S5). Although we could not exclude a possibility that our assay condition might not be sensitive enough to monitor a significant change in the affinity of the raptor-ULK1 interaction, we favor an interpretation that insulin-mediated regulation of the mTORC1 integrity does not seem to be due to a change in the affinity of the mTORC1-ULK1 interaction (Fig. S5). The regulation is also not likely due to a change in ULK1 kinase activity because insulin did not show a significant effect on the kinase activity of ULK1 (Fig. S5). Combined, these results suggest that ULK1, in response to insulin, induces a con-formational state of mTORC1 to be more resistant to CHAPS in vitro and less catalytically active.
ULK1 induces raptor phosphorylation.
Knowing that ULK1 binds to raptor and affects the interaction between mTOR and raptor in response to insulin, we inquired whether ULK1 would phosphorylate mTORC1. Insulin treatment to ULK1+/+ MEFs induced an upward shift of raptor on SDS-PAGE (Fig. 5A). The shift was not dramatic but clear enough to be detectable with insulin stimulation, especially for 30 min (Fig. 5A). The shift was largely suppressed in the absence of ULK1. The dependence of the mobility shift on ULK1 became clearer when comparison was made between raptor from ULK1-silenced or deficient cells and control cells that were stimulated with insulin for 30 min (Fig. 5C and D). The mobility shift of raptor was also dependent upon ULK2 in 293T cells (Fig. 5B).
To determine whether the mobility shift is due to phosphorylation, we coexpressed raptor with ULK1 wild-type or kinase dead mutant (M92A) in 293T cells. Supporting the role of ULK1 in raptor phosphorylation, ULK1 wild type, relative to ULK1 kinase dead mutant (M92A), induced a dramatic upward shift of raptor (Fig. 5E). The mobility shift was suppressed when raptor was treated with lambda phosphatase (Fig. 5E). Although we could not exclude the possibility that the mobility shift is due to nonphosphorylational modifications, we favor our interpretation that the mobility shift is due to phosphorylation given the reproducible change of raptor electrophoretic mobility depending on ULK1 (Fig. 5A–D), and ULK1 kinase activity is responsible for raptor phosphorylation (Fig. 5E). Combined, these results suggest that ULK1 induces raptor phosphorylation.
ULK1 inhibits mTORC1 kinase activity.
Knowing that ULK1 binds raptor and promotes raptor phosphorylation, we considered the possibility that ULK1 might inhibit the kinase activity of mTORC1. We isolated mTOR using anti-mTOR antibody from ULK1 MEFs and analyzed the kinase activity of mTOR toward phosphorylation of S6K1 and 4E-BP1, two well-known substrates of mTORC1. We found that mTOR from ULK1−/− MEFs showed about 1.6–2.2-fold higher kinase activity toward phosphorylation of S6K1 and 4EBP1 compared with mTOR from ULK1+/+ MEFs (Fig. 6A and B). To confirm that ULK1 specifically inhibits mTORC1, we performed the in vitro kinase assay by isolating mTORC1 using anti-raptor antibody. As expected, the kinase activity was higher with mTORC1 isolated from ULK1−/− MEFs compared with that from ULK1+/+ MEFs (Fig. 6C). We obtained a similar result by using mTORC1 isolated from 293T cells (Fig. 6D). On the other hand, the kinase activity of mTORC2 isolated by immunoprecipitation using anti-rictor antibody was not altered by ULK1 deficiency (Fig. 6E). This result suggests that the reduction in Akt phosphorylation by ULK1 deficiency is unlikely to be due to inhibition of mTORC2.
Figure 6.

ULK1 inhibits the kinase activity of mTORC1. (A) ULK1 has a negative effect on the kinase activity of mTORC1. mTOR was isolated from ULK1 MEFs. The kinase activity of mTOR was analyzed using S6K1 as substrate. The phosphorylation state of S6K1 at Thr389 was analyzed by protein gel blotting. The level of phosphorylation was quantitatively analyzed in the bar graph on the right-hand side. Values are means ± std from three independent experiments. *p < 0.05. (B) The inhibitory effect of ULK1 on mTORC1 kinase activity was assessed in vitro using 4E-BP1 as substrate. The bar graph represents quantitative assessment of the phosphorylation state of 4E-BP1 at Thr37/46. Values are mean ± std from two independent experiments. *p < 0.05. The mobility shift of raptor was unclear because we used a high perent of acrylamide in SDS-PAGE to analyze 4E-BP1. (C) Raptor immunoprecipitate isolated from ULK1 MEFs was analyzed for the kinase activity toward phosphorylation of 4E-BP1. (D) Raptor immunoprecipitate isolated from scrambled (sc) or ULK1 shRNA-transduced 293T cells was analyzed for the kinase activity toward phosphorylation of 4E-BP1. (E) Rictor immunoprecipitate isolated from ULK1 MEFs was analyzed for the kinase activity toward phosphorylation of Akt at Ser473. (F) Model for the reciprocal regulation between the ULK1 complex and mTORC1.
Although we could not exclude the possibility that ULK1 inhibits mTORC1 through an unknown intermediate molecule, these results are in favor of our hypothesis that ULK1 negatively regulates the kinase activity of mTORC1 and the negative regulation is mediated through ULK1 binding to raptor and phosphorylation of raptor.
Discussion
In this study, we demonstrated that ULK1 binds raptor, induces raptor phosphorylation and inhibits the kinase activity of mTORC1. Although ULK1 is mainly understood to trigger autophagy under starvation conditions, we found that ULK1 has a function to negatively regulate mTORC1. The negative regulation of mTORC1 by ULK1 implies that there is an intimate crosstalk between the cell growth pathway and the autophagy machinery. Through this crosstalk, mTORC1 and ULK1 may coordinate autophagy and cell growth in response to cellular nutritional or energy status (Fig. 6F). The negative regulation of mTORC1 by ULK1 occurred even in conditions where amino acids or insulin were present at high levels (Fig. 1). In favorable growth conditions, ULK1 may contribute to the suppression of cellular overgrowth by inhibiting mTORC1. It is also possible that ULK1, under favorable growth conditions, may modulate the S6K1-IRS1 negative feedback loop, because ULK1 knockdown or deficiency altered IRS-1 levels and the kinetics of phosphorylated-S6K1 downregulation in response to insulin (Fig. 1 and Fig. S1). The negative regulation of mTORC1 signaling by ULK1 may also be important for cell survival.16,18
Without knowing the ULK1 phosphorylation sites in raptor, we could not determine whether raptor phosphorylation is necessary for the inhibition of mTORC1 kinase activity. More than 20 serine and threonine residues in raptor are known as phosphorylation sites. AMPK, mTOR, RSK, Erk and Cdc2 have been shown to phosphorylate raptor.36–40 Recently, Dunlop et al. reported that ULK1 promotes raptor phosphorylation at multiple sites and inhibits the binding of raptor to mTORC1 substrates such as S6K1 and 4EBP1.41 This study is in line with our finding. However, both studies failed to determine whether ULK1 directly phosphorylates raptor and whether ULK1 inhibition of mTORC1 depends on raptor phosphorylation. Further characterization of raptor phosphorylation is required to determine the exact function of ULK1 in the negative regulation of mTORC1.
Consistent with the inhibition of mTORC1 by ULK1, we found that ULK1 has a negative effect on cell proliferation and accumulation of cell mass. The negative regulation of cell proliferation by ULK1 may be attributed to its inhibition of mTORC1, although we could not rule out a mechanism independent of mTORC1. We found that ULK deficiency or knockdown reduces cell size (Fig. 2). The reduction in cell size by ULK knockdown or deficiency is consistent with a recent report that a mutational inactivation of Unc-51 in C. elegans reduced cell size.25 It is possible that ULK1 knockdown may facilitate cell cycle progression by shortening the G2 phase, a period of rapid cell growth. Like ULK1 knockdown, Atg13 or ULK2 knockdown also reduced cell size and increased cell proliferation (Fig. 2). Whether the effects of ULK/Atg13 on cell size and cell proliferation do or do not depend on mTORC1 requires further investigation.
According to our model, the inhibitory effect of ULK1 on mTORC1 might only occur when ULK1 is associated with mTORC1. If this were to be the case, a question might arise with respect to the effect of insulin on the mTORC1-ULK1 interaction. Insulin only marginally suppressed the affinity of the mTORC1ULK1 interaction (Fig. S5). Furthermore, insulin did not have a significant effect on the kinase activity of ULK1 (Fig. S5). This result is consistent with our observation that ULK1 inhibits mTORC1 not only under starvation conditions but also under insulin stimulation conditions. Although we see a reduction in the affinity of the mTOR-raptor interaction under insulin stimulation conditions in a manner dependent upon ULK1 (Fig. 5), this might not reflect the dissociation of the proteins, but instead, a conformational state of mTORC1 that is more active than the state resistant to the detergent CHAPS. This conformational state might be similar to the state seen under high nutrient conditions that is less resistant to destabilization by the detergent in vitro.34,35
Given the negative effect of ULK1 on mTORC1, it is tempting to speculate that ULK1 might be dysregulated in cancer and other human diseases, such as hamartoma syndrome, associated with hyperactive mTORC1. The ULK1/2-Atg13 complex could be an important target to treat or prevent the disease states. It may be possible to inhibit mTORC1 signaling either by increasing the expression level of ULK or by promoting the raptor-ULK interaction. Furthur studies are needed to reveal the mechanism underlying the regulation of mTORC1 by ULK and the importance of the regulation for human diseases.
Materials and Methods
Chemicals and antibodies.
Primary antibodies were from the following sources: Anti-ULK1 (Santa Cruz Biotech, sc-10900 and sc-33182); anti-mTOR (Santa Cruz Biotech, sc-1549 for human protein; Cell Signaling Technologies, 9272 for mouse protein); anti-TSC2 (Santa Cruz Biotech, sc-893); anti-GAPDH (Santa Cruz Biotech, sc-25778); anti-ULK2 (Abcam, ab56736); antiS6K1 (Cell Signaling Technologies, 9202), anti-phospho-S6K1 (Cell Signaling Technologies, 9205); anti-Akt (Cell Signaling Technologies, 9272); anti-phospho-Akt (Cell Signaling Technologies, 9271); anti-phospho-4E-BP1 (Cell Signaling Technologies, 9459); anti-4E-BP1 (Cell Signaling Technologies, 9452); anti-HA (Covance, MMS-101R-1000); anti-Myc (EMD Biosciences, OP10-200UG). Secondary antibodies were from Santa Cruz Biotechnologies. Anti-Atg13, anti-raptor and anti-rictor antibodies are described in our previous reports in reference 3, 34 and 42. Anti-ULK1 anibody for ULK1 immunoprecipitation is described in our previous report in reference 3. Rapamycin was from EMD Biosciences (553210-1MG). Bovine insulin was from Sigma (I6634).
Cell culture and transfection.
HEK293T and HeLa cells and MEFs were cultured in DMEM (Invitrogen, 11995-065) supplemented with 10% fetal bovine serum, penicillin and streptomycin at 37°C in 5% CO2. For transient expression, cells were transfected with recombinant DNA or shRNA constructs using FuGENE™ 6 (Roche, 11988387001) following the manufacturer's protocol. Cells were harvested 2 d post-transfection for co-immunoprecipitation assay.
Co-immunoprecipitation and protein gel blotting.
For co-immunprecpititation studies, whole-cell extracts were prepared in buffer containing 40 mM Hepes, pH 7.4, 120 mM NaCl, 1 mM EDTA, 50 mM NaF, 1.5 mM Na3VO4, 10 mM β-glycerophosphate and 0.3% CHAPS supplemented by EDTA-free protease inhibitor cocktail (Roche, 05056489001). Immunoprecipitated proteins were washed four times using lysis buffer, loaded onto 8% Tris-glycine gels (Invitrogen, EC60185), transferred onto immunoblot polyvinylidene difluoride (PVDF) membranes (Bio-Rad, 1620177) and detected with chemiluminescence reagents (Perkin-Elmer, NEL105001).
Lentiviral preparation, viral infection and stable cell line generation.
Lentiviral vector pLKO.1 encoding shRNA that targets ULK1, ULK2 or Atg13 or shRNA of a scrambled sequence was introduced into HEK293T with lentiviral packaging vectors pHR'8.2ΔR and pCMV-VSV-G using FuGENE 6. Viruses were collected 60 h after transfection and target cells were infected with the collected viruses in the presence of polybrene. Stably transduced cells were selected under puromycin. The target sequences for ULK1 and Atg13 shRNAs and the scrambled shRNA sequence are described in our previous report in reference 3. The target sequence for mouse ULK2 shRNA is CCA AAG ACT CTG CGA GTA ATA. Knockdown of ULK2 was confirmed by RT-PCR.
In vitro kinase assay.
mTOR immunoprecipitate was obtained from MEFs using anti-mTOR, raptor or rictor antibody. As substrates, recombinant S6K1 was purified from rapamycin-treated 293T cells expressing GST-S6K1. 4E-BP1 was obtained from Stratagene (206160). Inactive Akt1 was obtained from Millipore (14-279). The kinase reaction for mTORC1 was performed in a buffer containing 25 mM HEPES, pH 7.4, 50 mM KCl, 10 mM MgCl2, 500 µM ATP and 500 ng of S6K1 or 4EBP1 for the indicated periods of time at 30°C. The kinase reaction for mTORC2 was performed in a buffer containing 25 mM HEPES, pH 7.5, 100 mM potassium acetate, 1 mM MgCl2, 500 µM ATP and 250 ng of Akt1. All the kinase reactions were stopped by adding SDS-sample loading buffer. The phosphorylation of S6K1, 4E-BP1 and Akt1 was analyzed by protein gel blotting using antibodies specific to p-Thr389, p-Thr37/46 and p-Ser473, respectively. For ULK1 kinase assay, we obtained ULK1 immunoprecipitate from 293T cells and followed the protocol described in our previous report in reference 3.
Cell size measurement.
Cells infected with lentiviruses were split onto 6 well plates at 30% confluence and next day cells were trypsinized and harvested with DMEM. After dilution 10 times with Isoton II diluent (Beckman Coulter Inc., BCC-8546719-20L), cells were loaded on Z2 coulter cell size analyzer (Beckman Coulter Inc.).
Cell proliferation assay.
Cells infected with lentivirus were grown in DMEM and analyzed for cell number on day 1, 2 and 3. At the cell counting, cell density was below 30% in confluence. For each day cells were trypsinized and harvested with DMEM. Cells were diluted 10 times with Isoton II diluent and loaded on Z2 coulter. Three independent measurements were quantitatively analyzed (mean ± std). p values were obtained from Student t-test using Kaleida Graph software (Synergy Software).
Acknowledgements
We thank M. Kundu, N. Mizushima and D. Kwiatkowski for ULK1, Atg5 and TSC2 MEFs; A. Lange, T. Neufeld and Kim lab members for comments on manuscript. This study was supported by Minnesota Medical Foundation, Grant-In-Aid, Minnesota Obesity Center (3P30DK050456), American Diabetes Association (7-07-CD-08) and NIH (T32AG029796, DK072004 and DK083474).
Disclosure of Potential Conflicts of Interest
No potential conflicts of interest were disclosed.
Supplementary Material
References
- 1.Lee SB, Kim S, Lee J, Park J, Lee G, Kim Y, et al. ATG1, an autophagy regulator, inhibits cell growth by negatively regulating S6 kinase. EMBO Rep. 2007;8:360–365. doi: 10.1038/sj.embor.7400917. [DOI] [PMC free article] [PubMed] [Google Scholar]
- 2.Scott RC, Juhasz G, Neufeld TP. Direct induction of autophagy by Atg1 inhibits cell growth and induces apoptotic cell death. Curr Biol. 2007;17:1–11. doi: 10.1016/j.cub.2006.10.053. [DOI] [PMC free article] [PubMed] [Google Scholar]
- 3.Jung CH, Jun CB, Ro SH, Kim YM, Otto NM, Cao J, et al. ULK-Atg13-FIP200 complexes mediate mTOR signaling to the autophagy machinery. Mol Biol Cell. 2009;20:1992–2003. doi: 10.1091/mbc.E08-12-1249. [DOI] [PMC free article] [PubMed] [Google Scholar]
- 4.Levine B, Klionsky DJ. Development by self-digestion: molecular mechanisms and biological functions of autophagy. Dev Cell. 2004;6:463–477. doi: 10.1016/S1534-5807(04)00099-1. [DOI] [PubMed] [Google Scholar]
- 5.Vellai T, Bicsak B, Toth ML, Takacs-Vellai K, Kovacs AL. Regulation of cell growth by autophagy. Autophagy. 2008;4:507–509. doi: 10.4161/auto.5670. [DOI] [PubMed] [Google Scholar]
- 6.Tsukamoto S, Kuma A, Mizushima N. The role of autophagy during the oocyte-to-embryo transition. Autophagy. 2008;4:1076–1078. doi: 10.4161/auto.7065. [DOI] [PubMed] [Google Scholar]
- 7.Neufeld TP, Baehrecke EH. Eating on the fly: function and regulation of autophagy during cell growth, survival and death in Drosophila. Autophagy. 2008;4:557–562. doi: 10.4161/auto.5782. [DOI] [PMC free article] [PubMed] [Google Scholar]
- 8.Mizushima N. Autophagy: process and function. Genes Dev. 2007;21:2861–2873. doi: 10.1101/gad.1599207. [DOI] [PubMed] [Google Scholar]
- 9.Yang Z, Klionsky DJ. Mammalian autophagy: core molecular machinery and signaling regulation. Curr Opin Cell Biol. 2010;22:124–131. doi: 10.1016/j.ceb.2009.11.014. [DOI] [PMC free article] [PubMed] [Google Scholar]
- 10.He C, Klionsky DJ. Regulation mechanisms and signaling pathways of autophagy. Annu Rev Genet. 2009;43:67–93. doi: 10.1146/annurev-genet-102808-114910. [DOI] [PMC free article] [PubMed] [Google Scholar]
- 11.Jung CH, Ro SH, Cao J, Otto NM, Kim DH. mTOR regulation of autophagy. FEBS Lett. 2010;584:1287–1295. doi: 10.1016/j.febslet.2010.01.017. [DOI] [PMC free article] [PubMed] [Google Scholar]
- 12.Chang YY, Neufeld TP. An Atg1/Atg13 complex with multiple roles in TOR-mediated autophagy regulation. Mol Biol Cell. 2009;20:2004–2014. doi: 10.1091/mbc.E08-12-1250. [DOI] [PMC free article] [PubMed] [Google Scholar]
- 13.Ganley IG, Lam du H, Wang J, Ding X, Chen S, Jiang X. ULK1.ATG13.FIP200 complex mediates mTOR signaling and is essential for autophagy. J Biol Chem. 2009;284:12297–12305. doi: 10.1074/jbc.M900573200. [DOI] [PMC free article] [PubMed] [Google Scholar]
- 14.Hosokawa N, Hara T, Kaizuka T, Kishi C, Takamura A, Miura Y, et al. Nutrient-dependent mTORC1 association with the ULK1-Atg13-FIP200 complex required for autophagy. Mol Biol Cell. 2009;20:1981–1991. doi: 10.1091/mbc.E08-12-1248. [DOI] [PMC free article] [PubMed] [Google Scholar]
- 15.Mizushima N. The role of the Atg1/ULK1 complex in autophagy regulation. Curr Opin Cell Biol. 2010;22:132–139. doi: 10.1016/j.ceb.2009.12.004. [DOI] [PubMed] [Google Scholar]
- 16.Kim J, Kundu M, Viollet B, Guan KL. AMPK and mTOR regulate autophagy through direct phosphorylation of Ulk1. Nat Cell Biol. 2011;13:132–141. doi: 10.1038/ncb2152. [DOI] [PMC free article] [PubMed] [Google Scholar]
- 17.Kundu M, Lindsten T, Yang CY, Wu J, Zhao F, Zhang J, et al. Ulk1 plays a critical role in the autophagic clearance of mitochondria and ribosomes during reticulocyte maturation. Blood. 2008;112:1493–1502. doi: 10.1182/blood2008-02-137398. [DOI] [PMC free article] [PubMed] [Google Scholar]
- 18.Egan DF, Shackelford DB, Mihaylova MM, Gelino S, Kohnz RA, Mair W, et al. Phosphorylation of ULK1 (hATG1) by AMP-activated protein kinase connects energy sensing to mitophagy. Science. 2011;331:456–461. doi: 10.1126/science.1196371. [DOI] [PMC free article] [PubMed] [Google Scholar]
- 19.Hara T, Takamura A, Kishi C, Iemura S, Natsume T, Guan JL, et al. FIP200, a ULK-interacting protein, is required for autophagosome formation in mammalian cells. J Cell Biol. 2008;181:497–510. doi: 10.1083/jcb.200712064. [DOI] [PMC free article] [PubMed] [Google Scholar]
- 20.Chan EY, Longatti A, McKnight NC, Tooze SA. Kinase-inactivated ULK proteins inhibit autophagy via their conserved C-terminal domains using an Atg13independent mechanism. Mol Cell Biol. 2009;29:157–171. doi: 10.1128/MCB.01082-08. [DOI] [PMC free article] [PubMed] [Google Scholar]
- 21.Itakura E, Mizushima N. Characterization of autophagosome formation site by a hierarchical analysis of mammalian Atg proteins. Autophagy. 2010;6:764–776. doi: 10.4161/auto.6.6.12709. [DOI] [PMC free article] [PubMed] [Google Scholar]
- 22.Mercer CA, Kaliappan A, Dennis PB. A novel, human Atg13 binding protein, Atg101, interacts with ULK1 and is essential for macroautophagy. Autophagy. 2009;5:649–662. doi: 10.4161/auto.5.5.8249. [DOI] [PubMed] [Google Scholar]
- 23.Hosokawa N, Sasaki T, Iemura S, Natsume T, Hara T, Mizushima N. Atg101, a novel mammalian autophagy protein interacting with Atg13. Autophagy. 2009;5:973–979. doi: 10.4161/auto.5.7.9296. [DOI] [PubMed] [Google Scholar]
- 24.Lee JW, Park S, Takahashi Y, Wang HG. The association of AMPK with ULK1 regulates autophagy. PLoS ONE. 2010;5:15394. doi: 10.1371/journal.pone.0015394. [DOI] [PMC free article] [PubMed] [Google Scholar]
- 25.Aladzsity I, Toth ML, Sigmond T, Szabo E, Bicsak B, Barna J, et al. Autophagy genes unc-51 and bec-1 are required for normal cell size in Caenorhabditis elegans. Genetics. 2007;177:655–660. doi: 10.1534/genetics.107.075762. [DOI] [PMC free article] [PubMed] [Google Scholar]
- 26.Tremblay F, Brule S, Hee Um S, Li Y, Masuda K, Roden M, et al. Identification of IRS-1 Ser-1101 as a target of S6K1 in nutrient- and obesity-induced insulin resistance. Proc Natl Acad Sci USA. 2007;104:14056–14061. doi: 10.1073/pnas.0706517104. [DOI] [PMC free article] [PubMed] [Google Scholar]
- 27.Tzatsos A, Kandror KV. Nutrients suppress phosphatidylinositol-3-kinase/Akt signaling via raptor-dependent mTOR-mediated insulin receptor substrate 1 phosphorylation. Mol Cell Biol. 2006;26:63–76. doi: 10.1128/MCB.26.1.63-76.2006. [DOI] [PMC free article] [PubMed] [Google Scholar]
- 28.Zhang J, Gao Z, Yin J, Quon MJ, Ye J. S6K directly phosphorylates IRS-1 on Ser-270 to promote insulin resistance in response to TNF(alpha) signaling through IKK2. J Biol Chem. 2008;283:35375–35382. doi: 10.1074/jbc.M806480200. [DOI] [PMC free article] [PubMed] [Google Scholar]
- 29.Dowling RJ, Topisirovic I, Alain T, Bidinosti M, Fonseca BD, Petroulakis E, et al. mTORC1-mediated cell proliferation, but not cell growth, controlled by the 4E-BPs. Science. 2010;328:1172–1176. doi: 10.1126/science.1187532. [DOI] [PMC free article] [PubMed] [Google Scholar]
- 30.Schmelzle T, Hall MN. TOR, a central controller of cell growth. Cell. 2000;103:253–262. doi: 10.1016/S0092-8674(00)00117-3. [DOI] [PubMed] [Google Scholar]
- 31.Inoki K, Li Y, Zhu T, Wu J, Guan KL. TSC2 is phosphorylated and inhibited by Akt and suppresses mTOR signalling. Nat Cell Biol. 2002;4:648–657. doi: 10.1038/ncb839. [DOI] [PubMed] [Google Scholar]
- 32.Manning BD, Tee AR, Logsdon MN, Blenis J, Cantley LC. Identification of the tuberous sclerosis complex-2 tumor suppressor gene product tuberin as a target of the phosphoinositide-3-kinase/akt pathway. Mol Cell. 2002;10:151–162. doi: 10.1016/S1097-2765(02)00568-3. [DOI] [PubMed] [Google Scholar]
- 33.Zhang Y, Gao X, Saucedo LJ, Ru B, Edgar BA, Pan D. Rheb is a direct target of the tuberous sclerosis tumour suppressor proteins. Nat Cell Biol. 2003;5:578–581. doi: 10.1038/ncb999. [DOI] [PubMed] [Google Scholar]
- 34.Kim DH, Sarbassov DD, Ali SM, King JE, Latek RR, Erdjument-Bromage H, et al. mTOR interacts with raptor to form a nutrient-sensitive complex that signals to the cell growth machinery. Cell. 2002;110:163–175. doi: 10.1016/S00928674(02)00808-5. [DOI] [PubMed] [Google Scholar]
- 35.Vander Haar E, Lee SI, Bandhakavi S, Griffin TJ, Kim DH. Insulin signalling to mTOR mediated by the Akt/PKB substrate PRAS40. Nat Cell Biol. 2007;9:316–323. doi: 10.1038/ncb1547. [DOI] [PubMed] [Google Scholar]
- 36.Gwinn DM, Shackelford DB, Egan DF, Mihaylova MM, Mery A, Vasquez DS, et al. AMPK phosphorylation of raptor mediates a metabolic checkpoint. Mol Cell. 2008;30:214–226. doi: 10.1016/j.molcel.2008.03.003. [DOI] [PMC free article] [PubMed] [Google Scholar]
- 37.Carrière A, Cargnello M, Julien LA, Gao H, Bonneil E, Thibault P, et al. Oncogenic MAPK signaling stimulates mTORC1 activity by promoting RSK-mediated raptor phosphorylation. Curr Biol. 2008;18:1269–1277. doi: 10.1016/j.cub.2008.07.078. [DOI] [PubMed] [Google Scholar]
- 38.Foster KG, Acosta-Jaquez HA, Romeo Y, Ekim B, Soliman GA, Carriere A, et al. Regulation of mTOR complex 1 (mTORC1) by raptor Ser863 and multisite phosphorylation. J Biol Chem. 2010;285:80–94. doi: 10.1074/jbc.M109.029637. [DOI] [PMC free article] [PubMed] [Google Scholar]
- 39.Carriere A, Romeo Y, Acosta-Jaquez HA, Moreau J, Bonneil E, Thibault P, et al. ERK1/2 phosphorylate Raptor to promote Ras-dependent activation of mTOR complex 1 (mTORC1) J Biol Chem. 2011;286:567–577. doi: 10.1074/jbc.M110.159046. [DOI] [PMC free article] [PubMed] [Google Scholar]
- 40.Gwinn DM, Asara JM, Shaw RJ. Raptor is phosphorylated by cdc2 during mitosis. PLoS ONE. 2010;5:9197. doi: 10.1371/journal.pone.0009197. [DOI] [PMC free article] [PubMed] [Google Scholar]
- 41.Dunlop EA, Hunt DK, Acosta-Jaquez HA, Fingar DC, Tee AR. ULK1 inhibits mTORC1 signaling, promotes multisite Raptor phosphorylation and hinders substrate binding. Autophagy. 2011;7:737–747. doi: 10.4161/auto.7.7.15491. [DOI] [PMC free article] [PubMed] [Google Scholar]
- 42.Woo SY, Kim DH, Jun CB, Kim YM, Haar EV, Lee SI, et al. PRR5, a novel component of mTOR complex 2, regulates platelet-derived growth factor receptor beta expression and signaling. J Biol Chem. 2007;282:25604–25612. doi: 10.1074/jbc.M704343200. [DOI] [PubMed] [Google Scholar]
Associated Data
This section collects any data citations, data availability statements, or supplementary materials included in this article.