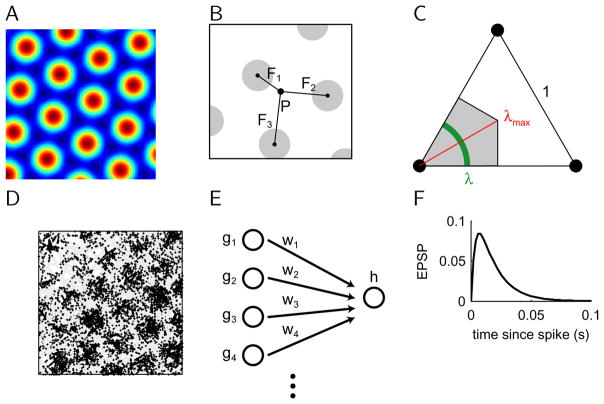
Figure 1. Definition of models and normalized offset.
A, Schematic of grid cell firing rate map. As in all firing rate and activation maps in this paper, red indicates maximum, while blue denotes zero. B, The normalized offset is defined as the shortest distance between the reference point P and the locations of the firing field peaks Fk, divided by the grid spacing. Grey disks mark regions of elevated firing rate. C, Schematic of key properties of normalized offset. For any point P within the equilateral triangle, those located within the grey-shaded area are closest to the vertex on the left. The normalized offsets with respect to all points in the green-shaded section are the same λ. The red line shows the maximum normalized offset that can occur in 2-d . D, Example of grid cell spiking. Shown is a 10min session of random exploration. The simulated trajectory of the virtual animal is shown in grey. Each spike is marked by a black dot at the animal’s location when the spike occurred. E, Feedforward network architecture used in this study. The hippocampal cell receives the weighted sum of grid cell inputs. F, Time course of evoked post-synaptic potential.

