Abstract
This method provides a simple extraction procedure, as well as a validated, sensitive, and specific liquid chromatography-tandem mass spectrometry assay for the simultaneous quantification of ampicillin, piperacillin, tazobactam, meropenem, acyclovir, and metronidazole in human plasma. The method was validated over concentration ranges specific for each compound, with a lower limit of quantification of 50–300 ng/mL and a sample volume of 50 μL. The method is accurate and precise, with within- and between-day accuracy ranging from 85–110% and 92–110%, respectively, and within- and between-day precision of 89–111% and 91–109%, respectively. Simplicity, low plasma volume, and high throughput make this method suitable for clinical pharmacokinetic studies in premature infants.
Keywords: prematurity, neonates, antibiotics, antivirals, HPLC, mass spectrometry
1. Introduction
Infections in premature infants (<37 weeks gestation at birth) are common and fatal [1, 2]; approximately 20% of very-low-birth-weight (<1500 g) infants suffer from culture-proven sepsis, and 10–20% die [1, 2]. To prevent these devastating consequences, more than 90% of infants born <33 weeks gestational age and admitted to the nursery are treated with multiple antimicrobial agents [3]. In spite of the widespread use of antimicrobials in this population, pharmacokinetic (PK) studies in premature infants are exceptionally scarce. This is due, in part, to limitations inherent to trials involving premature infants, including limited blood volume necessary to conduct PK studies and lack of availability of sensitive and specific drug concentration assays.
Over the last two decades, advances in technology have provided tools to measure drug concentration in biological matrices accurately, selectively, and with increased sensitivity. Optimized methods using high-performance liquid chromatography (HPLC) and the incorporation of mass spectrometry (MS) have resulted in the ability to measure drug concentrations in low (<100 uL) plasma volume. In addition, given the ability of these instruments to separate compounds efficiently, it is now possible to measure several compounds in the same sample simultaneously [4]. This methodology has been successful in several settings, including measurement of antiretroviral drugs from different drug classes [5] and simultaneous measurements of antimicrobials [6, 7]. In premature infants, the multiplex-assay approach is attractive because these patients are often treated with several antimicrobials concomitantly. More importantly, in the setting of clinical trials where each infant receives a different antimicrobial agent, a single multiplex assay increases trial efficiency by measuring drug concentrations of all agents without the need to develop and validate multiple individual assays specific for each drug. Therefore, the purpose of this work was to develop and validate a LC-MS/MS multiplex drug concentration assay for commonly used antimicrobials in premature infants, including ampicillin, piperacillin, tazobactam, meropenem, acyclovir, and metronidazole.
2. Experimental
2.1. Chemicals and reagents
Ampicillin, piperacillin, acyclovir, metronidazole, and dicloxacillin (internal standard [IS]) were purchased from the Sigma Chemical Company (St. Louis, MO, USA). Tazobactam and meropenem were purchased from the U.S. Pharmacopeia (Rockville, MD, USA). HPLC-grade chemicals were purchased from Fisher Scientific (Norcross, GA, USA). Purified compressed nitrogen was obtained from Airgas-National Welders (Charlotte, NC, USA). Drug-free pooled plasma was obtained from Biological Specialty Corporation (Colmar, PA, USA). Plasma obtained from whole blood anticoagulated with potassium tri-phosphate EDTA was obtained from Biological Specialty Corporation.
2.2. Equipment
Compounds were analyzed with a triple quadrupole mass spectrometer API 4000 (Applied Biosystems–ABSciex, Foster City, CA, USA). A Shimadzu solvent delivery system (Columbia, MD, USA), LEAP HTC PAL thermostatted autosampler (Carrboro, NC, USA), Valco switching valve (Houston, TX, USA), and Analyst Software version 1.4.1 (Applied Biosystems–ABSciex, Foster City, CA, USA) run on a Dell desktop computer (operated by Windows XP professional) were used for this method.
2.3. Preparation of standards
Individual clear stock solutions of ampicillin, piperacillin, tazobactam, meropenem, acyclovir, and metronidazole were prepared at the following concentrations: ampicillin, piperacillin, and tazobactam 15 mg/mL, meropenem and acyclovir 5 mg/mL, and metronidazole 2.5 mg/mL. Each analyte was accurately weighed and dissolved in dimethyl sulfoxide (DMSO) according to Table 1.
Table 1. Individual stock solutions.
| Compound | Desired concentration (mg/mL) | Amount (mg)a | Diluent amount (DMSO) (mL) |
|---|---|---|---|
| Ampicillin | 15 | 16.0 | 1 |
| Piperacillin | 15 | 15.7 | 1 |
| Tazobactam | 15 | 16.2 | 1 |
| Meropenem | 5 | 5.8 | 1 |
| Acyclovir | 5 | 5.0 | 1 |
| Metronidazole | 2.5 | 2.5 | 1 |
Corrected for salt weight where applicable. DMSO=dimethyl sulfoxide.
The master stock solution was prepared as a composite of all six compounds (0.5 mL each), adjusted to a final concentration of 1,500,000 ng/mL for ampicillin, piperacillin, and tazobactam; 500,000 ng/mL for meropenem and acyclovir; and 250,000 ng/mL for metronidazole, by 2.0 mL of DMSO. This master stock standard was used to prepare seven intermediate composite stock solutions: ampicillin and piperacillin (1,500,000; 750,000; 300,000; 150,000; 30,000; 15,000; and 3,000 ng/mL); tazobactam (750,000; 300,000; 150,000; 30,000; 15,000; 3,000; and 1,500 ng/mL); meropenem and acyclovir (500,000; 250,000; 100,000; 50,000; 10,000; 5,000; and 1,000 ng/mL); and metronidazole (250,000; 125,000; 50,000; 25,000; 5,000; 2,500; and 500 ng/mL) in DMSO.
Plasma working calibration solutions at 150,000, 75,000, 30,000, 15,000, 3,000, 1,500, and 300 ng/mL for ampicillin and piperacillin; 75,000, 30,000, 15,000, 3,000, 1,500, 300, and 150 ng/mL for tazobactam; 50,000, 25,000, 10,000, 5,000, 1,000, 500, and 100 ng/mL for meropenem and acyclovir; and 25,000, 12,500, 5,000, 2,500, 500, 250, and 50 ng/mL for metronidazole were prepared by diluting the intermediate solutions in human drug-free plasma in a ratio of 1:9.
From the master and intermediate stock solutions, quality control (QC) intermediate stock solutions were prepared in DMSO at concentrations of 9,000, 600,000, and 1,200,000 ng/mL ampicillin and piperacillin; 4,500, 180,000, and 600,000 ng/mL for tazobactam; 3,000, 200,000, and 400,000 ng/mL for meropenem and acyclovir; and 1,500, 100,000, and 200,000 ng/mL for metronidazole. Plasma working QC samples of 900, 60,000, and 120,000 ng/mL for ampicillin and piperacillin; 450, 18,000, and 60,000 ng/mL for tazobactam; 300, 20,000, and 40,000 ng/mL for meropenem and acyclovir; and 150, 10,000, and 20,000 ng/mL for metronidazole were prepared by diluting the QC intermediate solutions in human drug-free plasma in a ratio of 1:9.
2.4. Internal standard preparation
Dicloxacillin (1 mg) was weighed and dissolved in DMSO to achieve a final concentration of 1.0 mg/mL (stock solution). The internal standard working solution was prepared by diluting 0.3 mL of this solution in 99.7 mL of acetonitrile to achieve a final concentration of 3,000 ng/mL.
2.5. Samples and pre-treatment
This method was used to measure antimicrobial concentrations in clinical samples collected from premature infants at pre-specified time points or scavenged from the clinical laboratory after processing for clinical care. Sample collection (∼200–1000 μL, heparinized or ethylenediaminetetraacetic acid [EDTA] tubes) occurred under an investigational protocol approved by the institutional review board at participating sites and after informed consent was obtained from caregivers of study participants. Blood samples at pre-specified time points were collected and kept on ice after collection for a maximum of 15 minutes. Blood plasma was separated by centrifugation for 10 minutes. Plasma samples were transferred to a −80° C temperature-monitored freezer for storage until analysis. Prior to extraction, all plasma samples were brought to room temperature and then gently mixed.
2.6. The extraction procedure
On the day of analysis, 200 μL of chilled (left in the refrigerator for 20 minutes) internal standard was placed into a 2.0 mL labeled conical plastic Eppendorf tube, followed by 45 μL of plasma and 5 μL of DMSO (for blank and patient samples) or by 50 μL of spiked plasma (for calibrators and QC samples). The DMSO was added to the blank and patient samples to compensate for the DMSO added to the plasma working calibration solutions. The solutions were vortex-mixed for 15 minutes and centrifuged at 15,600 g at 4° C for 10 minutes. The supernatant portion was transferred into a 96-insert holder with 0.7 mL glass inserts (Q Glass, NJ, USA). The inserts on the holder were tightly sealed with a silicone 96-insert cover.
2.7. LC-MS/MS analysis
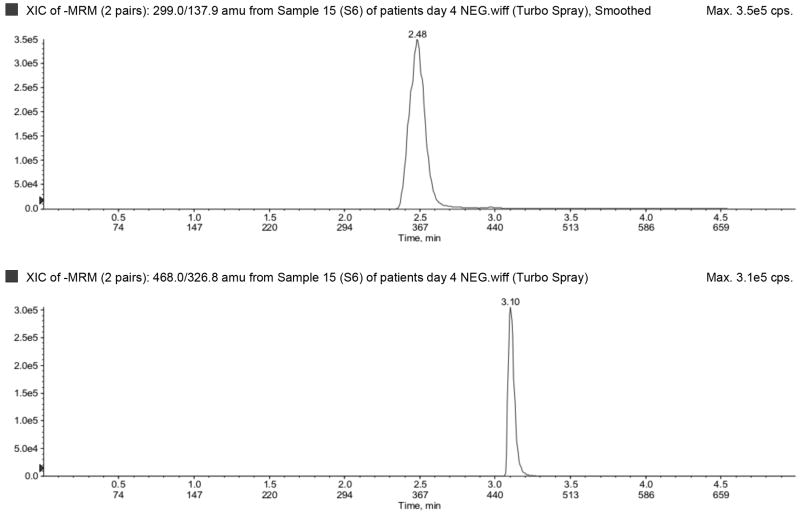
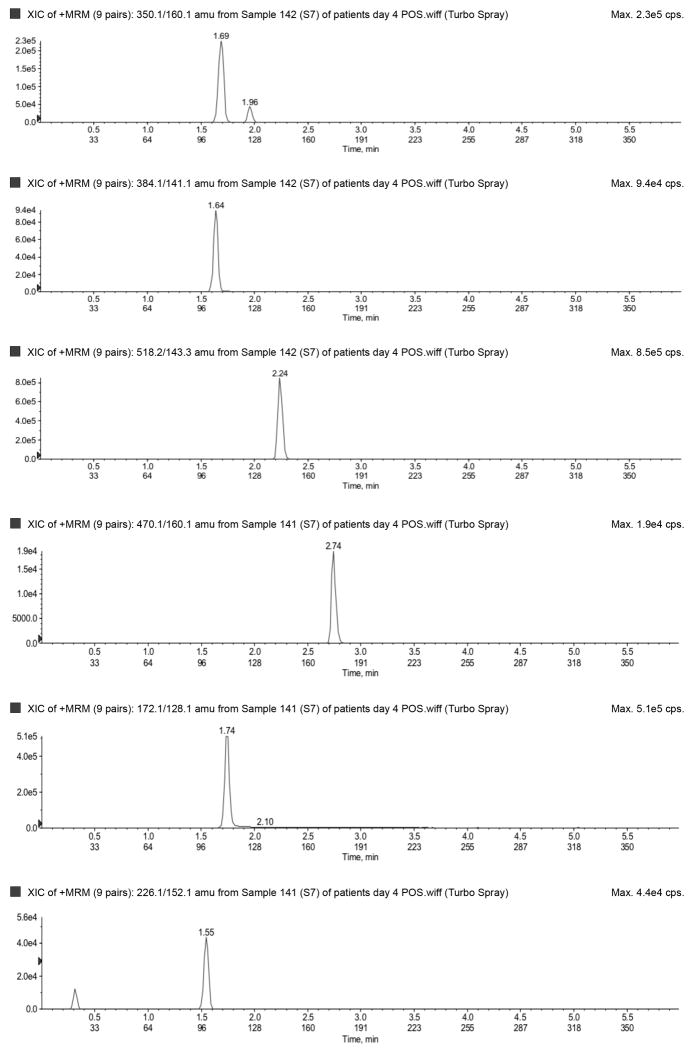
Ampicillin, piperacillin, acyclovir, meropenem, and metronidazole were analyzed in positive mode. Tazobactam was analyzed in negative mode during a separate injection run from the same glass insert. Dicloxicillin was used as internal standard for both positive and negative analyses. The injection volume was 4 μL.
Chromatography was achieved by using a reverse-phase C18 Aquasil column (50 × 2.1-mm internal diameter, 5 μm particle size; Thermo Fisher, Waltham, MA, USA) with a flow rate of 0.75 ml/min for analysis in positive mode and a C18 Ultra Aqueous column (50 × 2.1-mm internal diameter, 3 μm particle size; Restek, Bellefonte, PA, USA) with a flow rate of 0.35 ml/min for analysis in negative mode. In both analyses, mobile phase A consisted of 0.1% formic acid in water, and mobile phase B consisted of 0.1% formic acid in methanol. The chromatographic separation of analytes was performed with gradient elution of increasing mobile phase B (0% hold until 0.7 minutes, 0–15% from 0.7–1 minute, 15–100% from 1–4 minutes, 100% hold from 4–4.5 minutes, 0% from 4.5–6 minutes for positive mode; 0% hold until 0.7 minutes, 0–100% from 0.7–2.5 minutes, 100% hold from 2.5–3.5 minutes, 0% from 3.5–5 minutes for negative mode). Flow was diverted to waste for the first 0.7 minutes and after 4 minutes. Total run time was 6 and 5 minutes for positive and negative mode, respectively.
MS/MS analysis was performed on a triple quadrupole mass spectrometer API 4000 (Applied Biosystems–ABSciex, Foster City, CA, USA) operated with electrospray ionization (TurboV source using the electrospray probe). Ionspray voltage and turbo heater temperature were kept at 2500 V (-2000 V for tazobactam) and 500° C, respectively. Compound-specific instrument parameters were optimized for each transition (Table 2) to obtain the most robust signal.
Table 2. Optimal precursor and product ions and instrument parameters by compound.
| Molecular weight (g/mol) | Ionization mode | Precursor ion | Product ion | Collision gas | Collision energy (eV) | |
|---|---|---|---|---|---|---|
| Ampicillin | 349.40 | Positive | 350.1 | 160.1 | 10 | 20 |
| Piperacillin | 517.55 | Positive | 518.2 | 143.2 | 10 | 25 |
| Tazobactam | 300.29 | Negative | 299.0 | 137.9 | 10 | -20 |
| Meropenem | 383.46 | Positive | 384.1 | 141.1 | 10 | 25 |
| Acyclovir | 225.20 | Positive | 226.1 | 152.1 | 10 | 18 |
| Metronidazole | 171.153 | Positive | 172.1 | 128.1 | 10 | 20 |
| Dicloxacillin (IS) | 470.32 | Positive | 470.1 | 160.1 | 10 | 20 |
| Dicloxacillin (IS) | 470.32 | Negative | 468.0 | 326.8 | 10 | -20 |
IS=internal standard.
2.8. Linearity, limit of quantification, and limit of detection
Linearity was assessed using five calibration curves analyzed on separate days. For validation, each point on the calibration curve was run in duplicate (two separate extractions), and the curves were constructed by calculating the peak area ratios of each compound to the internal standard and plotting these against the nominal concentration of the sample. Back-calculated calibration concentrations were determined using several models. The calibration curve with the best accuracy and precision throughout the curve range was considered the best fit. Quadratic regression of the ratio of compound to internal standard concentration (x) versus peak area ratio of compound to internal standard (y) using a 1/(x) weighting scheme was used for calculations because it provided the best fit to the data.
The upper limit of quantification (ULOQ) was defined as the highest standard concentration for which both the relative standard deviation and the percent deviation from the nominal concentration were less than 15% [8]. The lower limit of quantification (LLOQ) was defined as the lowest concentration for which both the relative standard deviation and the percent deviation from the nominal concentration were less than 20%. The detection limit was defined as signal to noise ratio of 3:1.
2.9. Matrix effects
Seven different lots from two separate plasma matrices (two lots sodium heparin and five lots potassium tri-phosphate EDTA) were spiked in triplicate, extracted, and analyzed as separate samples. The following compound concentrations were tested: 18,000 ng/mL for ampicillin, piperacillin, and tazobactam; 6,000 ng/mL for meropenem and acyclovir; and 3,000 ng/mL for metronidazole. Calculated concentrations for each extracted lot were compared to theoretical concentrations. In addition, the method's specificity was tested by screening the seven different human blank plasma lots for drugs and internal standard.
2.10. Accuracy, precision, and recovery (extraction efficiency)
Accuracy and precision of the analytical method was quantified using four concentrations of QC samples (including LLOQ) run six times (six separate extractions) in sequence on five different days (total of 30 replicates for each concentration). In addition, accuracy and precision of diluted samples were determined. Dilutions (1:1, 1:3, and 1:9 ratios) of a highly concentrated solution (300,000 ng/mL for ampicillin, piperacillin, and tazobactam; 100,000 ng/mL for meropenem and acyclovir; and 50,000 ng/mL for metronidazole) were performed with human plasma. The calculated concentrations were compared to the nominal concentrations.
Recovery (extraction efficiency) of the six compounds was determined with QC samples (all three QC concentration levels) by dividing the peak area of the extracted spiked plasma samples with the peak area of a spiked blank plasma extract.
2.11. Stability
To test stability, samples were left at room temperature for 24 hours prior to extraction. Stability during sample handling was also verified by subjecting samples to either three freeze-thaw cycles or storage for 24 hours in the refrigerator at 4° C prior to extraction. QC samples at the three concentrations were used for this purpose. Also, stability in the autosampler for 24 hours was tested. One-month stability was tested by storing aliquots of QC samples for one month in the -80° C freezer.
3. Results
3.1. Linearity
The calibration curve was calculated using peak area ratio values at seven standard concentrations. A quadratic regression provided the best fit to the data. The data for the calibration curves (n=5) are shown in Table 3, along with the mean ± standard deviation of five standard curve quadratic coefficients, slopes, intercepts, and correlation coefficients (r2). The regression coefficient (r2) for all calibration curves was greater than 0.9965. Due to day-to-day variations in the coefficients of the quadratic equation, standards and QCs should be generated for each day of analysis.
Table 3. Summary of standard curve, retention times, and extraction efficiency.
| Compound | Range ng/mL | r2 | Quadratic coefficient | SD | Slope | SD | Intercept | SD | Retention time min | Extraction efficiency % | Mean deviation % |
|---|---|---|---|---|---|---|---|---|---|---|---|
| Ampicillin | 300–150,000 | 0.9981 | -1.6842E-10 | 1.9132E-10 | 2.3660E-04 | 7.4519E-05 | -5.4400E-02 | 1.7704E-02 | 1.76 | 97.33 | 0.10 |
| Piperacillin | 300–150,000 | 0.9984 | -1.3646E-09 | 5.2397E-10 | 7.2780E-04 | 1.9669E-04 | -8.1600E-02 | 1.5208E-02 | 2.32 | 97.66 | 0.03 |
| Tazobactam | 150–75,000 | 0.9986 | -4.3600E-10 | 5.4385E-11 | 1.5160E-04 | 2.0748E-05 | -4.1740E-04 | 2.5241E-03 | 2.61 | 94.66 | 0.20 |
| Meropenem | 100–50,000 | 0.9974 | -4.8644E-11 | 1.4345E-10 | 1.7510E-04 | 5.3558E-05 | -3.0180E-02 | 8.3174E-03 | 1.72 | 77.33 | 0.70 |
| Acyclovir | 100–50,000 | 0.9966 | -5.4780E-10 | 2.7185E-10 | 3.3120E-04 | 5.7160E-05 | -1.8948E-02 | 1.4136E-02 | 1.59 | 83.00 | 1.40 |
| Metronidazole | 50–25,000 | 0.9972 | -1.5890E-09 | 2.3465E-09 | 6.9140E-04 | 6.6114E-04 | -1.4320E-02 | 1.7062E-02 | 1.77 | 97.66 | 0.10 |
| Dicloxacillin(IS) | 2.82 | 92.24 |
IS=internal standard; SD=standard deviation.
3.2. Matrix effect
The percent difference from theoretical concentrations for all analytes was less than 15%, except for acyclovir (21% difference, lot #1) and meropenem (26% difference, lot #3) (Table 4). Therefore, the extraction method was suitable for all analytes spiked in these matrices, except for the lots mentioned above. In addition, no response in MS/MS channels used for monitoring both drugs and internal standards was observed in any of the seven human plasma lots.
Table 4. Matrix effects.
| Plasma matrix | |||||||
|---|---|---|---|---|---|---|---|
| K3 EDTA | K3 EDTA | K3 EDTA | K3 EDTA | K3 EDTA | Sodium heparin | Sodium heparin | |
| Lot # | 1 | 2 | 3 | 4 | 5 | 1 | 2 |
| Ampicillin | |||||||
| Mean concentration | 20,567 | 18,833 | 20,133 | 19,367 | 18,567 | 18,533 | 17,833 |
| (ng/mL) | |||||||
| % deviation | 14.26 | 4.63 | 11.85 | 7.59 | 3.15 | 2.96 | -0.93 |
|
| |||||||
| Piperacillin | |||||||
| Mean concentration | 18,733 | 17,667 | 18,333 | 17,733 | 19,567 | 17,633 | 17,467 |
| (ng/mL) | |||||||
| % deviation | 4.07 | -1.85 | 1.85 | -1.48 | 8.70 | -2.04 | -2.96 |
|
| |||||||
| Tazobactam | |||||||
| Mean concentration | 18,133 | 18,933 | 18,300 | 19,000 | 17,767 | 17,500 | 18,133 |
| (ng/mL) | |||||||
| % deviation | 0.74 | 5.19 | 1.67 | 5.56 | -1.30 | -2.78 | 0.74 |
|
| |||||||
| Meropenem | |||||||
| Mean concentration | 6,722 | 5,989 | 7,533 | 6,233 | 6,353 | 5,511 | 5,756 |
| (ng/mL) | |||||||
| % deviation | 12.04 | -0.19 | 25.56 | 3.89 | 5.89 | -8.15 | -4.07 |
|
| |||||||
| Acyclovir | |||||||
| Mean concentration | 7,289 | 6,089 | 6,756 | 6,189 | 6,927 | 6,444 | 6,056 |
| (ng/mL) | |||||||
| % deviation | 21.48 | 1.48 | 12.59 | 3.15 | 15.44 | 7.41 | 0.93 |
|
| |||||||
| Metronidazole | |||||||
| Mean concentration | 3,261 | 3,228 | 3,222 | 3,144 | 3,250 | 3,089 | 3,011 |
| (ng/mL) | |||||||
| % deviation | 8.70 | 7.59 | 7.41 | 4.81 | 8.33 | 2.96 | 0.37 |
K3 EDTA=potassium tri-phosphate ethylenediaminetetraacetic acid.
3.3. The limit of quantification
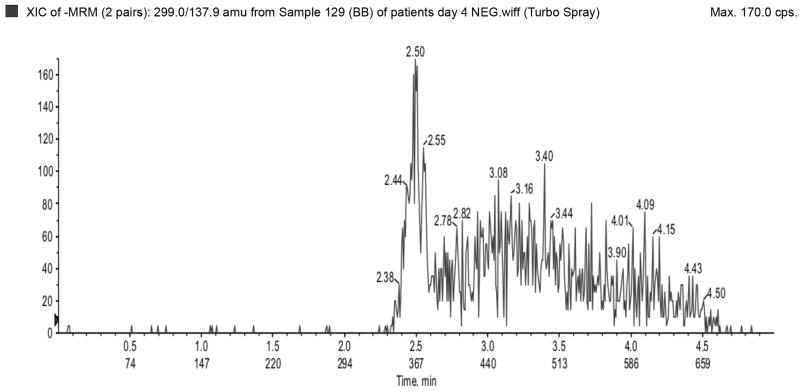
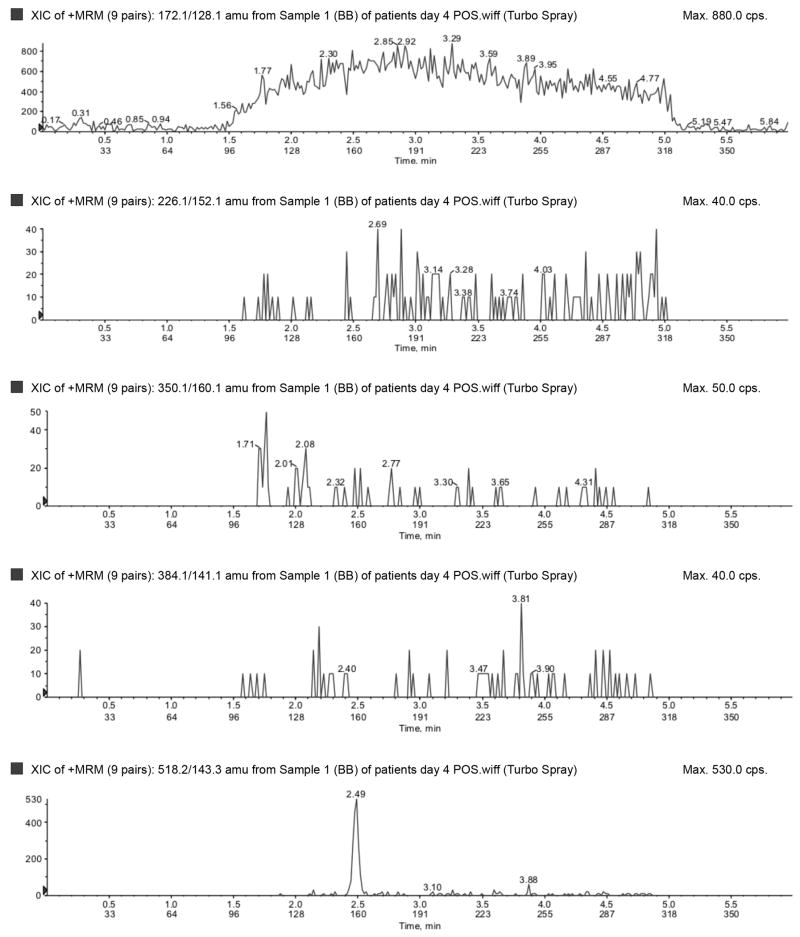
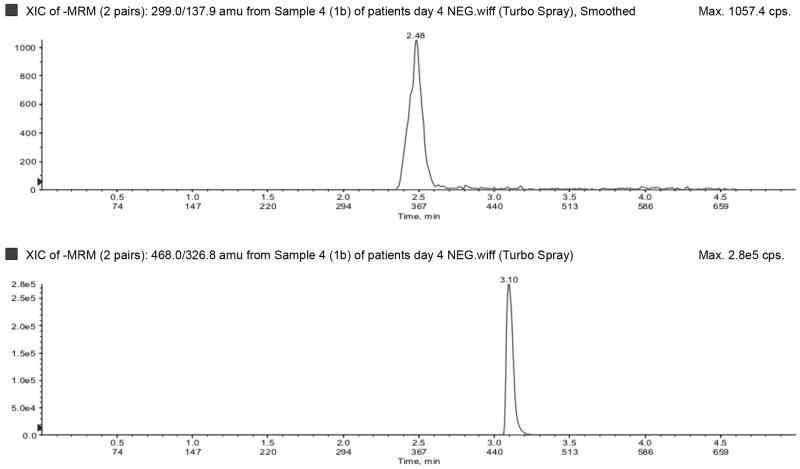
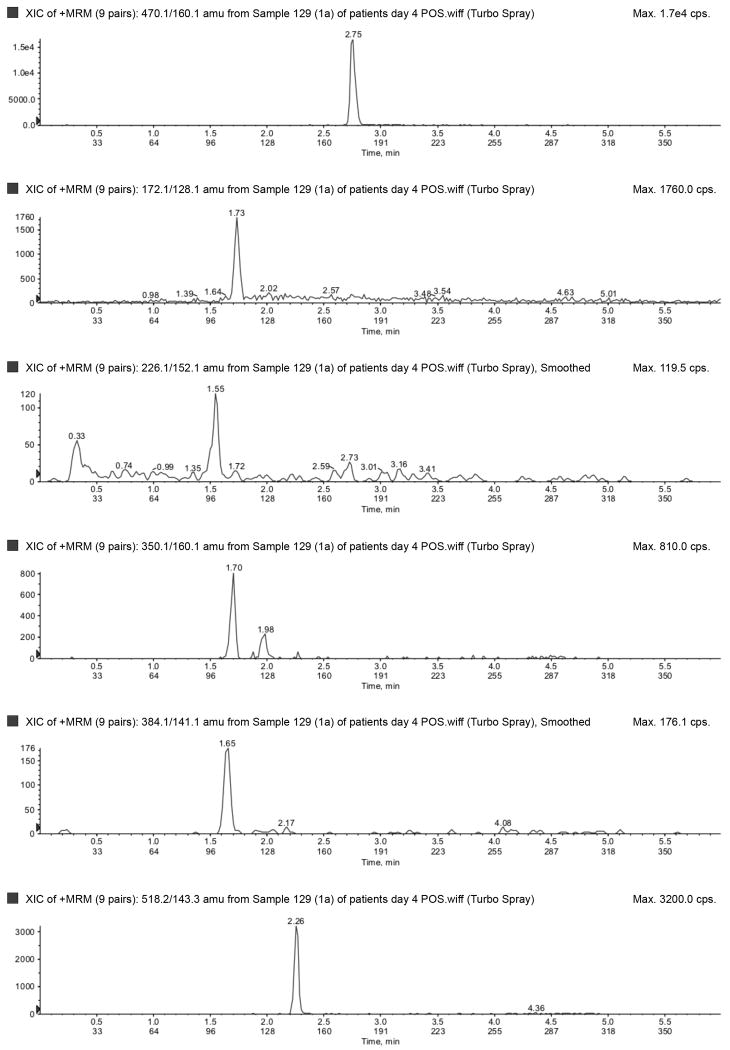
The LLOQ for ampicillin, piperacillin, tazobactam, metronidazole, meropenem, and acyclovir were 300, 300, 150, 50, 100, and 100 ng/mL, respectively, and the ULOQ for ampicillin, piperacillin, tazobactam, metronidazole, meropenem, and acyclovir were 150,000, 150,000, 75,000, 25,000, 50,000, and 50,000 ng/mL, respectively. Chromatograms of blank, LLOQ, and ULOQ samples are shown in Fig. 1 and Fig. 2
Fig. 1.
Blank plasma sample run in a) negative (tazobactam) and b) positive (top to bottom: metronidazole, acyclovir, ampicillin, meropenem, piperacillin) ionization mode.
Fig. 2.
Lower limit of quantification in a) negative (top to bottom: tazobactam and dicloxacillin [IS]) and b) positive (top to bottom: dicloxacillin [IS], metronidazole, acyclovir, ampicillin, meropenem, piperacillin) ionization mode. Upper limit of quantification in c) negative (top to bottom: tazobactam and dicloxacillin [IS]) and d) positive (top to bottom: dicloxacillin [IS], metronidazole, acyclovir, ampicillin, meropenem, piperacillin) ionization mode. IS=internal standard.
3.4. Accuracy, precision, and recovery
The results of the accuracy and precision experiments at four different quality control levels are shown in Table 5. Within-day accuracy of all analytes ranged from 85–110%, with a mean of 101%. Between-day accuracy of all analytes ranged from 92–110%, with a mean of 101%. Within- and between-day coefficient of variations varied from 2.1–11.4%, and 4.0–9.1%, respectively. Overall, results indicate that the method was accurate and precise for each compound. In addition, concentration measurements of partially diluted samples were accurate and precise across all dilution ratios. The greatest percent deviation for all diluted samples was 16.8% for metronidazole when diluted 1:9. The greatest % coefficient of variation for all the diluted samples was 14.1%. The absolute recovery of all compounds at all concentrations was greater than 75% (Table 3).
Table 5. Summary of accuracy and precision.
| Intra-assay | Inter-assay | ||||
|---|---|---|---|---|---|
| Compound | Concentration (ng/mL) | Accuracy (%) | CV (%) | Accuracy (%) | CV (%) |
| Ampicillin | 300 | 100.33 | 4.36 | 101.49 | 6.18 |
| 900 | 96.29 | 5.20 | 95.37 | 6.97 | |
| 60,000 | 107.01 | 2.85 | 106.62 | 3.98 | |
| 120,000 | 98.00 | 4.03 | 98.19 | 5.26 | |
|
| |||||
| Piperacillin | 300 | 107.69 | 2.99 | 107.94 | 6.35 |
| 900 | 99.00 | 5.43 | 99.54 | 6.49 | |
| 60,000 | 102.82 | 3.72 | 103.82 | 5.65 | |
| 120,000 | 100.64 | 7.04 | 101.25 | 8.20 | |
|
| |||||
| Tazobactam | 150 | 98.09 | 4.63 | 99.16 | 6.75 |
| 450 | 110.39 | 4.32 | 109.53 | 5.38 | |
| 18,000 | 104.24 | 2.63 | 104.54 | 5.42 | |
| 60,000 | 99.71 | 2.29 | 99.66 | 7.02 | |
|
| |||||
| Meropenem | 100 | 101.96 | 5.40 | 103.23 | 7.81 |
| 300 | 94.10 | 5.91 | 94.99 | 7.50 | |
| 20,000 | 107.59 | 3.22 | 107.63 | 4.22 | |
| 40,000 | 99.22 | 4.65 | 99.58 | 6.07 | |
|
| |||||
| Acyclovir | 100 | 100.78 | 5.73 | 100.31 | 9.06 |
| 300 | 92.17 | 5.51 | 92.43 | 7.96 | |
| 20,000 | 92.64 | 4.31 | 92.72 | 6.01 | |
| 40,000 | 92.03 | 6.88 | 93.44 | 8.50 | |
|
| |||||
| Metronidazole | 50 | 102.78 | 8.42 | 101.29 | 9.44 |
| 150 | 95.24 | 6.64 | 96.05 | 7.73 | |
| 10,000 | 106.31 | 4.03 | 107.10 | 6.11 | |
| 20,000 | 100.08 | 4.09 | 100.08 | 6.62 | |
|
| |||||
| Mean | 100.38 | 4.76 | 100.67 | 6.70 | |
CV=coefficient of variation.
3.5. Stability
Overall, each compound was stable under most tested conditions, with a few exceptions. After 24 hours at room temperature, all compound concentrations were within 15% of nominal, with the exception of tazobactam (82% of nominal), piperacillin (75%), and meropenem (84%). In three freeze-thaw cycles, on average all compound concentrations were within 10% of nominal. The low QC for ampicillin deviated 16% from nominal. All compounds were stable when left in the autosampler for 24 hours at 8° C (within 12% of nominal concentration)and all compounds were stable when left in the refrigerator (4° C) for 24 hours, being within 13% of the nominal concentration. In addition, after one month of storage at <70° C, all compounds were within 15% of controls.
3.6. Analysis of patient samples
We evaluated the applicability of the described method by analyzing sparse plasma samples collected from premature infants (<32 weeks gestational age at birth, N=8) given multiple intravenous doses of piperacillin-tazobactam (Table 6). Piperacillin and tazobactam were found in almost all patient samples. The mean (SD) estimated gestational age at birth, postnatal age, and birth weight was 25 (2.7) weeks, 7 (7) days, 728 (185) grams, respectively. The overall mean (SD) piperacillin concentration was 41,123 (53,789) ng/mL; the mean (SD) piperacillin concentration in infants < and ≥ 28 weeks postmenstrual age were 45,159 (58,686, n=6) and 24,310 (20,186, n=2) ng/mL, respectively. In addition to piperacillin and tazobactam, ampicillin was found in five patients, metronidazole in three patients, and acyclovir in one patient. Meropenem was not found in any of the samples. Dosing of these agents could be confirmed in 7/8 patients.
Table 6. Drug concentrations in patient samples.
| Subject ID | Sample no. | Piperacillin ng/mL | Tazobactam ng/mL | Ampicillin ng/mL | Meropenem ng/mL | Acyclovir ng/mL | Metronidazole ng/mL |
|---|---|---|---|---|---|---|---|
| 1 | 1 | 28200 | 1260 | 346 | BLD | BLD | BLD |
| 1 | 2 | 49850 | 2725 | BLD | BLD | BLD | BLD |
| 1 | 3 | 48000 | 2820 | 438 | BLD | BLD | BLD |
| 2 | 1 | 24300 | 2730 | BLD | BLD | BLD | BLD |
| 2 | 2 | 53400 | 6800 | BLQ | BLD | BLD | BLD |
| 3 | 1 | 42600 | 7290 | 55400 | BLD | BLD | BLD |
| 4 | 1 | 52000 | 16200 | 3330 | BLD | BLD | 13700 |
| 4 | 2 | 47300 | 11900 | 23100 | BLD | BLD | 21800 |
| 4 | 3 | BLD | BLD | BLQ | BLD | BLD | BLD |
| 4 | 4 | BLD | BLD | BLD | BLD | BLD | BLD |
| 4 | 5 | 32750 | 6450 | BLD | BLD | BLD | 7050 |
| 4 | 6 | 85600 | 15480 | 602 | BLD | BLD | 8000 |
| 4 | 7 | 37500 | 7720 | BLD | BLD | BLD | 1060 |
| 5 | 1 | 3640 | BLQ | BLQ | BLQ | BLD | BLD |
| 5 | 2 | 4920 | BLQ | BLQ | BLD | BLD | 352 |
| 5 | 3 | 17000 | 851 | BLQ | BLD | BLD | 87.3 |
| 6 | 1 | 78100 | 10300 | 374000 | BLD | BLD | BLD |
| 6 | 2 | 286000 | 19900 | 367000 | BLD | BLD | BLD |
| 6 | 3 | 64400 | 11400 | 532000 | BLQ | BLD | BLD |
| 7 | 1 | 69900 | 8760 | 145000 | BLD | BLD | BLD |
| 7 | 2 | 111000 | 10400 | 78800 | BLQ | BLD | BLD |
| 7 | 3 | 54400 | 6360 | 355000 | BLD | BLD | BLD |
| 7 | 4 | 20900 | 2450 | 88600 | BLD | BLD | BLD |
| 7 | 5 | 18100 | 2740 | 460000 | BLD | BLD | BLD |
| 7 | 6 | 11850 | BLD | 94000 | BLD | BLD | BLD |
| 7 | 7 | 6760 | 1250 | 427000 | BLD | BLD | BLD |
| 8 | 1 | 6990 | BLQ | BLD | BLD | 51800 | BLD |
| 8 | 2 | 1890 | BLD | BLD | BLD | 9140 | BLD |
| 8 | 3 | 1940 | BLD | BLD | BLD | 85300 | BLD |
| 8 | 4 | 1830 | BLD | BLD | BLD | 3610 | 1110 |
| 8 | 5 | 5760 | BLD | BLD | BLD | 21900 | BLD |
| 8 | 6 | 7490 | BLQ | BLD | BLD | 35500 | BLD |
| 8 | 7 | BLD | BLD | BLD | BLD | 10100 | BLD |
| 8 | 8 | BLQ | BLD | BLD | BLD | 3110 | BLD |
| 8 | 9 | BLQ | BLD | BLD | BLD | 1310 | 79.2 |
| 8 | 10 | 460 | BLD | BLD | BLD | 1200 | 91.4 |
BLD=below the level of detection; BLQ=below the level of quantification.
4. Discussion
The method described in this report measures drug concentration of six antimicrobials accurately and precisely in micro-volumes (50 μL) of plasma. Previous investigators have developed analytical methods to measure drug concentrations of antimicrobials in low plasma volumes; however, most involve antimicrobials of the same drug class and no antivirals [4]. The ability to simultaneously measure drug concentrations of antimicrobials from different classes, including antivirals, is an important milestone in evaluating drug disposition in premature infants. The latter is often challenging due to blood volume limitations in this population; therefore, drug concentration information obtained from each sample should be maximized. This can be accomplished with this assay as premature infants are often treated with several antimicrobials simultaneously. The latter is evidenced in the patient samples tested, as acyclovir and metronidazole were found in some of the infants treated with piperacillin-tazobactam. A high degree of variability and a trend towards decreasing piperacillin concentrations was observed with increasing postmenstrual age. Even though it is not possible to perform formal statistical inferences to assess significance of piperacillin concentration differences between postmenstrual age groups, it is likely that these differences result from maturational changes characteristic of the developing infant. These developmental changes are often related to improvement in renal function that leads to increased piperacillin clearance. This observation has been demonstrated in previous studies evaluating the PK of piperacillin in more mature premature infants [9]. A formal population PK analysis is underway to quantify and identify sources of variability in piperacillin concentrations in this population.
In addition to the advantages offered by micro-volumes and multiplex methodologies in premature infant studies, dried blood spot (DBS) sampling is becoming an attractive technology for use in this population. This technology requires minimum amounts of whole blood per sample (<30 μL), virtually no sample processing, and convenient room temperature storage. Even though several bioanalytical assays have been developed using DBS technology, only one clinical study has evaluated the use of DBS in premature infants [10]. The utility of this technology across therapeutics in this population remains to be determined.
The extraction process (protein precipitation) used for this method has been previously described for beta-lactam antibiotics [4]. In the present method, this simple and straightforward extraction process provided excellent recovery (>90%) for most compounds. It is possible that the compounds with the lowest extraction efficiency (77–83%), meropenem and acyclovir, remained trapped in the protein precipitate or did not completely dissolve into the organic phase. In spite of this limitation, the extraction procedure used in this method provides a high level of efficiency in sample preparation, as well as high throughput processing of patient samples.
Although clinical plasma samples >50 μL from premature infants can be obtained, it is not without difficulty. This assay was designed to use sample volumes as low as 5 μL, which holds a number of advantages. Samples requiring repeat analysis can be diluted (1:1, 1:3, or 1:9) with blank plasma and extracted. This is particularly advantageous for concentrations >ULOQ that need to be diluted back into the curve. Samples known to contain beta-lactams (tazobactam, piperacillin, meropenem) should be handled carefully given the lack of stability of these compounds at room temperature. Freeze-thaw cycles, however, did not affect the stability of any of the compounds, which allows for retesting of samples if needed.
5. Conclusion
We successfully developed a method to simultaneously assay ampicillin, piperacillin, tazobactam, meropenem, acyclovir, and metronidazole in human plasma. The assay has been validated with respect to accuracy, precision, limit of detection, recovery, and stability (except as noted). The assay has been successfully applied to clinical samples from premature infants. This method has many clinical applications within the field of pediatrics, as it is simple, highly sensitive and specific, and requires an micro-volumes of sample.
Highlights.
We describe a method that provides a simple extraction procedure, as well as a validated, sensitive, and specific liquid chromatography-tandem mass spectrometry assay for the simultaneous quantification of ampicillin, piperacillin, tazobactam, meropenem, acyclovir, and metronidazole in human plasma.
The ability to simultaneously measure drug concentrations of antimicrobials from different classes, including antivirals, is an important milestone in evaluating drug disposition in premature infants. The latter is often challenging due to blood volume limitations in this population, therefore, drug concentration information obtained from each sample should be maximized.
This can be accomplished with this assay as premature infants are often treated with several antimicrobials simultaneously.
Acknowledgments
The authors received funding from the following: Michael Cohen-Wolkowiez receives support from NICHD 1K23HD064814-01, and from the non-profit organization Thrasher Research Foundation.
Nicole R. White receives support from the U.S. government for work in clinical pharmacology (P30AI37260).
Arlene Bridges receives support from the U.S. government for her work in developing analytical methods for novel nanoparticle based therapies (1-54-CA151652-01, Carolina Center of Cancer Nanotechnology Excellence, DeSimone, PI).
Daniel K. Benjamin Jr. receives support from the U.S. government for his work in pediatric and neonatal clinical pharmacology (1R01HD057956-02, 1R01FD003519-01, 1U10-HD45962-06, 1K24HD058735-01, and Government Contract HHSN267200700051C), the nonprofit organization Thrasher Research Foundation for his work in neonatal candidiasis, and from industry for neonatal and pediatric drug development (http://www.dcri.duke.edu/research/coi.jsp).
Angela D. M. Kashuba receives support from the U.S. government for work in clinical pharmacology (R34AI087065, P30AI37260), from industry for clinical pharmacology (Pfizer, Gilead, Abbott, Tibotec, and Merck), and from the North Carolina Translational and Clinical Sciences Institute.
Footnotes
No funding body participated in the study design; collection, analysis, and interpretation of data; writing of the report; or the decision to submit the manuscript for publication.
Publisher's Disclaimer: This is a PDF file of an unedited manuscript that has been accepted for publication. As a service to our customers we are providing this early version of the manuscript. The manuscript will undergo copyediting, typesetting, and review of the resulting proof before it is published in its final citable form. Please note that during the production process errors may be discovered which could affect the content, and all legal disclaimers that apply to the journal pertain.
References
- 1.Stoll BJ, Hansen N, Fanaroff AA, Wright LL, Carlo WA, Ehrenkranz RA, Lemons JA, Donovan EF, Stark AR, Tyson JE, Oh W, Bauer CR, Korones SB, Shankaran S, Laptook AR, Stevenson DK, Papile LA, Poole WK. Pediatrics. 2002;110:285–291. doi: 10.1542/peds.110.2.285. [DOI] [PubMed] [Google Scholar]
- 2.Stoll BJ, Hansen NI, Higgins RD, Fanaroff AA, Duara S, Goldberg R, Laptook A, Walsh M, Oh W, Hale E. Pediatr Infect Dis J. 2005;24:635–639. doi: 10.1097/01.inf.0000168749.82105.64. [DOI] [PubMed] [Google Scholar]
- 3.Clark RH, Bloom BT, Spitzer AR, Gerstmann DR. Pediatrics. 2006;117:1979–1987. doi: 10.1542/peds.2005-1707. [DOI] [PubMed] [Google Scholar]
- 4.Ahsman MJ, Wildschut ED, Tibboel D, Mathot RA. Antimicrob Agents Chemother. 2009;53:75–80. doi: 10.1128/AAC.00636-08. [DOI] [PMC free article] [PubMed] [Google Scholar]
- 5.Jung BH, Rezk NL, Bridges AS, Corbett AH, Kashuba AD. Biomed Chromatogr. 2007;21:1095–1104. doi: 10.1002/bmc.865. [DOI] [PubMed] [Google Scholar]
- 6.Denooz R, Charlier C, Chromatogr J, Analyt B. Technol Biomed Life Sci. 2008;864:161–167. doi: 10.1016/j.jchromb.2008.01.037. [DOI] [PubMed] [Google Scholar]
- 7.Holt DE, de Louvois J, Hurley R, Harvey D, Antimicrob J. Chemother. 1990;26:107–115. doi: 10.1093/jac/26.1.107. [DOI] [PubMed] [Google Scholar]
- 8.Shah VP, Midha KK, Findlay JW, Hill HM, Hulse JD, McGilveray IJ, McKay G, Miller KJ, Patnaik RN, Powell ML, Tonelli A, Viswanathan CT, Yacobi A. Pharm Res. 2000;17:1551–1557. doi: 10.1023/a:1007669411738. [DOI] [PubMed] [Google Scholar]
- 9.Kacet N, Roussel-Delvallez M, Gremillet C, Dubos JP, Storme L, Lequien P. Pediatr Infect Dis J. 1992;11:365–369. doi: 10.1097/00006454-199205000-00005. [DOI] [PubMed] [Google Scholar]
- 10.Suyagh M, Collier PS, Millership JS, Iheagwaram G, Millar M, Halliday HL, McElnay JC. Pediatrics. 2011;127:e367–e374. doi: 10.1542/peds.2010-0807. [DOI] [PubMed] [Google Scholar]


