

Abstract
microRNAs (miRNAs) are a large family of approximately 22-nucleotide-long RNAs that regulate gene expression. They are first transcribed as long, primary transcripts, which then undergo a series of processing steps to generate the single-stranded, mature miRNAs. Here, we showed that Drosha cleaved hundreds of human primary miRNA transcript substrates with different efficiencies in vitro. The differential Drosha susceptibility of the primary miRNA transcripts significantly correlated with the expression of the corresponding, mature miRNAs in vivo. Conserved miRNAs were more efficiently expressed in vivo, and their primary transcripts were also better Drosha substrates in vitro. Combining secondary structure prediction and statistical analyses, we identified features in human primary miRNA transcripts that predisposed miRNAs to efficient Drosha processing in vitro as well as to better expression in vivo. We propose that the selectivity of Drosha action contributes greatly to the specificity and efficiency of miRNA biogenesis. Moreover, this study serves as an example of substrate specificity of a biochemical reaction regulating gene expression at a global scale in vivo.
Keywords: miRNA, pri-miRNA processing, Drosha, miRNA expression, RNA secondary structure
1. Introduction
miRNAs are a class of non-coding RNAs that regulate target gene expression and control a wide range of biological processes [1]. They are ~ 22 nucleotide (nt) long and embedded within one arm of a hairpin structured transcript, with rare exceptions [2, 3]. This feature enables the prediction and classification of miRNAs [4]. Significant gaps, however, remain in our understanding of miRNA biogenesis, and our ability to correctly predict or identify miRNAs is limited. Many miRNA mining algorithms predict miRNA genes to number up to hundreds of thousands in complex genomes [e.g., 5-7], notably more than the miRNAs currently deposited in the miRBase [8]. This is not surprising, because relatively little is known about the determinants of genuine miRNA transcripts, while the genomes conceivably encode tens of millions of hairpin RNA elements. Indeed, more and more candidate miRNAs are being identified by deep sequencing. Nonetheless, it has also been reported that merely several hundred miRNA genes are expressed in mammals, many of them only rarely [9, 10].
A miRNA is first transcribed as part of a long primary transcript, or pri-miRNA [11]. The pri-miRNA is cleaved by an RNase called Drosha, complexed with its regulatory subunit DGCR8 in mammals, to liberate a hairpin precursor, or pre-miRNA, of ~ 60-70 nt [12-16]. The pre-miRNA is then exported to the cytoplasm by Exportin5 [17-19] and digested by the RNase Dicer to produce an ~ 22 basepair miRNA duplex intermediate [20-23]. An Argonaute protein binds to the duplex and finally selects the mature, single-stranded miRNA. A small minority of miRNAs can be generated independent of Drosha or Dicer [24-28]. Given such a huge pool of potential pri-miRNAs but apparently only a tiny fraction producing detectable, mature miRNAs, we hypothesized that, in addition to the obvious regulation at the transcriptional level, the miRNA processing machinery can also distinguish whether a potential RNA is a good substrate or a poor one; i.e., miRNA processing intrinsically serves a checkpoint or regulatory function. Indeed, a recent paper suggested that processing can severely limit RNA expression from a library of 20,000 short hairpin RNAs [29]. Our current work investigated the function of the Drosha/DGCR8 holoenzyme, or Drosha in short hereafter, because it initiates the irreversible miRNA processing and conceivably determines both how fast a pre-miRNA is produced and the fate of its substrates, as Drosha cleavage products ultimately undergo additional processing or degradation. We asked these questions: at the global scale, how is miRNA expression regulated? If mammals really encode hundred of thousands of miRNA genes, why aren’t many produced at a significant level? And lastly, can we identify the structural features that distinguish miRNA transcripts from other RNAs and that determine the efficiency of miRNA processing and expression in vivo?
2. Materials and Methods
2.1. Drosha cleavage assay
DNA templates for RNA synthesis were generated by PCR with a primer containing the T7 promoter sequence, using human genomic DNA (Clontech) as template. The pri-miRNA substrates were prepared by in vitro transcription (Promega) in the presence of [α-32P] CTP. The RNAs contained the pre-miRNA moiety flanked by ~ 25 nt extra sequences at both sides, for we and others had demonstrated that such pri-miRNAs contained all the essential elements for Drosha cleavage in vitro [30, 31]. We also tested a number of pri-miRNAs with 50-200 nt flanking regions and got similar results (data not shown). Size markers ϕX174 DNA/HinfI (Promega) were labeled at their 5’-ends with [γ-32P] ATP by T4 polynucleotide kinase (New England BioLabs). Drosha holoenzyme was prepared, used at ~ 1 ng/μl, mixed with approximately equal amount of radioactive RNA substrates, and incubated at 37°C for 45-60 min [32]. End-point analysis was performed not only because of the sheer number of the pri-miRNA substrates but also because we had found that both time-course and end-point experiments yielded the same conclusions [32; data not shown]. Because we used Spearman rank correlation analysis (see section 2.5 below), the rank of the cleavage efficiencies is more important than the actual values, which also was easier to satisfy by end-point studies. After gel electrophoresis, data were analyzed using a PhosphorImager. Cleavage efficiency was calculated as the intensities of predicted products (the ~ 60-70 nt pre-miRNA and the ~ 25 nt flanking RNA) divided by the intensities of the products and the remaining, full-length pri-miRNA. The pri-let-7a substrate was included in every experiment so that processing efficiencies of all the other pri-miRNAs could be compared to that of pri-let-7a, which was set as 100. Pri-let-7a was not necessarily cleaved at the same rate in every assay due to experimental variations, e.g., probes were prepared and used on different days, reaction volume might not be exactly the same each time, and different activities of Drosha might be added due to pipetting or different batches of enzyme preparations. Nevertheless, pri-let-7a was chosen as the control because it was one of the most efficiently cut RNA in every experiment (so that one could make sure that the assay worked), and other pri-miRNAs, tested on different days, gave similar, relative efficiencies when normalized to pri-let-7a.
2.2. Cell culture and transfection
293T cells were maintained at 37°C and 5% CO2 in Dulbecco’s modified Eagle’s medium with 10% fetal bovine serum. Plasmids that overexpress human miRNAs were constructed by amplifying typically 500 bp DNA from human genomic DNA and inserting it after a cytomegalovirus promoter [33]. Equal amounts of different plasmids were transfected individually into 293T cells using Lipofectamine 2000 (Invitrogen). Total RNA was isolated using Trizol reagent (Invitrogen).
2.3. Northern blotting
Northern blot analysis was performed as described [33]. Sequences of the oligonucleotide probes are: for miR-7 detection, 5’-ACAACAAAATCACTAGTCTTCCA-3’; miR-105, 5’-ACCACAGGAGTCTGAGCATTTGA-3’; miR-125b, 5’-TCACAAGTTAGGGTCTCAGGGA-3’; miR-504, 5’-GATAGAGTGCAGACCAGGGTCT-3’; miR-634, 5’-GTCCAAAGTTGGGGTGCTGGTT-3’; miR-765, 5’-GCATCACCTTCCTTCTCCTCCA-3’; and U6 snRNA control: 5’-ACGAATTTGCGTGTCATCCTTGCG-3’. Results were analyzed by autoradiography or using a Storm 840 PhosphorImager (GE Healthcare).
2.4. Real-time PCR
Total RNAs were first polyadenylated and then reverse transcribed with an oligo(dT)-linker primer using the miScript system (Qiagen), and cDNA amplified by PCR in 40 cycles of 95°C 10 sec, 60°C 45 sec, on a Stratagene Mx3005P machine. U6 served as the internal control.
2.5. Statistics and secondary structure prediction
GraphPad Prism 5.0 (GraphPad Software) and SPSS 13.0 (IBM) were used for Spearman rank correlation and Mann-Whitney U tests (two-tailed). The p-value of Spearman rank correlation was calculated with a permutation test. miRNA genomic sequence, miRNA family, species conservation, and cluster information was retrieved from miRBase. The expression data of a miRNA were calculated by adding the sequence reads for the miRNA and its miRNA* from all the tissues and cell lines [9, 10]. The combination of a wide variety of tissues and cell lines conceivably, partially reduced cell-specific effects due to, e.g., differential gene transcription and the expression of proteins that regulate the processing of specific miRNAs [11, 34]. For secondary structure prediction, the actual pri-miRNA substrates (listed in Supplementary Table S2) were folded using Mfold version 3.2, under the default condition of 37°C and 1 M NaCl [35, 36]. For all the other pri-miRNAs, their folding used 5’ and 3’, 25-nt-long extensions beyond the pre-miRNA moiety. For the multiple genes that produce the same miRNA, e.g., let-7a-1, let-7a-2, and let-7a-3, only one (let-7a-1) was used for prediction and correlation. ΔG of the terminal loop region was calculated from the pri-miRNA structural prediction. The terminal loop region starts from the first nucleotide after the 3’ end of the actual or predicted miRNA or miRNA* at the 5’ arm of the hairpin and ends at its corresponding nucleotide at the 3’ arm. For ΔG of the miRNA duplex region, a pre-miRNA was folded using Mfold, and its ΔG subtracted by that of the terminal loop region. ΔG for the proximal and distal domains of the pre-miRNA-flanking region was analogously computed. The proximal domain contains 12 nt extensions beyond the 5’ and 3’ ends of a pre-miRNA. Typically the most stable conformations were analyzed. Exceptions were allowed to ensure that the predicted miRNA duplex moiety formed usually 2 nt, but at least 1 nt 3’ overhangs within a pri-miRNA. There are inherent heterogeneities in the 5’ and 3’ ends of mature miRNAs, and the secondary structure predictions can only be estimates. For secondary structure prediction shown in Figure 5B, pri-miRNAs (listed in Supplementary Table S2) containing a larger distal domain were folded using Mfold, and the numbers of base pairs within the 12-nt-long, D1, F1, F2, F3, and F4 segments were divided by 12 to obtain the basepairing ratios.
Figure 5.
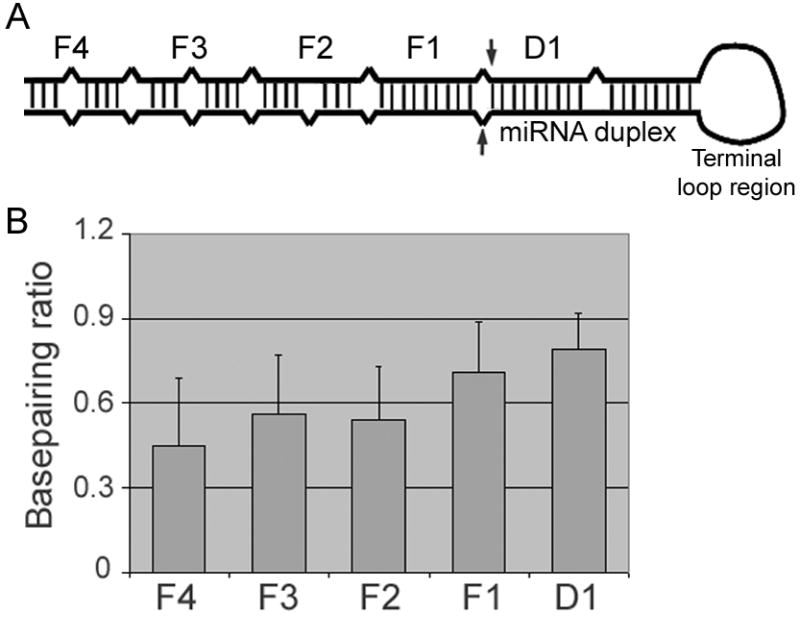
Secondary structure of pri-miRNAs. (A) Schematics of a pri-miRNA. Arrows point to the boundaries of a pre-miRNA, i.e., Drosha cleavage sites. Part of the hairpin is arbitrarily divided into 12-nt-long segments: D1, F1, F2, F3, and F4. For example, D1 and F1 each contains two 12-nt-long, partially complementary sequences (5’ and 3’ arms of the hairpin) separated by the Drosha cleavage sites. D1 belongs to the miRNA duplex moiety, the F1 segment corresponds to the proximal domain in the text, while F2 (and F3, F4) the distal domain. (B) The basepairing ratios for the D1, F1, F2, F3, and F4 segments (averages and standard deviations). The F2 segment has a lower basepairing ratio than F1, with a p-value of 2.0 × 10⁻¹⁹ (Mann-Whitney U test).
3. Results
3.1. Human pri-miRNAs are processed with different efficiencies by Drosha in vitro
The processing of only a handful of pri-miRNAs by Drosha had been dissected [e.g., 12, 15, 30, 31, 33]. Here, we decided to take an unbiased, global approach. There were 740 human miRNA genes in the miRBase Release 14 [8]. For the first 550 miRNA genes we chose a representative from every miRNA family, e.g., let-7a-1 (let-7a in short) from the let-7 family (Supplementary Table S1). For the remaining miRNAs we randomly selected only 12 for analysis because then-finished Drosha assays suggested that they might not be cleaved efficiently (Supplementary Table S1; see below). We also excluded well-known Drosha-independent miRNAs [24-26]. In vitro Drosha processing assays were performed on the chosen pri-miRNAs (see section 2.1 above). Excluding subjects that could not be amplified or produced RNA not suitable for our assays, we obtained reliable processing data for 247 pri-miRNAs (Supplementary Table S1). Results of three representative experiments performed on separate days are shown in Figure 1. We found that pri-miRNAs varied substantially in their intrinsic Drosha susceptibility in vitro. For example, pri-let-7a and pri-miR-125b were more efficiently processed than pri-miR-105 and pri-miR-504 to produce the pre-miRNAs and flanking segments, while others, such as pri-miR-604 and pri-miR-765, were cleaved extremely weakly or not at all.
Figure 1.

Drosha processing of select human pri-miRNAs in vitro. The names of the pri-miRNAs are indicated on top. “-”: no Drosha addition; “+”: with Drosha. Each box represents one experiment, with an internal pri-let-7a control. Certain miRNAs, such as pri-miR-604, are shown twice as an example of the reproducibility of the assay. Sizes of some of the DNA markers are indicated. Arrows point to representative pre-miRNA products. All data are summarized in Supplementary Table S1.
3.2. Pri-miRNA processing efficiency correlates with endogenous miRNA expression
The next question is: do differences in pri-miRNA cleavage in vitro translate to differences in miRNA maturation in vivo? To understand the biological significance of the observed Drosha’s substrate specificity, we compared relative pri-miRNA cleavage efficiencies to relative miRNA expression levels independently determined by Landgraf et al. [9] and Chiang et al. [10]. These two reports counted miRNA sequencing reads in a wide variety of human [9] and mouse [9, 10] tissues and cell lines, thus approximating cumulative miRNA levels in vivo (see section 2.5 above). For statistics we used Spearman rank correlation test, as the true variances and distributions are unknown, and one does not expect the relative cleavage efficiencies and miRNA sequence reads to have a linear relationship. Pri-miRNA cleavage significantly, positively correlate with total miRNA reads in both the human (Figure 2) and mouse sets of data (data not shown; Supplementary Table S2). The correlation coefficient translated to ~ 26% for the global contribution by Drosha specificity to differential, mature miRNA expression in vivo. The correlation was robust, as excluding “outliers”, i.e., miRNAs that were not cleaved and/or sequenced, did not alter our general conclusions (data not shown; Supplementary Table S2). If, instead of analyzing the cumulative miRNA expression in the combined samples, we compared the relative Drosha cleavage efficiencies to miRNA sequence reads in individual human or mouse tissues or cell lines [9, 10], positive correlation was still obtained, although with smaller correlation coefficients and bigger p values (data not shown). This result was expected, because tissue- or cell-specific transcription events and factors would then more prominently dominate gene expression and obscure the contribution from Drosha. Another complication is that some of the miRNAs could be generated independent of Drosha in vivo. But these miRNAs are rare and usually expressed scantly [24-26], so their existence does not invalidate the hypothesis that efficient Drosha processing improves endogenous miRNA expression.
Figure 2.
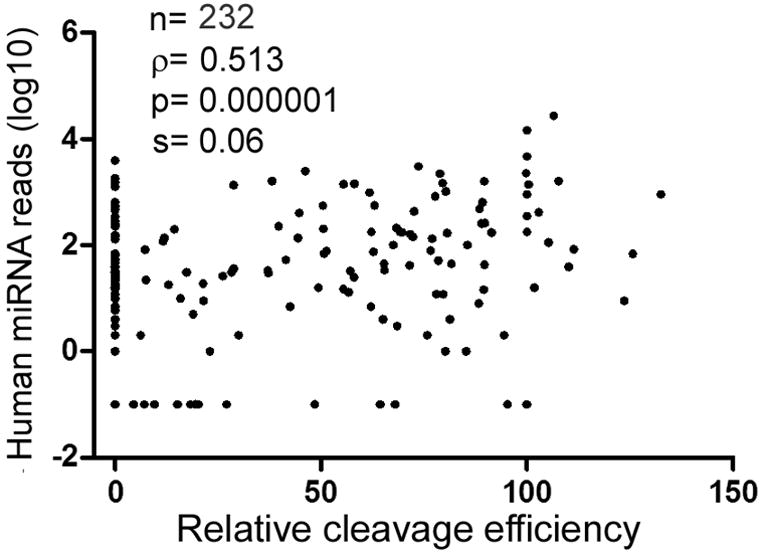
Pri-miRNA processing efficiency is a predictor of endogenous miRNA expression. Spearman rank correlation test was performed comparing relative Drosha cleavage efficiencies to published human miRNA expression data [9; see also Supplementary Table S2]. For those miRNAs with 0 sequence read, their copy number was designated as 0.1 for log10 conversion. Dots represent individual miRNAs. Sample size (n), correlation coefficient (ρ), p-value, and standard error (s) are indicated.
It is formally possible that miRNAs are discriminated by certain regulatory mechanisms, e.g., transcription, in a pattern similar to that by Drosha; i.e., all or most poor Drosha substrates might also be accidentally transcribed poorly in vivo. To further test the correlation between Drosha cleavage efficiencies and miRNA expression, we constructed expression plasmids with the same cytomegalovirus promoter transcribing six representative pri-miRNAs with varying degrees of Drosha preferences and endogenous mature miRNA expression levels: miR-7-2 and miR-125b, which were excellent Drosha substrates and well expressed in vivo, miR-105 and miR-504, relatively poor substrates and weak expressers, and miR-634 and miR-765, uncleavable by Drosha and hardly sequenced according to the literature, and transfected 293T cells. Northern blotting showed that the degree of miRNA overexpression largely matched Drosha cleavage efficiencies of the miRNAs, with mature miR-634 and miR-765 never detected (Figure 3A). Real-time PCR experiments yielded the same results (Supplementary Figure 1). In addition, we found that pri-miR-7-1 and pri-miR-7-2, which produced the identical mature miR-7, hence, likely with the same half-life, differed in their Drosha susceptibility (Figure 3B). Pri-miR-7-2 was naturally a better Drosha substrate and, when transiently expressed in 293T cells, generated mature miR-7 at a higher level than pri-miR-7-1 (Figure 3B). Lastly, we noted that Drosha did not cleave pri-miR-220a (Supplementary Table S2), whose mature miRNA was neither identified by sequencing [9, 10] nor overexpressed through transfection [10].
Figure 3.

Drosha cleavage underlies cellular miRNA expression. (A) Ectopic miRNA expression in 293T cells transfected with plasmids that encoded the indicated miRNAs was detected by Northern blot analysis. DNA markers are shown in the left. Lane 1: ~ 10 μg of total RNA from untransfected 293T cells; lane 2: RNA from transfected cells. Arrows point to mature miRNAs, and the ~ 60-70 nt signals in some of the lanes likely represented overproduced pre-miRNAs. Northern blotting of U6 snRNA was shown below as RNA loading controls. (B) Pri-miR-7-2 was a better Drosha substrate and produced more mature miR-7 upon transient transfection in 293T cells than pri-miR-7-1. Left panel: in vitro Drosha cleavage of pri-miR-7-1 and pri-miR-7-2. Positions of DNA markers are indicated, and the arrow points to pre-miRNA. Right panel: real-time PCR quantification of mature miR-7 overexpression in 293T cells transfected with a plasmid that encoded pri-miR-7-1 (as 100) or pri-miR-7-2. (C) Relationship between relative Drosha cleavage efficiencies and human miRNA sequence reads [9] in various miRNA clusters. Crosses represent individual miRNAs, which are indicated nearby. Lines denote miRNA pairs that were being compared.
Many human miRNA-encoding sequences are physically clustered in the genome and possibly transcribed as polycistronic pri-miRNAs. This feature presents the best opportunity to test the post-transcriptional regulation of miRNA expression in vivo. Interestingly, rarely were clustered miRNAs sequenced at similar numbers [e.g., 9, 10], suggesting that their expression is controlled significantly beyond transcription. To shed light on the mechanisms, we selected miRNA clusters so that, 1) sequence reads of miRNAs [9] can be assigned unequivocally to the miRNA genes we tested in our Drosha assays, 2) relative Drosha cleavage efficiencies of individual pri-miRNAs within a cluster differed by at least 15 percentage points, to ensure unequal Drosha susceptibility, and 3) miRNAs are at most 3 kb apart, to reduce the likelihood that certain clustered miRNAs are nevertheless generated from different pri-miRNAs. Relative Drosha cleavage efficiencies and miRNA sequence reads were then compared for nine miRNA pairs in the seven clusters that met these criteria. Eight out of the nine had a positive correlation (Figure 3C). The binomial probability for this observation is ~ 0.018 (n= 9, p= 1/2). Thus, intrinsic Drosha processing may underlie the differential expression of individual miRNAs within the same clusters.
3.3. Conserved pri-miRNAs are better substrates of Drosha
Pri-miRNA processing correlated positively with the number of gene family members of a miRNA and its conservation beyond primates, as indicated by the positive Spearman rank correlation coefficient and/or the respective p values (Figure 4A, B; Supplementary Table S3). Likewise, miRNA expression exhibited a positive association with miRNA conservation (Figure 4A, B; Supplementary Table S3). These results suggested that, interestingly and significantly, conserved miRNAs have evolved to be processed efficiently by Drosha, which would have facilitated their expression in vivo. Cleavage and expression, however, correlated negatively with the names of miRNAs, numbered according to the chronological order of their or paralogs’ discovery (Figure 4C). Why are the later annotated miRNAs always expressed at a lower level, as shown repeatedly by high-throughput sequencing? It is certainly possible that they are transcribed poorly or at a very restrictive manner, but our data suggested a third mechanism that Drosha’s substrate selectivity might limit the expression of some of these miRNAs as well. Some pri-miRNAs were not cleaved, and their mature miRNAs were sequenced at an extremely low number or not at all (Figures 2 and 4C; Supplementary Table S2). They are probably wrongly annotated miRNAs with expression blocked at the Drosha step. Indeed, the mammalian miR-220a entry was recently removed from the miRBase [8].
Figure 4.

Relationship between miRNA processing or expression and the conservation or the order of discovery of miRNAs. See Figure 2 for explanation of the symbols and Supplementary Table S3 for data. (A) Spearman rank correlation between the number of miRNA gene family members and relative Drosha cleavage efficiencies or human miRNA expression. (B) Relationship between miRNA conservation and relative Drosha cleavage efficiencies or human miRNA expression. Human miRNAs are divided into two categories, one present in only primates, and the other present in at least other mammals. Sample size, averages, standard deviations, and p-values are shown (Mann-Whitney U test). (C) Spearman rank correlation between the order of miRNA discovery and relative Drosha cleavage efficiencies or human miRNA expression.
3.4. Structural features underlie both the efficiencies of pri-miRNA processing in vitro and miRNA expression in vivo
What are the differences, then, among the human pri-miRNAs? Provided with a pri-miRNA sequence, can we predict whether it is a good Drosha substrate or expressed well in vivo? A pri-miRNA contains several motifs: a terminal loop, miRNA duplex, and the flanking region, further divided into the proximal and distal domains (see section 2.5 above; Figure 5A). Analysis of arbitrarily selected miRNAs showed that the proximal domain (corresponding to the F1 segment in Figure 5A) required a double-stranded feature, while the distal domain single-stranded RNA [12, 15, 30-33, 37]. An important role was further proposed for a flexible terminal loop [33, 37], although it was also argued that the loop region contributed little to processing [31]. Most critically, whether any of these structural features actually impacted endogenous miRNA expression had never been addressed. As these conclusions were drawn from examining only a small number of miRNAs, the present, comprehensive pri-miRNA processing study would permit a definitive evaluation of the above hypotheses. We predicted the secondary structures and Gibbs energy (ΔG) of the pri-miRNA substrates and sub-structures [35, 36] and then correlated the predictions to Drosha cleavage and to human miRNA expression.
Table 1 shows that, consistent with a stem requirement, ΔG of the proximal domain negatively associated with both Drosha cleavage and miRNA expression. Of note, we used two sets of human miRNAs for structure prediction and expression correlation studies (Table 1): one set contained only those pri-miRNAs that were tested in our Drosha assays (Supplementary Tables S2 and S4), while the other, larger set (Supplementary Table S5) included all the human miRNAs with positive or 0 sequence reads, according to Landgraf et al. [9]. Both sets of miRNAs gave similar results in terms of structure predictions (compare the medians, averages, and standard deviations in Supplementary Tables S4 and S5) and the correlation with miRNA expression (Table 1), demonstrating that the miRNAs we tested (Supplementary Table S2) accurately represented human miRNAs as a whole. We did not find as significant a role for the distal domain (Table 1), maybe because it readily adopts a relaxed conformation, with its median ΔG higher than that of the proximal domain (Supplementary Tables S4 and S5; also see Discussion). If we expanded the flanking region, i.e., the distal domain, and predicted its structure, the extra sequences and the original, distal domain had a similarly lower basepairing propensity than that of the proximal domain (Figure 5B). This result supported the hypothesis that Drosha processing requires single-stranded RNA extensions [30, 31] and indicated that overall, our designed pri-miRNAs faithfully reflect the endogenous pri-miRNAs. The predicted ΔG of the miRNA duplex moiety, pre-miRNA, or full-length pri-miRNA had relatively little influence over Drosha processing or expression (Table 1). Cleavage and expression, however, significantly and negatively correlated with the thermodynamics stability of the terminal loop region (Table 1). These analyses, therefore, demonstrated that a stem feature in the proximal domain and flexibility in the terminal loop region are critical determinants of both Drosha processing and mature miRNA production.
Table 1.
Correlation between predicted, pri-miRNA structures and Drosha cleavage or miRNA expression
| Structure (by ΔG, kcal/mol) | Cleavage efficiency | miRNA expression | miRNA expression (all) | ||||||
|---|---|---|---|---|---|---|---|---|---|
| n | ρ | p | n | ρ | p | n | ρ | p | |
| Proximal domain | 247 | -0.261 | 0.0001 | 232 | -0.352 | 0.000001 | 435 | -0.239 | 0.00003 |
| Distal domain | 246 | 0.118 | 0.066 | 231 | -0.001 | 0.89 | 434 | 0.053 | 0.27 |
| miRNA duplex | 246 | -0.039 | 0.54 | 231 | -0.123 | 0.062 | 434 | -0.119 | 0.013 |
| pre-miRNA | 247 | 0.111 | 0.081 | 232 | 0.049 | 0.46 | 435 | 0.010 | 0.84 |
| pri-miRNA | 246 | -0.051 | 0.42 | 231 | -0.175 | 0.008 | 434 | -0.148 | 0.002 |
| Terminal loop region | 246 | 0.253 | 0.0002 | 231 | 0.269 | 0.00004 | 434 | 0.192 | 0.0001 |
Sample size (n), Spearman’s correlation coefficient (ρ), and p-values are listed. For results of the secondary structure prediction, see Supplementary Tables S4 and 5. Sequence reads of those human miRNAs shown in Supplementary Table S2 as well as of all the human miRNAs [9] were both used for the correlation studies.
It was recently reported that A/U in position 13/14 and G in 20/21 facilitated the processing of a large library of small hairpin RNAs [29]. We did not find a significant correlation between these nucleotide preferences and Drosha cleavage or miRNA expression (data not shown). This may be because pri-miRNAs are structurally more heterogeneous, and our sample size is much smaller.
4. Discussion
Earlier work had examined the processing of only a handful of good Drosha substrates. While Drosha could conceivably discriminate against distinct pri-miRNAs, our study provided the first clear evidence for this selectivity. It further revealed a positive, global correlation between the intrinsic, Drosha substrate specificity and endogenous miRNA expression levels, which implies strong biological significance. Finding such a correlation itself is remarkable. Drosha cleavage efficiencies can only be approximated, for inside a cell pri-miRNAs are much longer and more sophisticated than any in vitro substrates one could ever design, and our analysis ignored the contribution to miRNA expression by differential transcription and processing of specific miRNAs [11, 34]. Other general miRNA processing factors such as Exportin5, Dicer, and Argonaute proteins also dictate miRNA biogenesis, so does miRNA stability. All these considerations likely account for the fact that certain miRNAs were processed very well by Drosha in vitro but hardly expressed in cells, or processed very poorly but highly expressed (Figure 2; Supplementary Table S2). On the other hand, because, presumably, the relationship between Drosha sensitivity and transcription or other regulatory factors is sufficiently random, examining hundreds of pri-miRNAs enabled us to access statistical significance and to gain the big picture of miRNA biogenesis. We note that we directed our analysis to an imaginary, “cumulative” in vivo system, but there is no reason why the conclusion does not apply to any actual, individual cell types.
That the later discovered miRNAs were more likely to be inefficiently processed and expressed (Figure 4C) suggests that miRNA discovery is approaching its limit. This result supports the notion that most mammalian miRNA genes have already been identified [10] and further provides mechanistic insights into why, of the hundreds of thousands of potential “miRNAs” [e.g., 5-7], only a subset are ever produced by cells. Even if a small RNA is made but with extreme rarity, one should carefully evaluate its functional relevance, as its host transcript might enter the miRNA pathway only fortuitously.
In conclusion, considering the well-established biochemical activity of Drosha, we suggest that the correlation represents strong evidence that Drosha action controls, to a significant extent, whether a transcript encodes a miRNA or not, and how efficiently a miRNA is produced in vivo. The selectivity of Drosha, therefore, ensures the specificity of miRNA biogenesis and, as a corollary, conceivably minimizes the cleavage and subsequent degradation of a vast number of irrelevant transcripts, an attribute essential in cells [38].
Structures of only a small number of human pri-miRNAs had previously been investigated for their roles in processing. Our current analysis showed, at a large scale, that a flexible terminal loop region and a stable proximal domain in a pri-miRNA predispose it to not only efficient Drosha cleavage in vitro but also efficient miRNA maturation in vivo (Table 1). While the correlation coefficients appear relatively small, there are extenuating circumstances. Firstly, the correlation is specific and consistent with results from earlier work analyzing select miRNAs. Secondly, pri-miRNAs are not just any random RNAs. They had undergone rigorous selections (e.g., cloning, folding analysis) before deposition to miRBase, which would have minimized the differences among the pri-miRNAs. Thus, our analyses were to reveal the remaining, small differences. This likely explains why we did not find a significant role for the miRNA duplex region or the distal domain (Table 1), even though both are important for miRNA maturation [30, 31, 37]. Thirdly, both our pri-miRNA cleavage and the published miRNA expression data can only approximate the in vivo situations. Lastly, one actually does not know how big the coefficients should be. There appears to be no precedents correlating any structure predictions to both in vitro and in vivo functions at a global scale. A recent bioinformatics study showed that the translation efficiency of thousands of mRNAs in bacteria and yeast is controlled by codon bias and folding energy, with correlation coefficients similar to those shown in Table 1 [39].
In a much broader sense, our study illustrates a rare example of a universally required factor in a biological process exerting both general and specific effects on the process. It results from the fact that Drosha has hundreds of genuine substrates but processes them with different efficiencies. A fundamental question in biological research is whether a biochemical activity, such as molecular interaction and enzymatic reaction, determined in vitro is physiologically relevant. The overall role of a protein or RNA can be studied using gain-of-function and loss-of-function strategies in cells. A more subtle issue, however, is whether the presumed specificity of a biochemical reaction has functional consequences. For example, transcription factors and protein kinases typically recognize degenerate sequences in hundreds of targets, but it remains unclear whether the substrate selectivity globally influences target mRNA expression levels or protein phosphorylation status in vivo. Additional questions could be: do the core transcription machinery and the core translation machinery possess specificity towards their tens of thousands of different targets in mammals? This issue is under-appreciated for many biomolecules. It is also under-studied, due, in part, to the technical challenge in quantifying target levels at a large scale, which are also always impacted by other contributing factors in vivo. Our work used miRNA processing as an example to demonstrate how the selectivity of a biochemical reaction regulates an in vivo process globally, and the same strategy can be applied to investigate analogous problems in other biological systems.
Supplementary Material
Highlights.
Human pri-miRNAs are processed by Drosha with different efficiencies in vitro.
Pri-miRNA processing efficiencies correlate with miRNA expression levels in vivo.
Conserved pri-miRNAs are better cleaved by Drosha.
Later-annotated miRNAs tend to be poorer Drosha substrates.
Structural features in pri-miRNAs predict Drosha processing and miRNA expression.
Acknowledgments
This work was supported in part by the Minnesota Medical Foundation (3674-9227-06, 3842-9201-08); U.S. Department of Defense (W81XWH-07-1-0183); and the National Institute of Drug Abuse (P50 DA 011806).
Abbreviations
- miRNA
microRNA
- pri-miRNA
primary microRNA transcript
Footnotes
Publisher's Disclaimer: This is a PDF file of an unedited manuscript that has been accepted for publication. As a service to our customers we are providing this early version of the manuscript. The manuscript will undergo copyediting, typesetting, and review of the resulting proof before it is published in its final citable form. Please note that during the production process errors may be discovered which could affect the content, and all legal disclaimers that apply to the journal pertain.
References
- 1.Ambros V. The functions of animal microRNAs. Nature. 2004;431:350–355. doi: 10.1038/nature02871. [DOI] [PubMed] [Google Scholar]
- 2.Cheloufi S, Dos Santos CO, Chong MMW, Hannon GJ. A dicer-independent miRNA biogenesis pathway that requires Ago catalysis. Nature. 2010;465:584–589. doi: 10.1038/nature09092. [DOI] [PMC free article] [PubMed] [Google Scholar]
- 3.Cifuentes D, Xue H, Taylor DW, Patnode H, Mishima Y, Cheloufi S, Ma E, Mane S, Hannon GJ, Lawson ND, Wolfe SA, Giraldez AJ. A novel miRNA processing pathway independent of Dicer requires Argonaute2 catalytic activity. Science. 2010;328:1694–1698. doi: 10.1126/science.1190809. [DOI] [PMC free article] [PubMed] [Google Scholar]
- 4.Berezikov E, Cuppen E, Plasterk RHA. Approaches to microRNA discovery. Nat Genetics. 2006;38:52–57. doi: 10.1038/ng1794. [DOI] [PubMed] [Google Scholar]
- 5.Miranda KC, Huynh T, Tay Y, Ang YS, Tam WL, Thomson AM, Lim B, Rigoutsos I. A pattern-based method for the identification of microRNA binding sites and their corresponding heteroduplexes. Cell. 2006;126:1203–1217. doi: 10.1016/j.cell.2006.07.031. [DOI] [PubMed] [Google Scholar]
- 6.Helvik SA, Snove O, Jr, Saetrom P. Reliable prediction of Drosha processing sites improves microRNA gene prediction. Bioinformatics. 2007;23:142–149. doi: 10.1093/bioinformatics/btl570. [DOI] [PubMed] [Google Scholar]
- 7.van der Burgt A, Fiers MW, Nap JP, van Ham RC. In silico miRNA prediction in metazoan genomes balancing between sensitivity and specificity. BMC Genomics. 2009;10:204. doi: 10.1186/1471-2164-10-204. [DOI] [PMC free article] [PubMed] [Google Scholar]
- 8.Griffiths-Jones S, Saini HK, van Dongen S, Enright AJ. miRBase tools for microRNA genomics. Nucl Acids Res. 2008;36:D154–D158. doi: 10.1093/nar/gkm952. [DOI] [PMC free article] [PubMed] [Google Scholar]
- 9.Landgraf P, Rusu M, Sheridan R, Sewer A, Iovino N, Aravin A, Pfeffer S, Rice A, Kamphorst AO, Landthaler M, Lin C, Socci ND, Hermida L, Fulci V, Chiaretti S, Foà R, Schliwka J, Fuchs U, Novosel A, Müller RU, Schermer B, Bissels U, Inman J, Phan Q, Chien M, Weir DB, Choksi R, De Vita G, Frezzetti D, Trompeter HI, Hornung V, Teng G, Hartmann G, Palkovits M, Di Lauro R, Wernet P, Macino G, Rogler CE, Nagle JW, Ju J, Papavasiliou FN, Benzing T, Lichter P, Tam W, Brownstein MJ, Bosio A, Borkhardt A, Russo JJ, Sander C, Zavolan M, Tuschl T. A mammalian microRNA expression atlas based on small RNA library sequencing. Cell. 2007;129:1401–1414. doi: 10.1016/j.cell.2007.04.040. [DOI] [PMC free article] [PubMed] [Google Scholar]
- 10.Chiang HR, Schoenfeld LW, Ruby JG, Auyeung VC, Spies N, Baek D, Johnston WK, Russ C, Luo S, Babiarz JE, Blelloch R, Schroth GP, Nusbaum C, Bartel DP. Mammalian microRNAs experimental evaluation of novel and previously annotated genes. Genes Dev. 2010;24:992–1009. doi: 10.1101/gad.1884710. [DOI] [PMC free article] [PubMed] [Google Scholar]
- 11.Winter J, Jung S, Keller S, Gregory RI, Diederichs S. Many roads to maturity microRNA biogenesis pathways and their regulation. Nat Cell Biol. 2009;11:228–234. doi: 10.1038/ncb0309-228. [DOI] [PubMed] [Google Scholar]
- 12.Lee Y, Ahn C, Han J, Choi H, Kim J, Yim J, Lee J, Provost P, Radmark O, Kim S, Kim VN. The nuclear RNase III Drosha initiates microRNA processing. Nature. 2003;425:415–419. doi: 10.1038/nature01957. [DOI] [PubMed] [Google Scholar]
- 13.Denli AM, Tops B, Plasterk RHA, Ketting RF, Hannon GJ. Processing of pri-microRNAs by the microprocessor complex. Nature. 2004;432:231–235. doi: 10.1038/nature03049. [DOI] [PubMed] [Google Scholar]
- 14.Gregory RI, Yan KP, Amuthan G, Chendrimada T, Doratotaj B, Cooch N, Shiekhattar R. The microprocessor complex mediates the genesis of microRNAs. Nature. 2004;432:235–240. doi: 10.1038/nature03120. [DOI] [PubMed] [Google Scholar]
- 15.Han J, Lee Y, Yeom KH, Kim YK, Jin H, Kim VN. The Drosha-DGCR8 complex in primary microRNA processing. Genes Dev. 2004;18:3016–3027. doi: 10.1101/gad.1262504. [DOI] [PMC free article] [PubMed] [Google Scholar]
- 16.Landthaler M, Yalcin A, Tuschl T. The human DiGeorge syndrome critical region gene 8 and its D melanogaster homolog are required for miRNA biogenesis. Curr Biol. 2004;14:2162–2167. doi: 10.1016/j.cub.2004.11.001. [DOI] [PubMed] [Google Scholar]
- 17.Yi R, Qin Y, Macara IG, Cullen BR. Exportin-5 mediates the nuclear export of pre-microRNAs and short hairpin RNAs. Genes Dev. 2003;17:3011–3016. doi: 10.1101/gad.1158803. [DOI] [PMC free article] [PubMed] [Google Scholar]
- 18.Bohnsack MT, Czaplinski K, Gorlich D. Exportin 5 is a RanGTP-dependent dsRNA-binding protein that mediates nuclear export of pre-miRNAs. RNA. 2004;10:185–191. doi: 10.1261/rna.5167604. [DOI] [PMC free article] [PubMed] [Google Scholar]
- 19.Lund E, Güttinger S, Calado A, Dahlberg JE, Kutay U. Nuclear export of microRNA precursors. Science. 2004;303:95–8. doi: 10.1126/science.1090599. [DOI] [PubMed] [Google Scholar]
- 20.Billy E, Brondani V, Zhang H, Muller U, Filipowicz W. Specific interference with gene expression induced by long double-stranded RNA in mouse embryonal teratocarcinoma cell lines. Proc Natl Acad Sci USA. 2001;98:14428–14433. doi: 10.1073/pnas.261562698. [DOI] [PMC free article] [PubMed] [Google Scholar]
- 21.Grishok A, Pasquinelli AE, Conte D, Li N, Parrish S, Ha I, Baillie DL, Fire A, Ruvkun G, Mello CC. Genes and mechanisms related to RNA interference regulate expression of the small temporal RNAs that control C elegans developmental timing. Cell. 2001;106:23–34. doi: 10.1016/s0092-8674(01)00431-7. [DOI] [PubMed] [Google Scholar]
- 22.Hutvágner G, McLachlan J, Pasquinelli AE, Balint E, Tuschl T, Zamore PD. A cellular function for the RNA-interference enzyme Dicer in the maturation of the let-7 small temporal RNA. Science. 2001;293:834–838. doi: 10.1126/science.1062961. [DOI] [PubMed] [Google Scholar]
- 23.Ketting RF, Haverkamp TH, van Luenen HG, Plasterk RHA. Dicer functions in RNA interference and in synthesis of small RNA involved in developmental timing in C elegans. Genes Dev. 2001;15:2654–2659. doi: 10.1101/gad.927801. [DOI] [PMC free article] [PubMed] [Google Scholar]
- 24.Berezikov E, Chung WJ, Willis J, Cuppen E, Lai EC. Mammalian mirtron genes. Mol Cell. 2007;28:328–336. doi: 10.1016/j.molcel.2007.09.028. [DOI] [PMC free article] [PubMed] [Google Scholar]
- 25.Okamura K, Hagen JW, Duan H, Tyler DM, Lai EC. The mirtron pathway generates microRNA-class regulatory RNAs in Drosophila. Cell. 2007;130:89–100. doi: 10.1016/j.cell.2007.06.028. [DOI] [PMC free article] [PubMed] [Google Scholar]
- 26.Ruby JG, Jan CH, Bartel DP. Intronic microRNA precursors that bypass Drosha processing. Nature. 2007;448:83–86. doi: 10.1038/nature05983. [DOI] [PMC free article] [PubMed] [Google Scholar]
- 27.Babiarz JE, Ruby JG, Wang Y, Bartel DP, Blelloch R. Mouse ES cells express endogenous shRNAs, siRNAs, and other microprocessor-independent Dicer-dependent small RNAs. Genes Dev. 2008;22:2773–2785. doi: 10.1101/gad.1705308. [DOI] [PMC free article] [PubMed] [Google Scholar]
- 28.Bogerd HP, Karnowski HW, Cai X, Shin J, Pohlers M, Cullen BR. A mammalian herpesvirus uses noncanonical expression and processing mechanisms to generate viral microRNAs. Mol Cell. 2010;37:135–142. doi: 10.1016/j.molcel.2009.12.016. [DOI] [PMC free article] [PubMed] [Google Scholar]
- 29.Fellmann C, Zuber J, McJunkin K, Chang K, Malone CD, Dickins RA, Xu Q, Hengartner MO, Elledge SJ, Hannon GJ, Lowe SW. Functional identification of optimized RNAi triggers using a massively parallel sensor assay. Mol Cell. 2011;41:733–746. doi: 10.1016/j.molcel.2011.02.008. [DOI] [PMC free article] [PubMed] [Google Scholar]
- 30.Zeng Y, Cullen BR. Efficient processing of primary microRNA hairpins by Drosha requires flanking nonstructured RNA sequences. J Biol Chem. 2005;280:27595–27603. doi: 10.1074/jbc.M504714200. [DOI] [PubMed] [Google Scholar]
- 31.Han J, Lee Y, Yeom KH, Nam JW, Heo I, Rhee JK, Sohn SY, Cho Y, Zhang BT, Kim VN. Molecular basis for the recognition of primary microRNAs by the Drosha-DGCR8 complex. Cell. 2006;125:887–901. doi: 10.1016/j.cell.2006.03.043. [DOI] [PubMed] [Google Scholar]
- 32.Zhang X, Zeng Y. The terminal loop region controls microRNA processing by Drosha and Dicer. Nucl Acids Res. 2010;38:7689–7697. doi: 10.1093/nar/gkq645. [DOI] [PMC free article] [PubMed] [Google Scholar]
- 33.Zeng Y, Yi R, Cullen BR. Recognition and cleavage of primary microRNA precursors by the nuclear processing enzyme Drosha. EMBO J. 2005;24:138–148. doi: 10.1038/sj.emboj.7600491. [DOI] [PMC free article] [PubMed] [Google Scholar]
- 34.Newman MA, Hammond SM. Emerging paradigms of regulated microRNA processing. Genes Dev. 2010;24:1086–1092. doi: 10.1101/gad.1919710. [DOI] [PMC free article] [PubMed] [Google Scholar]
- 35.Mathews DH, Sabina J, Zuker M, Turner DH. Expanded sequence dependence of thermodynamic parameters improves prediction of RNA secondary structure. J Mol Biol. 1999;288:911–940. doi: 10.1006/jmbi.1999.2700. [DOI] [PubMed] [Google Scholar]
- 36.Zuker M. Mfold web server for nucleic acid folding and hybridization prediction. Nucl Acids Res. 2003;31:3406–3415. doi: 10.1093/nar/gkg595. [DOI] [PMC free article] [PubMed] [Google Scholar]
- 37.Zeng Y, Cullen BR. Sequence requirements for microRNA processing and function in human cells. RNA. 2003;9:112–123. doi: 10.1261/rna.2780503. [DOI] [PMC free article] [PubMed] [Google Scholar]
- 38.Karginov FV, Cheloufi S, Chong MMW, Stark A, Smith AD, Hannon GJ. Diverse Endonucleolytic cleavage sites in the mammalian transcriptome depend upon microRNAs Drosha and additional nucleases. Mol Cell. 2010;38:781–788. doi: 10.1016/j.molcel.2010.06.001. [DOI] [PMC free article] [PubMed] [Google Scholar]
- 39.Tuller T, Waldman YY, Kupiec M, Ruppin E. Translation efficiency is determined by both codon bias and folding energy. Proc Natl Acad Sci USA. 2010;107:3645–3650. doi: 10.1073/pnas.0909910107. [DOI] [PMC free article] [PubMed] [Google Scholar]
Associated Data
This section collects any data citations, data availability statements, or supplementary materials included in this article.