Abstract
Temperature control for a large data center is both important and expensive. On the one hand, many of the components produce a great deal of heat, and on the other hand, many of the components require temperatures below a fairly low threshold for reliable operation. A statistical framework is proposed within which the behavior of a large cooling system can be modeled and forecast under both steady state and perturbations. This framework is based upon an extension of multivariate Gaussian autoregressive hidden Markov models (HMMs). The estimated parameters of the fitted model provide useful summaries of the overall behavior of and relationships within the cooling system. Predictions under system perturbations are useful for assessing potential changes and improvements to be made to the system. Many data centers have far more cooling capacity than necessary under sensible circumstances, thus resulting in energy inefficiencies. Using this model, predictions for system behavior after a particular component of the cooling system is shut down or reduced in cooling power can be generated. Steady-state predictions are also useful for facility monitors. System traces outside control boundaries flag a change in behavior to examine. The proposed model is fit to data from a group of air conditioners within an enterprise data center from the IT industry. The fitted model is examined, and a particular unit is found to be underutilized. Predictions generated for the system under the removal of that unit appear very reasonable. Steady-state system behavior also is predicted well.
Keywords: Control boundary, Cooling system, Data center, Forecasting, Hidden Markov model, Multivariate Gaussian autoregressive model, Prediction, Predictive modeling
1. INTRODUCTION
Data centers are facilities that accommodate large computer systems. Many modern data centers are very large and cost millions of dollars to operate and maintain each year. A major portion of these costs is associated with temperature control. The operation of a large computer system produces an enormous amount of heat, and many of its components require a fairly restricted temperature range to work in a reliable and efficient way.
The cooling of a data center is usually achieved by a system of several air-conditioners (ACs) distributed through the space. Often each AC has a continuously running fan, and the flow of coolant through each AC is thermostatically controlled. When the intake temperature for an AC drops below some threshold, the flow of coolant is shut off, and when the intake temperature jumps above another threshold, the flow of coolant is turned on. Because reliable functioning of the computer system is the highest priority, the number of ACs installed in a data center typically far exceeds the number that would be necessary under foreseeable circumstances. As a result, many ACs are underutilized and produce much more heat than they dissipate on average because of their continuously running fan.
By modeling the heat dissipation and production of the system of ACs, an important goal is achieved. It is possible to generate predictions for system behavior under small perturbations. For example, suppose that a particular unit is believed to be underutilized. Then predictions of the system’s behavior can be generated under the removal of that unit with various redistributions of its heat load. These predictions are under the assumption that the system dynamics remain constant. Certainly, such predictions constitute extrapolation and should be used with great care. Changes suggested by the extrapolated model should be made incrementally and monitored carefully. In addition, it is possible to generate normal behavior upper and lower prediction curves for future behavior. If the heat dissipation or production for one or more ACs is outside the prediction boundaries for an extended period of time, this indicates a change in system behavior to the data center monitor. This could help identify a broken fan or open door before the reliable functioning of the computer system is put in jeopardy.
Modeling the heat dissipation and production of the system of ACs is complicated for several reasons. The observed heat dissipation and production for a particular unit at a particular point in time depends on that unit’s previous values, as well as on the current and previous values of nearby units. Moreover, the nature of this dependence on other units and the past undergoes abrupt changes as the flow of coolant to units is switched on and off. Consequently, to model the heat dissipation, a regime-switching type of time series model is more appropriate than the classical multivariate autoregressive model. Hidden Markov models (HMMs) have proven very useful for modeling time course data (Scott, James, and Sugar 2005; Yuan and Kendziorski 2006). Because the pattern of abrupt changes or state transitions is somewhat regular each day, a standard Markov model with a constant transition matrix is not sufficient to characterize the underlying regime-switching process. In this study, traditional multivariate Gaussian autoregressive HMMs (Rabiner 1989; Juang and Rabiner 1991; Krolzig 1997) are extended to allow higher-order autoregression and a periodic state transition matrix. With these modifications, a model that generates predictions consistent with heat dissipation and production observations from an actual data center is obtained.
The remainder of the article is organized as follows. Section 2 proposes a general statistical model for modeling data center temperature differentials. Section 3 presents estimation and prediction based on the proposed model. Section 4 illustrates the proposed method with a real example from the IT industry. Section 5 concludes the article with some discussion.
2. MODEL
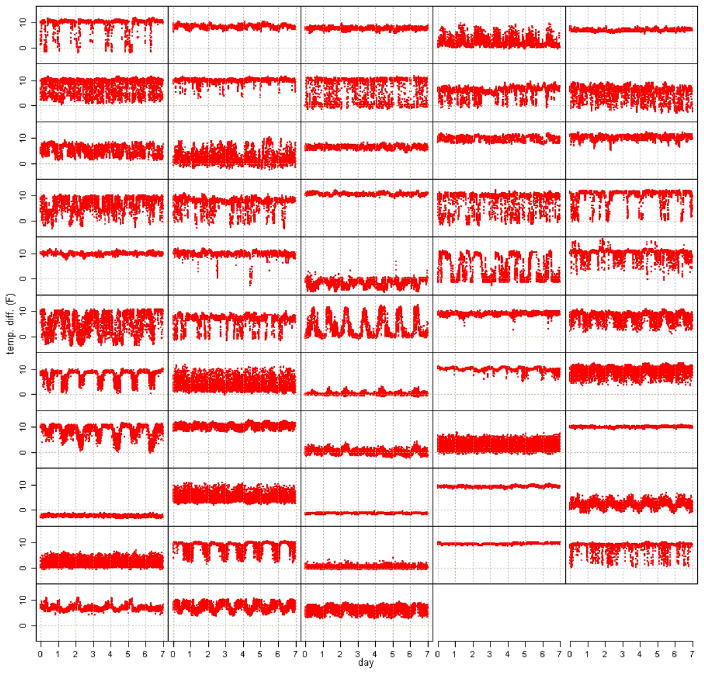
As noted earlier, the behavior of the system of ACs is governed largely by a control system that stops the flow of coolant to ACs whose intake temperature drops below a threshold. When the control system changes states, one or more ACs changes from on to off or vice versa, and an abrupt change in the behavior of the system of ACs occurs. Logically, the control system has 2d settings or states, where d is the number of ACs, one for each configuration of which ACs are turned on and which ACs are turned off. However, the control system uses far fewer than 2d numbers of states. Several of the states correspond to extremes, such as all but a few of the ACs are turned off or turned on. Moreover, several of the states involve irrelevant ACs being turned on or important ACs being turned off. Consider the heat dissipation and production for a system of ACs in a data center shown in Figure 1. The fan within each AC runs continuously, causing underutilized units to have a net heating effect as opposed to a cooling effect. Well-utilized units have a net cooling effect, as indicated by the large temperature differential in Figure 1. Note that several units in Figure 1 have occasional or perennial negative heat dissipation; for example, the AC in the first column and ninth row in Figure 1 is consistently not turned on, and the AC in the second column and first row of Figure 1 is consistently turned on. Several of the abrupt changes can be seen in Figure 1. For example, the AC in the fourth column and fifth row undergoes several sudden changes. The sequence of states of the control system through each day is expected to be somewhat similar to the sequence of states for other days. This cyclic behavior is evident in the majority of ACs in Figure 1. In addition to dependence on the time of day, the probability of a transition to a particular state is expected to depend on the previous state. In particular, it is assumed that the system of ACs has N ≪ 2d distinct states forming a Markov chain whose transition probabilities depend on time of day in a periodic manner. Denoting the state at time t by qt and allowing an arbitrary joint distribution for the initial p states gives
Figure 1.
Temperature differentials for 53 ACs in a large data center over 1 week. A color version of this figure is available in the electronic version of this article.
| (1) |
A local likelihood approach (Tibshirani and Hastie 1987) with a periodic kernel is used to enforce the restrictions that the state transition matrix, , be periodic and not too jagged.
It is assumed that the given data is a d-dimensional system of temperature differentials (difference between intake and out-take air flow temperature) through T evenly spaced time points. Conditional on the states, it is expected that the system of temperature differentials at a particular time will be a function of some average value for that state, the past several systems of temperature differentials, and a random innovation that may depend on the state. In particular, it is assumed that the system of temperature differentials is the sum of a mean for that state, linear transformations of the past several systems of temperature differentials deviations from their means, and a mean-0 random deviation whose shape and spread depend on the state. Denoting the d-vector of temperature differentials at time t by yt and allowing an arbitrary joint distribution for the initial p differentials y1, …, yp conditional on the initial states q1, …, qp, the systems of temperature differentials are modeled as
| (2) |
where . Autoregressive regime-switching models similar to the model described here can be traced back to Hamilton (1989).
3. ESTIMATION AND PREDICTION
For a fixed number of states, N, and order of autoregression, p, the parameters μi, , Σi, and are unknown and are estimated via maximum likelihood and maximum local likelihood in the case of . Letting θ denote the collection of unknown parameters, the complete-data likelihood is
| (3) |
where fqt (yt|yt−1, …, yt−p, qt−1, …, qt−p) denotes the density of
| (4) |
This gives the complete-data log-likelihood
| (5) |
The portion of the complete-data log-likelihood depending on is localized by using a scaled convex combination of log-likelihoods over time to determine the value . In particular, take a kernel K with support (−1, 1) and let
| (6) |
where ℤ denotes the integers. Then has period δ, and each component function has support (wδ − h, wδ + h) as a function of t. Hereinafter, the localized complete-data log-likelihood,
| (7) |
will be used. It is assumed that the period δ and bandwidth h are fixed a priori.
Because the states are not actually observed, the Baum–Welch/EM algorithm (Baum et al. 1970; Dempster, Laird, and Rubin 1977) is used to maximize the incomplete-data log-likelihood. Recall that in the EM algorithm, one begins with an initial estimate of the parameters, and then at each iteration computes the expected complete-data log-likelihood over the unobserved variables conditional on the observed variables and the parameter estimates from the previous iteration. This quantity may be called
 (θ, θ*), where θ* denotes the parameter estimates from the previous iteration. Then one takes as the parameter estimate for the current iteration the maximizer of
 (θ, θ*) with respect to θ. For computational convenience, a value of θ with
 (θ, θ*) >
 (θ*, θ*), corresponding to generalized EM (Dempster, Laird, and Rubin 1977), is taken.
In this case, the complete-data log-likelihood and method of increasing
 (described later) are sufficiently well behaved, so the sequence of parameter estimates generated by the generalized EM algorithm will converge to the maximizer of the observed data likelihood (Wu 1983). Taking the expectation over the states conditional on the observed data and the previous parameter estimates gives
| (8) |
where quantities depending on parameter estimates from the previous iteration in the EM algorithm are designated with an *, Hqt, …, qt−p (t) = p(qt, …, qt−p|y1, …, yT ), and the notation Σi, …, j is short for . An extension of the forward–backward algorithm (Rabiner 1989; Juang and Rabiner 1991) may be used to compute H. Details are given in the Appendix.
At each stage of the generalized EM algorithm,
 is increased by using a single pass of a block-coordinate–type maximization procedure (Bertsekas 1995). Initially, θ is set to θ*, the parameter estimates from the previous iteration. Then
 is maximized as a function of the μ components of θ, and the μ components of θ are set to this maximizer. Second,
 is maximized as a function of the Σ components of θ, and the Σ components of θ are then set to this maximizer. Third,
 is maximized as a function of the Θ components of θ. The Θ components of θ are then set to this maximizer. Finally,
 is maximized as a function of the A components of θ, and the A components of θ are then set to this maximizer. Details of the individual maximizations of the block-coordinate procedure are given in the Appendix.
Once the parameter estimates have converged, one may be interested in estimating the sequence of states through which the system has passed. In particular, it is of interest to find the sequence of states q* that maximizes p(q|y) ∝ p(y, q) with respect to q. This high-dimensional maximization problem can be solved efficiently using a dynamic programming approach similar to the Viterbi algorithm (Viterbi 1967). In particular, let
| (9) |
Then maxq p(y, q) = maxk0, …, kp−1 δk0, …,kp−1 (T). The δ’s may be calculated in a forward manner as
The highest posterior density state sequence may be calculated in a backward manner as
| (10) |
Using the fitted model, predictions for future behavior can be generated. Although closed-form expressions for E(yT+s|y1, …, yT ) and var(yT+s|y1, …, yT ) are obtainable, the expressions are complicated; a much simpler and more flexible approach is to simulate several d-dimensional traces forward through time and compute sample statistics of interest. To generate these simulations, the following procedure may be repeated several times:
Generate a single draw from a multinomial distribution with probabilities Hk0, …, kp (T), where T is the index of the final time point used for model fitting and p is the order of the autoregression. Let ( ) denote the states corresponding to the multinomial draw.
- The Markov chain is simulated from time T + 1 to T + T*. For s = 1, …, T*, generate a multinomial draw with probabilities ( ), and let denote the corresponding state. Generate , and let
(11)
The foregoing procedure can be used to produce extrapolations on system behavior by modifying the parameter values in the fitted model. In the interest of operating a more efficient data center, it is desirable to predict the system’s behavior if particular ACs are shut down. If a unit is shut down, then its average heat dissipated/produced will be 0. However, the heat load for the system will be approximately the same as before, so the heat dissipated/produced by the shut-down unit will be redistributed among the remaining units. In particular, for each state, the unit’s mean is divided up among the remaining units and then set to 0. Because it is not known how the heat load will be redistributed, several redistribution scenarios should be examined. If no reasonable heat load redistribution places an excessive load on any particular unit, this provides evidence that the unit of interest may be safely turned off.
In addition, steady-state prediction intervals computed from the simulated traces may be used as control bounds for a data center monitor. If the actual temperature differences for one or more ACs are outside the prediction bounds for an extended period, then the monitor has an indication that the system’s behavior might have changed and should be examined more closely.
A plot of the simulations and predicted quantities under steady state provides a visual indication of the quality of the model. If the simulations and predictions look similar to the data using in fitting, this is evidence that the model is adequate. In contrast, if the simulations and predictions are markedly different from the data used in fitting, this is evidence that the model is inadequate. A more rigorous approach would be to perform parametric simulation. Using the fitted model, multiple replicates of the d-dimensional times series could be generated and the likelihood of each replicate computed. If the observed likelihood is not extreme compared with this distribution of simulated likelihoods, this is evidence that the model is adequate.
4. CASE STUDY
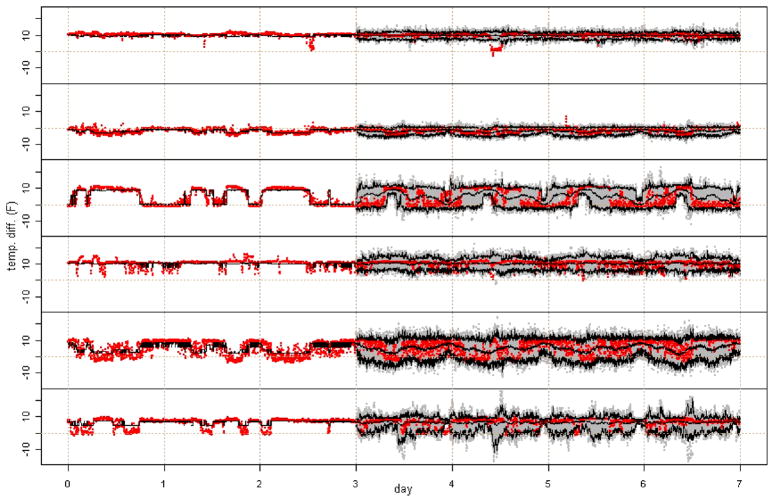
The data used for illustration here consist of intake and output temperatures over time for a group of d = 6 ACs located near one another, the temperature differentials of which are shown in Figure 2. The temperatures are not all recorded at the same time points and are not recorded on a regular grid; however, each temperature is recorded roughly every 2 minutes. For convenience, the temperatures are forced onto a grid with an intake and output temperature for each AC recorded every 2 minutes. This is done by taking the most recent past observation for each AC. The quantity of interest is the amount of power dissipated/produced by each AC. Because the ACs are all the same model and their fans generate approximately the same amount of heat, the difference between output and intake temperature is approximately proportional to the power dissipated/produced. The foregoing model is fit to T = 3 × 24 × 60/2 = 2160, or 3 days of data at 2-minute intervals from these six ACs.
Figure 2.
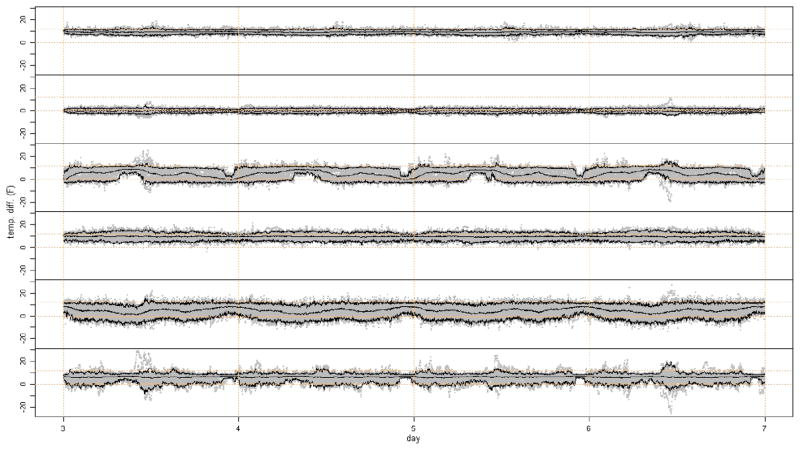
Seven days of temperature differentials for six ACs in a group (in red). The model is fit to the first 3 days, and 50 simulations (in gray) are generated for the last 4 days. The highest posterior density state means for first 3 days are in black. Predicted averages and individual, pointwise 95% prediction intervals for the last 4 days are in black. The online version of this figure is in color.
For the illustration, the model is fit with eight states, N = 8, and second-order autoregression, p = 2. The parameters of the model, with the exception of the transition matrix At, are fit using the aforementioned generalized EM algorithm with a single sweep of a block-coordinate–type maximization increasing the conditional expected complete-data log-likelihood at each step. The time-dependent periodic transition matrix At is estimated using the periodic local likelihood approach discussed earlier with , a periodic square wave with period δ = 720, the number of 2-minute intervals in a single day, and width 2h = 75, the number of 2-minute intervals in hours. The initial state and observation distributions are taken to be πkp, …, k1 = N−p and fkp, …, k1 (y1, …, yp) ∝ 1.
To obtain starting values for the parameters, a k-means clustering with k = N = 8 is performed on the system of temperature differentials. Then a Gaussian autoregressive model with order p = 2 is fit to each cluster. The starting values for the μ’s, Σ’s, and Θ’s are taken to be the cluster means, innovation variances, and autoregressive coefficients of each cluster, respectively. The starting entries of the At’s are taken to be . For these starting parameter values, the fitting procedure converges quickly.
Once the parameter estimates have converged, the Viterbi algorithm is used to compute the highest posterior density state sequence. The state sequence is then used to plot the state means over time, as in the left side of Figure 2. Whereas the different parameters for each state represent far more than just the average behavior, this plot provides a visual indication of parameter convergence. Figure 2 shows that the estimated state means over time follow the actual data quite well.
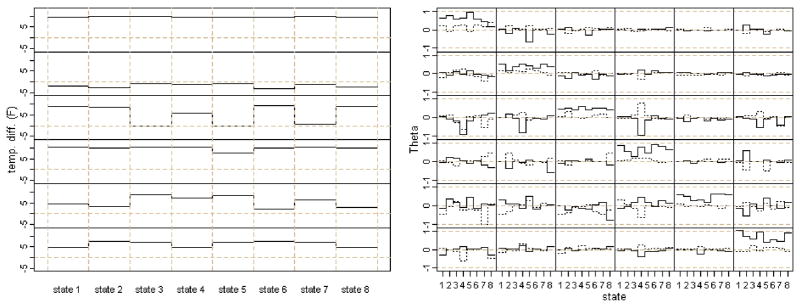
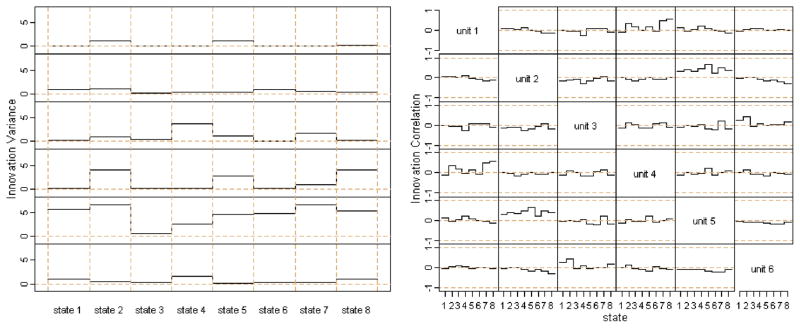
Interpretation of the parameter estimates is not simple. For the eight-state HMM second-order Gaussian autoregressive process with a periodic time-varying state transition matrix fitted to the group of six ACs, there are Nd = 48 mean parameters, Npd2 = 576 autoregressive coefficients, and Nd(d+ 1)/2 = 168 innovation variances and covariances, as well as approximately N(N − 1)δ/(2h) ≅ 538 free parameters in the transition matrix At. The estimated means and autoregressive coefficients across states are shown in Figure 3, the estimated individual innovation variances and innovation correlations across states are shown in Figure 4, and the estimated transition matrix through time is shown in Figure 5. The highest posterior density state sequence for the 3 days to which the model was fit is shown in Figure 6.
Figure 3.
Left panel State means for each of the six units in the group versus state. Right panel: d × d × N Θ1, the first-order autoregressive coefficients, and Θ2, the second-order autoregressive coefficients, in solid and dotted black lines, respectively. Each of the subpanels shows a particular element of Θ1 and Θ2 across states. A color version of this figure is available in the electronic version of this article.
Figure 4.
Left panel Individual innovation variances for each of the six units in the group versus state. Right panel: d × d × N innovation correlations. Each of the off-diagonal subpanels shows a particular component of the innovation correlation across states. A color version of this figure is available in the electronic version of this article.
Figure 5.
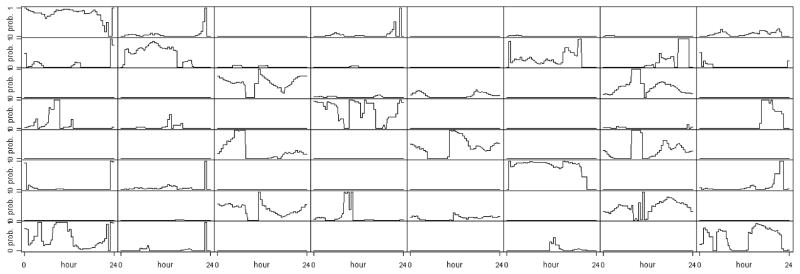
N × N × δ periodic state transition matrix. Each subpanel shows a particular component of the transition matrix through time, At versus t, over its period, a single day. Panels i, j show the probability of a transition from state i to state j as it changes through the day.
Figure 6.
Estimated state versus time for the 3 days to which the model was fit. A color version of this figure is available in the electronic version of this article.
To illustrate parameter interpretation, examine the last 20 hours to which the model is fit in Figure 2. Note that the means of the first, fourth, and sixth units are relatively constant, units two and five start lower and end higher, and unit three starts higher and ends lower. Furthermore, unit four has spikes of higher variability toward the end. The estimated state sequence in Figure 6 shows that the system begins in state 6 and ends jumping between states 3, 5, and 7. The transition matrix in Figure 5 shows that this midday transition is feasible. In particular, it appears that from state 6 that the system went to state 2, then to state 7. When the system is in state 7 at midday, transitions among states 3, 5, and 7 are not unlikely. Examining the state means in the left panel of Figure 3 shows that units two and five have lower average heat dissipation, and unit three has higher heat dissipation in state 6 than states 3, 5, and 7. Furthermore, examining the state variances of individual units in the left panel of Figure 4 shows that the spikes of higher variability in unit four occur when the system enters state 5. The changes in system behavior due to changes in innovation correlations (right panel of Figure 4) and autoregressive coefficients (right panel of Figure 3) are even more difficult to identify, because the changes occur across units and through time.
Now predictions for the future can be generated. Once the simulated traces are obtained, averages across simulations and extreme upper and lower quantiles may be computed for each AC in the group and each future point in time. For example, 50 simulations are generated for the foregoing group of six ACs for the T* = 4 × 720 time points, or 4 days, following the 3 days used to fit the model. These simulations are shown in gray in Figure 2. In Figure 2, the upper, middle, and lower black curves over the last 4 days are the 0.975th quantiles, averages, and 0.025th quantiles over time. Note that the simulated future observations in Figure 2 look similar to the observations used for fitting and the future observations. The prediction boundaries and predicted average heat dissipation/production track the future data closely. Referring to the first row of Figure 2, a watchful monitor might want to take a closer look midway through day 5, when the first AC dips well outside the prediction boundaries for a few hours.
Examining the second AC’s behavior in Figure 2 or its state means in the second row of the left panel of Figure 3 shows that the second AC is almost always producing, not dissipating, heat, and it has a negative average contribution to the total heat dissipation by the group in each state. The group’s behavior if the second AC is shut down can be predicted. If a unit is shut down, then the average heat that it dissipates/produces will be 0; however, the average heat load for the group of ACs will be approximately the same as before, so the average heat dissipated/produced by the shut-down unit will be redistributed among the units within its group. The actual temperature differential across this unit at any point in time is subject to random fluctuations and is unlikely to be 0. It is assumed that the relationships among temperature differentials both across units and through time are unaffected by this redistribution of average heat load. Because how the heat load will be redistributed is not known, the space of heat load redistributions is explored by assigning a random proportion of the shut-down unit’s heat load to each of the remaining units for each state within each simulation. In particular, these proportions are taken to be independent and identically distributed Dirichlet(1, …, 1). Figure 7 shows predictions for the group of six ACs under this heat load redistribution scheme. Note that if unit two were actually shut down, then its average heat load within each state could be redistributed in some way that is not fully reflected in the average traces shown in Figure 7. Moreover, shutting down unit two could possibly cause changes in the remaining parameters. The extrapolations should be used conservatively. For example, it would seem wise to shut down at most one unit at a time. The model then could be refit before considering shutting down additional units.
Figure 7.
Four days of predicted power dissipation/production for group of six ACs under the shutdown of the second unit. A total of 50 simulations are in gray. Each simulation is generated by redistributing the average heat load for unit two to the average heat loads for the remaining units for each state using independent Dirichlet(1, …, 1) random proportions. The other parameters are fixed at their fitted values. Predicted average trace and 95% pointwise individual prediction intervals under the Dirichlet redistribution scheme are in black. A color version of this figure is available in the electronic version of this article.
5. DISCUSSION
Here we have proposed a statistical framework that might be used to model and predict the behavior of a large cooling system. This framework is applicable to other large temperature control systems, such as those used for enterprise web servers (Li 2005). A multivariate Gaussian autoregressive HMM with periodic transition probabilities as described earlier is fit to the system of temperature differentials. This fitted model could be used to generate predictions for future behavior of the system under both small perturbations and no change. For example, to explore the system’s behavior if a particular unit is shut down, the average heat dissipated or produced for that unit can be set to 0 and the unit’s average heat load redistributed among the other units within the group in several different ways. If the predictions generated from these perturbed models do not appear to place too heavy of a heat load on any particular unit, this is evidence that the unit under consideration might be shut down, thereby increasing the energy efficiency of the data center. In addition, a data center monitor may use the predictions for no system changes to flag irregular behavior and intervene before system integrity is compromised.
We now discuss how to account for the uncertainty in estimated parameters when using predictions generated in the manner described near the end of Section 3. For a fixed number of states, N, and order of autoregression, p, the inverse of the observed information matrix can be used to quantify the uncertainty in the parameter estimates, and the simulation scheme can be modified accordingly. The formula
| (12) |
given by Oakes (1999), is valid for all θ. A modified profile likelihood approach also can be used to obtain standard errors of parameters of interest, ψ. In particular, Woodbury’s result on inverses of sums (Harville 2008) can be used to show that
| (13) |
is more conservative than a profile likelihood information estimate. For example, if the parameter of interest is , then, referring to (A.11), it can be seen that the modified profile information estimate in (13) is
| (14) |
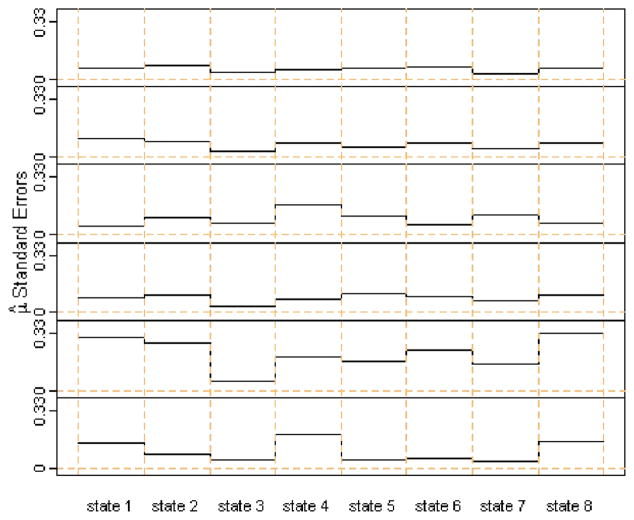
where is as defined in the first paragraph of Section 5. Figure 8 shows the standard errors of β, the square roots of the diagonal elements of the inverse of (14). Note that all of the standard errors of the mean estimates are small. Other approaches to quantifying the parameter uncertainty include Bayesian methods (Fruhwirth-Schnatter 2001; Scott 2002) and bootstrapping (Carlstein et al. 1998; Ryden 2008). A model selection criterion can be used to choose the number of states and order of autoregression (Hannan and Rissanen 1982; Celeux and Durand 2008). These and other methods of determining the number of states and order of autoregression have been discussed briefly by Krolzig (1997).
Figure 8.
Standard errors for the mean estimates of each of the six units in the group versus state. A color version of this figure is available in the electronic version of this article.
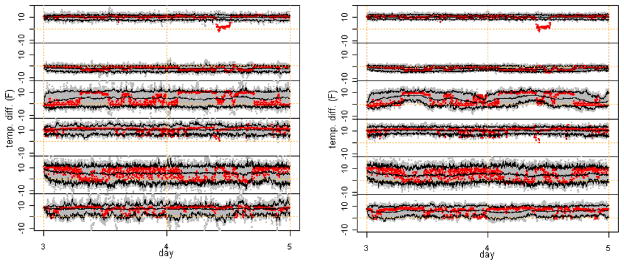
In the current work, no simplifying structure has been imposed on the autoregressive coefficients Θ, covariance matrices Σ, or transition matrices At. Several simplified models were examined, but these generally did not perform as well as the fully flexible model. Figure 9 presents two examples of predictions based on simplified models. The model in the left panel was fit under the assumption that the transition matrix At is constant over time t; the model in the right panel was fit under the assumption that the innovation variances Σk0 and autoregressive coefficients are constant over states k0. Note that if the transition matrix is assumed constant in time, then changes in the group’s center and spread are not captured. Furthermore, if the innovation variances and autoregressive coefficients are assumed constant across states, the changes in some units’ variability over time are not captured. In particular, units three and five exhibit complex behavior that is not well modeled under these simplifications. In some situations, it will be possible to obtain a reasonable fit with a simpler structure such as diagonal Θ or shared Σ across states. In many cases, estimators based on these types of simplifying assumptions are obtainable in a manner similar to that presented in the Appendix. Other assumptions, such as spatial structure on Σ or scaled and shifted combinations of trigonometric functions for At, for example, also might work, but at the expense of closed-form estimators.
Figure 9.
Two days of predicted power dissipation/production for group of six ACs under simplified models. The 50 simulations are in gray, and predicted averages and individual, pointwise 95% prediction intervals are in black. Left panel: Transition matrix At assumed constant in time t. Right panel: Innovation variances Σk0 and autoregressive coefficients assumed constant across states k0. The online version of this figure is in color.
Acknowledgments
We thank the editor, associate editor, and two referees for their insightful comments, which helped shape a better article. Haaland is supported by Award T32HL083806 from the National Heart Lung and Blood Institute.
Qian is supported by National Science Foundation grant DMS-0705206 and a faculty award from IBM.
APPENDIX
Computation of H
Applying the Markov property and letting y denote the collection of observations y1, …, yT, Hqt, …, qt−p (t) may be expressed as
| (A.1) |
where
| (A.2) |
Noting that Σqt, …, qt−p Hqt, …, qt−p (t) = 1 for t = p + 1, …, T, p(y) also may be expressed in terms of α and β as
| (A.3) |
The α’s may be calculated in a forward recursive manner as
| (A.4) |
for t = p + 1, …, T and
| (A.5) |
Similarly, the β’s may be calculated in a backwards recursive manner as
| (A.6) |
for t = p, …, T − 1, where βqT, …, qT−p+1(T) ≡ 1.
Difficulties arise in the actual computation of the α’s and β’s, because the terms fqt (yt|yt−1, …, yt−p, qt−1, …, qt−p) are often < 1, causing the α’s and β’s to decrease to 0 at an exponential rate, rapidly becoming too small for the computer to distinguish from 0. This problem is easily avoided by applying the following scaling to keep the α’s and β’s within the computer’s dynamic range while still allowing the computation of the H’s.
Let cp = 1/p(y1, …, yp) and ct = 1/p(yt|yt−1, …, y1) for t = p + 1, …, T. Then, . Furthermore,
| (A.7) |
for t = p + 1, …, T, where α̃qt, …, qt−p+1 (t) = p(qt, …, qt−p+1|y1, …, yt). Let 1/cp = p(y1, …, yp) = Σq1, …, qpfq1, …, qp (y1, …, yp) × πq1, …, qp. Observe that
| (A.8) |
Therefore,
| (A.9) |
for t = p + 1, …, T and α̃qp, …, q1 (p) = cpαqp, …, q1(p). Letting , gives β̃qT, …, qT−p+1 (T) = cT and
| (A.10) |
for t = p, …, T − 1. Because replacing α and β with α̃ and β̃ in the expression for H in (A.2) and (A.3) introduces the term ( ) both the numerator and denominator, these terms cancel and H is not affected by the scaling.
Individual Maximizations
First consider the μ components of θ. Let and for i = 1, …, N, where denotes the ith column of an N-dimensional identity, Id denotes a d-dimensional identity, and A ⊗ B denotes the tensor product {Bai,j}. Then μi = Ziβ. Also, let and . Then
| (A.11) |
Setting this derivative equal to 0 gives
| (A.12) |
Second, consider the Σ components of θ. The basic problem is that of maximizing
| (A.13) |
subject to Σ being positive definite. Writing Σ−1 = CC′ and taking the logarithm, the problem can be expressed in terms of the eigenvalues, λ1, …, λd, of C′AC as
| (A.14) |
subject to λi > 0 for i = 1, …, d. This problem has solution C′AC = nId or Σ̂ = A/n. Applying this result gives
| (A.15) |
Next, consider each of the components of θ in turn for i = 1, …, N and m = 1, …, p. Vectorizing gives
| (A.16) |
where and bj denotes column j of B: m × n. Setting the foregoing derivative equal to 0 and solving for gives
| (A.17) |
Finally, consider the transition matrix At. Let
| (A.18) |
Then
| (A.19) |
Setting the foregoing derivative equal to 0 and solving for ηk1 and gives
| (A.20) |
In practice, At need not be computed at every time point, because it is assumed to vary smoothly through time. In the case study presented in Section 4, At is computed only every 1/2 hour.
Footnotes
The content is solely the responsibility of the author and does not necessarily represent the official views of the National Heart Lung and Blood Institute or the National Institutes of Health.
Contributor Information
Ben Haaland, Center for Quantitative Biology and Medicine, Duke-National University of Singapore Graduate Medical School, Singapore 169857.
Wanli Min, School of Statistics and Management, Shanghai University of Finance and Economics, China 200433.
Peter Z. G. Qian, Email: peterq@stat.wisc.edu, Department of Statistics, University of Wisconsin–Madison, Madison, WI 53706.
Yasuo Amemiya, Statistical Analysis & Forecasting, IBM Thomas J. Watson Research Center, Yorktown Heights, NY 10598.
References
- Baum LE, Petrie T, Soules G, Weiss N. A Maximization Technique Occurring in the Statistical Analysis of Probabilisitic Functions of Markov Chains. Annals of Mathematical Statistics. 1970;41:164–171. [Google Scholar]
- Bertsekas D. Nonlinear Programming. MA: Athena Scientific; 1995. [Google Scholar]
- Carlstein E, Do K-A, Hall P, Hesterberg T, Kunsch HR. Matched-Block Bootstrap for Dependent Data. Bernoulli. 1998;4:305–328. [Google Scholar]
- Celeux G, Durand J-B. Selecting Hidden Markov Model State Number With Cross-Validated Likelihood. Computational Statistics. 2008;23:541–564. [Google Scholar]
- Dempster AP, Laird NM, Rubin DB. Maximum Likelihood From Incomplete Data via the EM Algorithm. Journal of the Royal Statistical Society, Ser B. 1977;39:1–38. [Google Scholar]
- Fruhwirth-Schnatter S. Markov Chain Monte Carlo Estimation of Classical and Dynamic Switching and Mixture Models. Journal of the American Statistical Association. 2001;96:194–209. [Google Scholar]
- Hamilton J. A New Approach to the Economic Analysis of Nonstationary Time Series and the Business Cycle. Econometrica. 1989;57:357–384. [Google Scholar]
- Hannan EJ, Rissanen J. Recursive Estimation of Mixed Autoregressive Moving Average Order. Biometrika. 1982;69:81–94. [Google Scholar]
- Harville DA. Matrix Algebra From a Statistician’s Perspective. New York: Springer; 2008. [Google Scholar]
- Juang BH, Rabiner LR. Hidden Markov Models for Speech Recognition. Technometrics. 1991;33:251–272. [Google Scholar]
- Krolzig H-M. Markov-Switching Vector Autoregressions. Modelling, Statistical Inference, and Application to Business Cycle Analysis. New York: Springer-Verlag; 1997. [Google Scholar]
- Li T-H. A Hierarchical Framework for Modeling and Forecasting Web Server Workload. Journal of the American Statistical Association. 2005;100:748–763. [Google Scholar]
- Oakes D. Direct Calculation of the Information Matrix via the EM Algorithm. Journal of the Royal Statistical Society, Ser B. 1999;61:479–482. [Google Scholar]
- Rabiner LR. A Tutorial on Hidden Markov Models and Selected Applications in Speech Recognition. Proceedings of the IEEE. 1989;77:257–286. [Google Scholar]
- Ryden T. EM versus Markov Chain Monte Carlo for Estimation of Hidden Markov Models: A Computational Perspective. Bayesian Analysis. 2008;3:659–688. [Google Scholar]
- Scott SL. Bayesian Methods for Hidden Markov Models: Recursive Computing in the 21st Century. Journal of the American Statistical Association. 2002;97:337–351. [Google Scholar]
- Scott SL, James GM, Sugar CA. Hidden Markov Models for Longitudinal Comparisons. Journal of the American Statistical Association. 2005;100:359–369. [Google Scholar]
- Tibshirani R, Hastie T. Local Likelihood Estimation. Journal of the American Statistical Association. 1987;82:559–567. [Google Scholar]
- Viterbi A. Error Bounds for Convolutional Codes and an Asymptotically Optimum Decoding Algorithm. IEEE Transactions on Information Theory. 1967;13:260–269. [Google Scholar]
- Wu CFJ. On the Convergence Properties of the EM Algorithm. The Annals of Statistics. 1983;11:95–103. [Google Scholar]
- Yuan M, Kendziorski C. Hidden Markov Models for Microarray Time Course Data in Multiple Biological Conditions. Journal of the American Statistical Association. 2006;101:1323–1332. [Google Scholar]


