Abstract
Tropomyosins are rod-like dimers which form head-to-tail polymers along the length of actin filaments and regulate the access of actin binding proteins to the filaments.1 The diversity of tropomyosin isoforms, over 40 in mammals, and their role in an increasing number of biological processes presents a challenge both to experienced researchers and those new to this field. The increased appreciation that the role of these isoforms expands beyond that of simply stabilizing actin filaments has lead to a surge of reagents and techniques to study their function and mechanisms of action. This report is designed to provide a basic guide to the genes and proteins and the availability of reagents which allow effective study of this family of proteins. We highlight the value of combining multiple techniques to better evaluate the function of different tm isoforms and discuss the limitations of selected reagents. Brief background material is included to demystify some of the unfortunate complexity regarding this multi-gene family of proteins including the unconventional nomenclature of the isoforms and the evolutionary relationships of isoforms between species. Additionally, we present step-by-step detailed experimental protocols used in our laboratory to assist new comers to the field and experts alike.
Key words: tropomyosin, isoforms, cytoskeleton, reagents, antibodies, multi-gene family
Introduction
The actin microfilament system plays a critical role in a myriad of cellular functions including cell motility, cell division and cytokinesis, contractile force, cell signaling, transcription and intracellular transport. This wide range of biological functions is made possible by various actin binding proteins that associate with actin monomers or the filaments and modify any combination of the dynamics and mechanical and structural properties of cytoskeletal filaments. It is becoming increasingly clear that the actin filament is not a ‘generic’ passive player in this process but rather that the filaments themselves contain functional information which predisposes them to specific functional outcomes. One crucial component of filaments that confers a specific functional outcome is tropomyosin which forms a continuous polymer running along the major groove of most actin filaments.1
Tropomyosins (Tms) belong to a highly conserved and diverse family of actin associated proteins present in all animals from yeast to humans, with the possible exception of Dictyostelium, but absent in plants.2 It is notable that in plants, however, there are more than the two cytoskeletal actins found in mammals and that the different actins provide functional discrimination between actin filaments.3 Tm is characterized by its α-helical coiled-coil structure and dimers form an intermolecular head-to-tail complex resulting in a continuous elongated polymer that lies along the major groove of actin filaments.4 The large number of documented Tm isoforms is derived from the use of alternative promoters and internal exon splicing of multiple genes.5 A highly regulated repertoire of Tm isoforms is found in different cell types and expression of Tms is spatially and temporally regulated in a qualitative and quantitative manner (reviewed in refs. 6 and 7). Tms are recognized as actin filament stabilising proteins, regulating the dynamics and structural properties of the filaments by controlling the interaction of the filaments with actin binding proteins1,8 and hence the term “gatekeeper” has been coined to describe the role of Tm.9 For example, the high molecular weight (HMW) Tm isoforms are more efficient in protecting actin filaments from the severing activity of gelsolin than the lower molecular weight (LMW) isoforms whereas the HMW isoforms are better at annealing gelsolin severed filaments than LMW Tms.10,11 The actin depolymerizing factor (ADF) and filamin compete with Tm for binding to actin filaments12–15 in a Tm isoform specific manner.16 Tms have also been shown to control the activity of myosin motors17–20 and specify the intracellular sorting of myosin II in a Tm isoform specific manner.16,21 Tm and caldesmon can also regulate myosin II activity in smooth muscle cells.22 Finally, tropomodulins have been shown to have distinct affinities for different Tm isoforms.23–25 Together with the findings that Tm isoforms sort to different subcellular compartments, these observations strongly suggest that this multitude of isoforms is required for the proper spatial and temporal regulation of cytoskeletal function.1
In this report we document the many tools currently available to study the biological function of this family of proteins including Tm isoform specific antibodies, mammalian expression constructs and mouse models. The surprisingly high degree of amino acid conservation that exists in organisms as divergent as fish and humans indicates that such tools as the Tm antibodies can be utilized in multiple model systems. We envisage that this report will serve as a self-help guide to the study of the role of Tm isoforms in the cytoskeleton.
Results and Discussion
The generation and evolution of Tm isoforms.
The number of Tm genes varies from one and two in the fungi Schizosaccharomyces pombe and Saccharomyces cerevisiae, respectively, four in mammals and six in zebra fish (Danio rerio).26,27 Table 1 lists the genes identified in 6 commonly studied animal model systems together with the chromosome location and the genes found adjacent to the Tm loci. Interestingly, the Tm loci are found adjacent to a few common genes including talin and Rab8a. For the most part the focus of this report will be on mammalian Tm genes and isoforms. A schematic representation of the intronexon organization of the four mammalian genes is shown in Figure 1. The overall organization of exons and splicing patterns in the mammalian genes is conserved between mammals, avian, amphibians and fish. The genes in simpler species follow similar principles but differ substantially in the details of alternative exons and their evolutionary relationship to the specific genes in vertebrates.27 The human Tm genes have been named TPM1, TPM2, TPM3 and TPM4, however, due to the lack of a unified nomenclature for the gene names or the isoforms, alternative names documented in the literature are listed in Table 2.
Table 1.
Ensemble identification numbers of the Tm genes from different species, chromosome location and adjacent genes
| Species | Gene | Ensemble Accession No. | Chromosome | Adjacent Loci |
| Human (Homo sapians) | TPM1 (αTm) | ENSG00000140416 | Ch 15 | Talin2, Rab8b, CA12 |
| TPM2 (βTm) | ENSG00000198467 | Ch 9 | Talin1, RUSC2, CREB3, GBA2 | |
| TPM3 (γTm) | ENSG00000143549 | Ch 1 | HAX1, SNORA58.2, Rab13, RUSC1 | |
| TPM4 (δTm) | ENSG00000167460 | Ch 19 | Rab8a | |
| Mouse (mus musculus) | TPM1 (αTm) | ENSMUSG00000032366 | Ch 9 | Talin2, Rab8b, CA12 |
| TPM2 (βTm) | ENSMUSG00000028464 | Ch 4 | Talin1, RUSC2, CREB3, GBA2 | |
| TPM3 (γTm) | ENSMUSG00000027940 | Ch 3 | HAX1, SNORA58.2, Rab13, RUSC1 | |
| TPM4 (δTm) | ENSMUSG00000031799 | Ch 8 | Rab8a | |
| Rat (Rattus norviegicus) | TPM1 (αTm) | ENSRNOG00000018184 | Ch 1 | Talin2, Rab8b, CA12 |
| TPM2 (βTm) | ENSRNOG00000016731 | Ch 5 | Talin1, RUSC2, CREB3, GBA2 | |
| TPM3 (γTm) | ENSRNOG00000017441 | Ch 2 | Rab13, RUSC1 | |
| TPM4 (δTm) | ENSRNOG00000015496 | Ch 16 | Rab8a | |
| Chicken (Gallus gallus) | TPM1 (αTm) | ENSGALG00000003521 | Ch 10 | Talin2, Rab8b, CA12 |
| TPM2 (βTm) | ENSGALG00000002563 | Ch Z | Talin1, RUSC2, CREB3, GBA2 | |
| TPM3 (γTm) | ENSGALG00000013537 | Ch 25 | SNORA58, RUSC1 | |
| TPM4 (δTm) | - | Ch 28 | Rab8a | |
| Western Clawed frog (Xenopus tropicalis) | TPM1 (αTm) | ENSXETG00000009718 | - | - |
| TPM2 (βTm) | ENSXETG00000009615 | - | - | |
| TPM3 (γTm) | ENSXETG00000020732 | - | - | |
| TPM4 (δTm) | ENSXETG00000008736 | - | - | |
| Zebrafish (Danio rerio) | TPM1 (αTm) | ENSDARG00000087402 | Ch 25 | Talin2 |
| TPMa (αTm) | ENSDARG00000033683 | Ch 7 | Talin2 (homologue) fbxo22 | |
| TPM2 (βTm) | ENSDARG00000068385 | Ch 10 | Talin1 | |
| TPM3 (γTm) | ENSDARG00000005162 | Ch 19 | MSMP, tomm40l, arhgef1 | |
| TPM4-1 (δTm) | ENSDARG00000019128 | Ch 2 | Rab8a | |
| TPM4-2 (δTm) | ENSDART00000142717 | Ch 22 | ANKMY1 |
Figure 1.
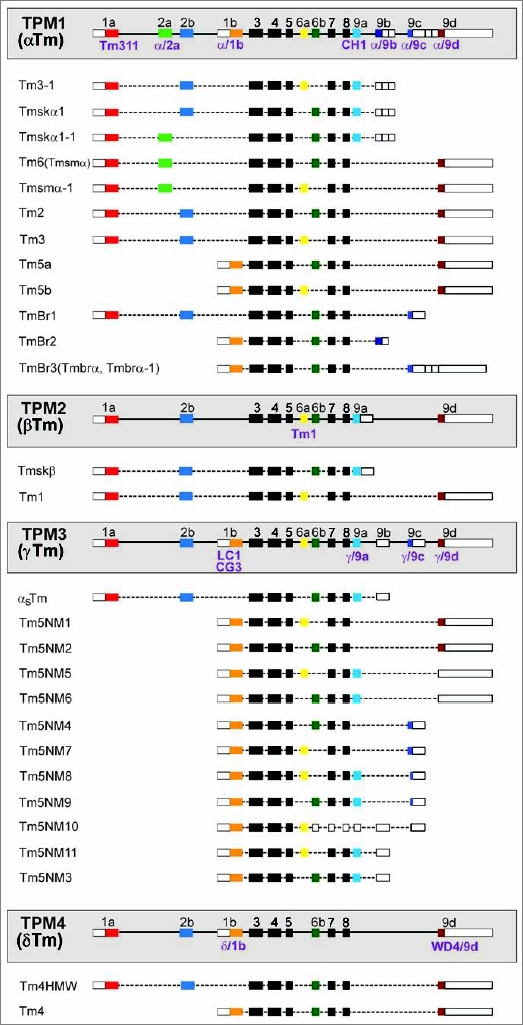
Schematic representation of the organization of the mammalian Tm genes. Colored boxes represent the protein coding exons numbered 1 to 9 and lines the introns. Unshaded boxes signify untranslated sequences and black boxes are exons common to all the genes which share a high degree of homology. The various isoforms generated via alternative exon splicing are listed under each gene and only the major products verified by northern or protein gel blots are shown. The name of the different tm antibodies (denoted in purple) is below the exon containing the epitope.
Table 2.
Alternative names for mammalian Tms
| Gene Name | Gene alternative names | Tm isoforms | Isoform alternative names | NCBI accession numbers for the human isoforms |
| TPM1 | αTm | Tm3-1 αf-Tm hTmskα1-1 hTmsmα hTmsmα-1 Tm2 Tm3 Tm5a Tm5b TmBr1 TmBr2 TmBr3 |
- αTmfast, Tmskα, hTmskα1 TPM1κ Tmsmα, Tm6 - - - - - - - hTmbrα-1, hTmbrα |
DNA-NM_000366, Protein-NP_000357 DNA-NM_001018005, Protein-NP_001018005 DNA-AY640414, Protein-AAT68294 DNA-NM_001018007, Protein-NP_001018007 DNA-NM_001018020, Protein-NP_001018020 DNA-NM_001018004, Protein- NP_001018004 DNA-NM_001018006, Protein-NP_001018006 DNA-CH471082 AADB02000000, Protein-EAW77629 DNA-CH471082 AADB02000000, Protein-EAW77633 DNA-CH471082 AADB02000000, Protein-EAW77630 DNA-AB209041, Protein-BAD92278 |
| TPM2 | βTm | β-Tm Tm1 hTm1-1 |
Tmskβ, hTmskβ Smooth muscle Tm1-Fibroblast - |
DNA-NM_003289, Protein-NP_003280 DNA-NM_213674, DNA-NM_213674 DNA-CR590682, Protein-none |
| TPM3 | γTm, hTm30 nm, hTmnm, Tm-5 | αs-Tm Tm5NM1 Tm5NM2 Tm5NM6 Tm5NM7 Tm5NM4 Tm5NM8 Tm5NM9 Tm5NM10 Tm5NM11,5 Tm5NM3 |
αTmslow, αsTm, hTmskα2 hTm5, Tm5, Tm30, fibroblast Tm30 nm - - hTm5-1, TC22 hTmbrγ - - - hTm5-2 - |
DNA-NM_152263, Protein-NP_689476 DNA-NM_153649, Protein-NP_705935 DNA-NM_001043351, Protein-NP_001036816 DNA-CH471121, Protein-EAW53237 DNA-NM_001043352, DNA-NM_001043352 DNA-NM_001043353, Protein-NP_001036818 DNA-AL590431, Protein-CAH71266 |
| TPM4 | δTm, hTm30pl, hTmpl, Tm-4 | hTm4HMW Tm4 |
- - |
DNA-AK023385, Protein-BAB14554 DNA-NM_003290, Protein-NP_003281 |
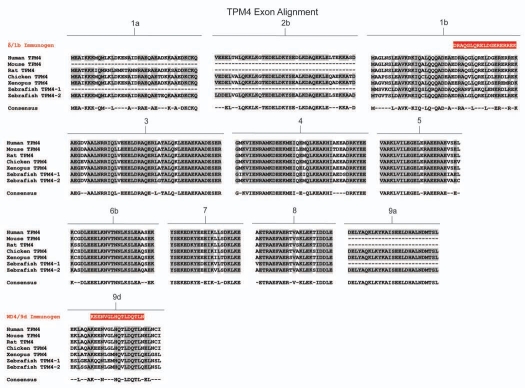
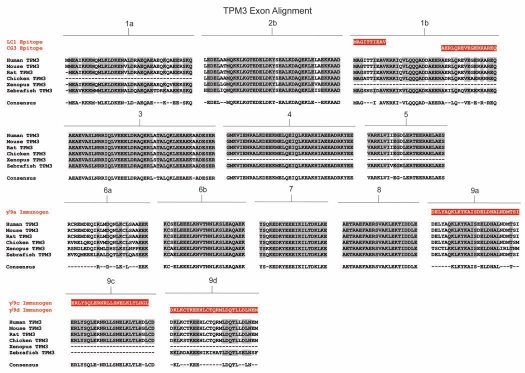
Figures 2–5 show, for each gene, the amino acid sequences of each of the exons compared between mammals, birds, amphibians and fish. The consensus sequence across species is shown below each exon. The most striking feature of this comparison is the extraordinary conservation of primary structure across over 500 million years of evolution. This emphasizes that these proteins are under great selective pressure to maintain a precise primary sequence. Selection is unlikely to reflect the structural demands of maintaining the coiled coil because there are few absolute primary sequence requirements necessary to generate a coiled coil.28 Rather, the selection is more likely to reflect isoform specific functional demands1 possibly underpinned by subtle structural features as described recently in reference 29 and/or positioning in the major groove of the actin filament.30,31
Figure 2.
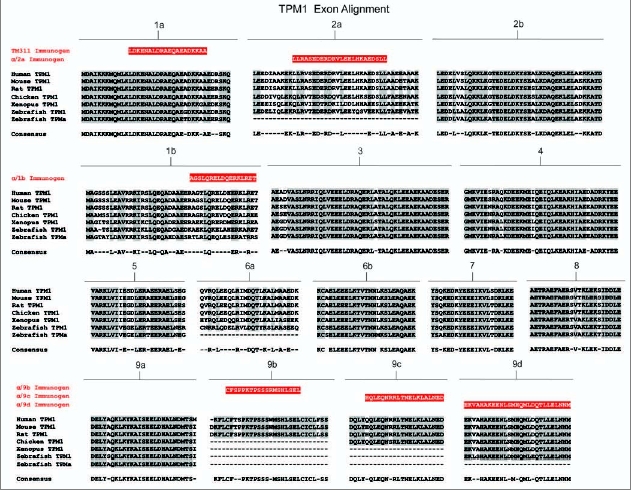
Amino acid sequence comparison of the TPM1 gene from six animal species. Amino acid alignment of all exons contained within the TPM1 gene for selected members of chordata. Species included are human (Homo sapiens), mouse (Mus musculus) and rat (Rattus norviegicus) representing mammalians, chicken (Gallus gallus) representing birds, western clawed frog (Xenopus tropicalis) representing amphibians and zebrafish (Danio rerio) representing fish. Shaded areas and consensus sequence indicate regions of sequence conservation while unshaded regions represent areas of sequence divergence between the aligned species. Dashed lines within alignments imply that either the particular exon is not found within that species or that the exon in question has not been identified due to minimal genomic sequence information and lack of evidence from cDNA library sequences. Zebrafish contains two copies of the TPM1 gene named TPM1 and TPMa which are the result of a whole genome duplication event. Antibody immunogens and/or epitopes for antibodies TM311, α/2a, α/1b, α/9b, α/9c and α/9d are presented as white text highlighted in red and are aligned with the region of the exon from which they were derived.
Figure 5.
Amino acid sequence comparison of the TPM4 gene from six animal species. Amino acid alignment of all exons contained within the TPM4 gene for selected members of chordata. Species included are human (Homo sapiens), mouse (Mus musculus) and rat (Rattus norviegicus) representing mammalians, chicken (Gallus gallus) representing birds, western clawed frog (Xenopus tropicalis) representing amphibians and zebrafish (Danio rerio) representing fish. Shaded areas and consensus sequence indicate regions of sequence conservation while unshaded regions represent areas of sequence divergence between the aligned species. Dashed lines within alignments imply that either the particular exon is not found within that species or that the exon in question has not been identified due to minimal genomic sequence information and lack of evidence from cDNA library sequences. Zebrafish contains two copies of the TPM4 gene, named TPM4-1 and TPM4-2 which are the result of a whole genome duplication event. Antibody immunogens for antibodies δ/1b and wd4/9d are presented as white text highlighted in red and are aligned with the region of the exon from which they were derived. The antibody immunogen for γ/9a (TPM3 gene) is also shown.
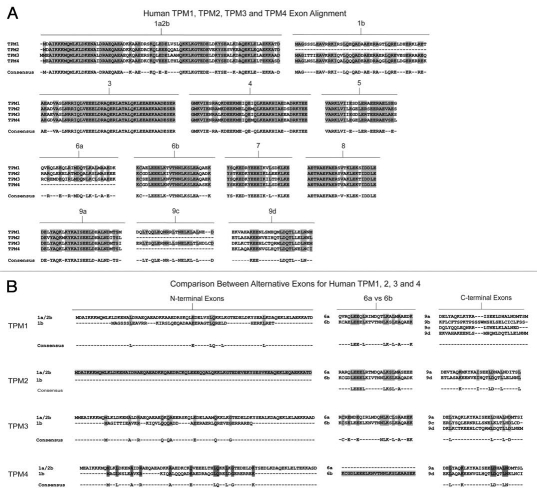
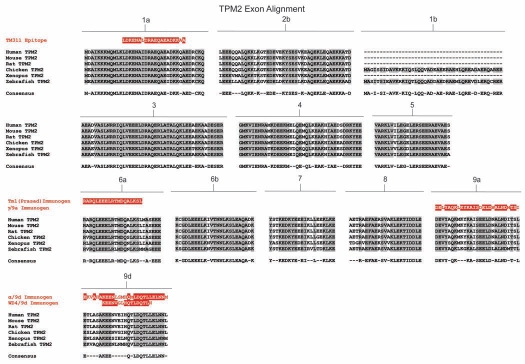
Sequence diversity between the isoforms results from both sequence divergence between alternative exons in the same gene and between the same exons in different genes (Fig. 6). Comparison of the amino acid sequences of each of the 4 human genes, exon by exon, shows that there is a high degree of sequence similarity between the genes although this varies between exons (Fig. 6A). Some exons, like 1a, 2b, 3, 4, 5, 6b, 7, 8 and 9a show a high degree of similarity between the genes whereas exons 1b, 6a, 9c and 9d show substantial differences which would be expected to contribute to isoform divergence (Fig. 6A). The greatest source of primary sequence divergence comes from alternative promoter use and alternative splicing. There are two types of N-termini which result from the use of different promoters (Fig. 1). Exon 1a plus either exon 2a or 2b gives rise to the N-terminus of high molecular weight tropomyosins (approximately 284 aa). The alternative N-terminus derives from the use of exon 1b and gives rise to the shorter LMW isoforms (approximately 248 aa). In addition to the obvious length difference between the choices of N-terminus, there is also considerable sequence divergence (Fig. 6B) between these alternative N-termini. Thus the similarity between genes for the same exons is much greater than it is between alternative exons in the same gene. This trend is also seen for exons 6a vs. 6b and also for the C-terminal exons 9a, 9b, 9c and 9d. In both cases, it is almost impossible to detect any homology between the alternative exons in the same gene (Fig. 6B). This divergence has provided an effective strategy for the generation of antibodies which recognize specific subsets of isoforms (see below).
Figure 6.
Exon alignment of the human Tm genes. A comparison highlighting the differences in amino acid composition between an alignment of corresponding exons from human TPM1, TPM2, TPM3 and TPM4 genes and an alignment of the exons responsible for generating isoforms; exons 1a/2b and 1b (N-terminus), 6a and 6b, and exons 9a, 9b, 9c and 9d (C-terminus) within each of the 4 Tm genes. (A) An alignment of human Tm genes TPM1, TPM2, TPM3 and TPM4 showing the conservation of amino acid sequence between the four genes. Shaded residues and consensus sequence indicate regions of conservation within the genes whilst unshaded regions indicate areas of sequence divergence. (B) An alignment of exons responsible for generating diversity showing amino acid sequence conservation for alternatively spliced exons from the N-terminus, middle and C-terminus within each of the four genes. Shaded and unshaded areas are as indicated above.
RT-PCR analysis has identified over 40 Tm isoforms that are coded by the mammalian genes.5,32,33 Evidence for the presence of transcripts detected at the level of northern blot analysis or most preferable at the protein level only really exists for half of these isoforms and the majority are listed in Table 2. Tm isoforms found in association with the contractile apparatus of skeletal, cardiac and smooth muscle cells are referred to as muscle Tms whereas those associated with the cytoskeleton of all cells are referred to as the cytoskeletal isoforms (often referred to, incorrectly, as non-muscle isoforms in the literature).
TPM1 and TPM2 are also referred to as the αTm and βTm gene respectively34 (Fig. 1). The TPM1 gene has been found by RT-PCR to code for 20 isoforms in rat adult tissues and cultured cells.32 Included among the encoded isoforms is the αTm expressed in striated muscle, the recently discovered TPM1κ in human hearts,35 the isoforms preferentially enriched in the central nervous system, TmBr1, TmBr2 and TmBr3 and Tm2, Tm3, Tm5a and Tm5b. The TPM2 gene codes for the skeletal muscle βTm isoform and, thus far, only one cytoskeletal isoform, Tm1, has been detected. Tm1 has been found to be significantly downregulated in transformed cells and restoring Tm1 expression has been shown to reverse transformation in ras-transformed cells.36 The TPM3 gene codes for the slow-twitch skeletal muscle isoform (αsTm) and at least 9 LMW cytoskeletal isoforms referred to as Tm5NM1 to Tm5NM11.33,37–39 Isoforms NM3 and NM6 are identical at the protein level but have unique 3′UTRs, the same is for isoforms NM5 and NM11 (Fig. 1). The TPM4 gene40,41 codes for the cytoskeletal Tm4 isoform and a HMW Tm4 found in many species but not rodents.42
Post translational modifications.
To date post translational modifications of Tms are largely an unexplored area of investigation. The most reported forms of post translational modifications in the literature are NH2-terminal acetylation and phosphorylation although evidence of S-nitrosylation and disulfide-crosslinked Tm has been documented.
Acetylation has been shown to significantly enhanced Tm affinity for actin. Unacetylated mammalian skeletal Tm is unable to bind actin in the absence of troponin43,44 and unacetylated α-smooth muscle Tm has much weaker affinity for actin than the acetylated form.45 In addition, acetylation has been shown to increase the end-to-end interactions between Tm dimers9,44,46 and in Schizosaccharomyces pombe to significantly enhance the ability of Tm to regulate myosin activity.47 At least in yeast, distinct spatial segregation of acetylated and nonacetylated Tm-containing actin filaments has been observed suggesting the possibility that different forms of Tm can regulate specific myosins.17
Phosphorylation of Tm has been found in both skeletal and cardiac muscle of many different species.48–54 The phosphorylation of Tm has been shown to enhance the ability of Tm to form head-to-tail interactions and promote activation of myosin Mg2+ ATPase.55,56 Phosphorylation of cytoskeletal Tms has also been documented and postulated to be required for the remodelling of the actin cytoskeleton.57,58
Finally, endothelial cells exposed to shear flow were shown to have more than 12 proteins that had significantly increased S-nitrosylation among them Tm at Cys 170 located in the hydrophobic motif.59 The authors suggest that such modification may allow for the remodelling together with maintaining the integrity of the endothelial cells under flow conditions.
Evaluating the specificity of Tm antibodies.
Many of the Tm antibodies commercially available are sold with minimal information regarding the antigen used to raise the antibody and hence the isoform specificity. This greatly limits their use and in some cases leads to confusion in the literature. We previously described the characterization of 10 Tm antibodies.60 Here, we report an additional 9 Tm antibodies. Table 3 is a comprehensive list of all the Tm antibodies that we have extensively characterized together with the isoform specificity, published references and commercial availability. The majority of the antibodies were generated using peptides corresponding to part or all of a specific exon. There are exceptions where the initial antibodies were made by using whole tissue tropomyosin, for example chicken gizzard, and the epitopes are yet to be identified. Figure 1 shows the name of the antibody below the exon encoding the epitope and the peptide used as immunogen for these antibodies is shown in Figures 2–5. Comparison of the peptide sequence containing the epitope cross species indicates the likelihood that many of these antibodies will be reactive across many model systems (Figs. 2–5).
Table 3.
Summary of Tm antibodies, exon and isoform specificity
| Antibody name TPM1,2 gene antibodies | Peptide sequence/Immunogen | Exon specificity | Tm isoform recognition | Reference | Species | Commercial availability |
| TM311 | LDKENALDRAEQAEADKKAA | aa14-32 exon 1a | Tm6, 1, 2, 3, Brl α,β,γ muscle Tm | 58 | mouse monoclonal | Sigma Aldrich |
| α/1b | CAGSLQRELDQERKLRET | exon 1b | Tm5a, 5b, Br2, Br3 | this paper | sheep polyclonal | |
| α/2a | CLLRAESEDERDRVLEELHKAEDSLL | exon 2a | sm mus Tm (Tm6) | 99 | sheep | Millipore AB5437 |
| α/2a | CLLRAESEDERDRVLEELHKAEDSLL | exon 2a | sm mus Tm (Tm6) | this paper | mouse monoclonal | |
| α/9b | CFSPPKTPSSSRMSHLSEL | exon 9b | TmBr2 | this paper | mouse monoclonal | |
| WSα/9c | HQLEQNRRLTNELKLALNED | exon 9c | TmBr-1 TmBr-3 | 60, 100 | rabbit | Millipore AB5439 |
| α/9c | HQLEQNRRLTNELKLALNED | exon 9c | TmBr-1, TmBr-3 | 68 | mouse monoclonal clone #554 | |
| α/9d | EKVAHAKEENLSMHQMLDQTLLELNNM | entire exon 9d | Tm6, 1, 2, 3, 5a, 5b | 60 | sheep | Millipore AB5441 |
| α/9d | EKVAHAKEENLSMHQMLDQTLLELNNM | entire exon 9d | Tm6, 1, 2, 3, 5a, 5b | this paper | mouse monoclonal (IgG2bk)clone15D12.2 | |
| CGI | Chicken gizzard Tm | Unknown | Tm1 | 61, 101 | mouse monoclonal (IgG1) | |
| CGβ6 | Chicken gizzard Tm | COOH terminal end of hTm2, htm3 | Tm2, 3 | 61, 62 | mouse monoclonal (IgM) | |
| Sarcomeric Tm (Sigma CH1) | Unknown. | exon α9a | Sarcomeric Tms: αfast, β, αslow (poor affinity for αslow) | 60, 61 | mouse monoclonal (IgG) | Sigma Aldrich |
| Tm1(Prasad) | SRARQLEEELRTMDQALKSL (187–206aa) | exon β6a | Tm1 | 102 | rabbit polyclonal | |
| Antibody name TPM3 gene antibodies | Peptide sequence/Immunogen | Exon specificity | Tm isoform recognition | Reference | Species | Commercial availability |
| y/9a | CDELYAQKLKYKAISDELDHALNDMTSI | exon 9a | Tm5NM6/3, 5/11, 8, 9, α and β Tms | 68 | sheep polyclonal | Millipore AB5443 |
| y/9a | CDELYAQKLKYKAISDELDHALNDMTSI | exon 9a | Tm5NM6/3, 5/11, 8, 9, α and β Tms | this paper | mouse monoclonal | |
| y/9c | CERLYSQLERNRLLSNELKLTLHGL | exon 9c | Tm5NM4, 7 | 68 | sheep polyclonal | Millipore AB5445 |
| y/9c | CERLYSQLERNRLLSNELKLTLHGL | exon 9c | Tm5NM4, 7 | this paper | mouse polyclonal (IgG1k) clone 3F8.2 | |
| y/9d | DKLKCTKEEH LCTQRMLDQTLLDLNEM | exon 9d | Tm5NM1, 2 | 60 | sheep polyclonal | Millipore AB5447 |
| y/9d | DKLKCTKEEH LCTQRMLDQTLLDLNEM | exon 9d | Tm5NM1, 2 | this paper | mouse monoclonal (IgG2bk)clone2G1002 | |
| LCI | First 10 amino acids of Human exon γ1b | exon 1b | human Tm5NM1, 2 | 63 | mouse monoclonal (IgG1) | |
| CG3 | AERLQREVEGERRAREQ | aa29–44 exon 1b | All nonmuscle products from the γTm gene |
61 64 |
mouse monoclonal (IgM) | |
| Antibody name TPM4 gene antibodies | ||||||
| δ/1b | DRAQGLQRELDGERERREK | exon 1b | Tm4 | this paper | mouse monoclonal | |
| WD4/9d | KEENVGLHQTLDQTLNEL | exon 9d | Tm4 | 60, 103 | rabbit polyclonal | Millipore AB5449 |
| LC24 | COOH terminal half of hTm4 | exon 9d | Human, rat Tm4 | 61, 62 | mouse monoclonal (IgG1) |
The initial evaluation on the specificity of the antibodies was performed by protein gel blot analysis on panels of recombinant Tm proteins. The corresponding cDNAs of rat (Tm1, 2, 3, 4, 5a, 5b, Br1, Br2, Br3 and Tm5NM1) and human (Tm1, 2, 3, 4, NM1, NM2, NM4, NM5, NM6, NM7) isoforms were cloned into the pPROEX HT prokaryotic or pET expression system and induction of protein was performed as described in Materials and Methods.
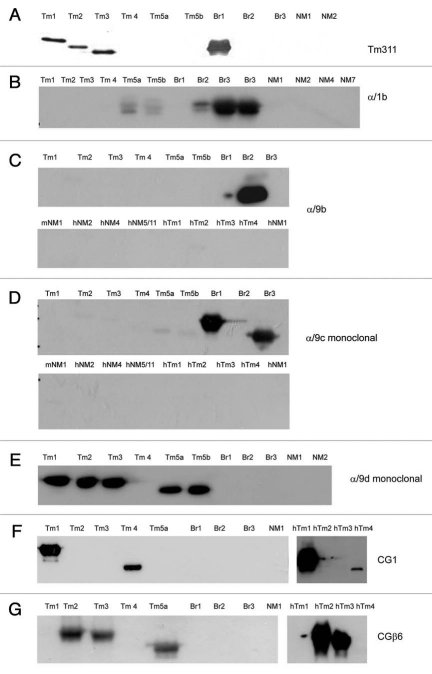
A total of 13 antibodies have been generated that detect Tm isoforms from the TPM1 and 2 genes with three of these Tm antibodies having been generated as both polyclonals and monoclonals. The epitope for the commercially available TM311 antibody has been mapped to exon 1a of the TPM1 gene and thus it detects the striated muscle isoform plus Tms 2, 3, 6, Br1 and Tm1 plus the striated muscle isoform from the TPM2 gene (Figs. 1 and 7A). Isoforms containing exon 1b (Tm5a, 5b, Br2 and Br3) are detected with the α/1b antibody (Fig. 7B). Antibodies with epitopes directed to the C-terminal exon of the αTm gene include the α/9b antibody specific for TmBr2 (Fig. 7C) and the α/9c (clone #554) which preferentially detects TmBr1 and TmBr3 (Fig. 7D). It is notable that α/9c does not see Tm5NM4 which contains exon 9c from the TPM3 gene. The α/9d antibody raised against a peptide directed to the entire exon 9d from the TPM1 gene has a high degree of specificity for Tm1, 2, 3, 5a and 5b and, we predict, Tm6 (Fig. 1). Although exons 9d from the TPM1, 3 and 4 genes have a high degree of similarity, the α/9d antibody exhibits no cross reactivity with either Tm4 from the TPM4 gene nor Tm5NM1 and Tm5NM2 from the TPM3 gene (Fig. 7E). The CG1 and CGβ6 antibodies were originally raised against chicken gizzard Tm.61 CG1 has strong reactivity to both rat and human Tm1 and also detects Tm4 (Fig. 7F). The epitope for the CGβ6 antibody has been mapped to the C-terminal end of human Tm2 and Tm3 62 and as expected it detects both human and mouse Tm2 and Tm3 and also shows weak reactivity with Tm5a (Fig. 7G).
Figure 7.
Evaluation of the specificity of TPM1 and TPM2 genes directed antibodies with bacterially produced Tm proteins. Protein gel blot analysis of 0.5 µg recombinant Tms probed with (A) TM311, (B) α/1b, (C) α/9b, (D) α/9c, (E) α/9d monoclonal, (F) CG1 and (G) CGβ6 antibodies.
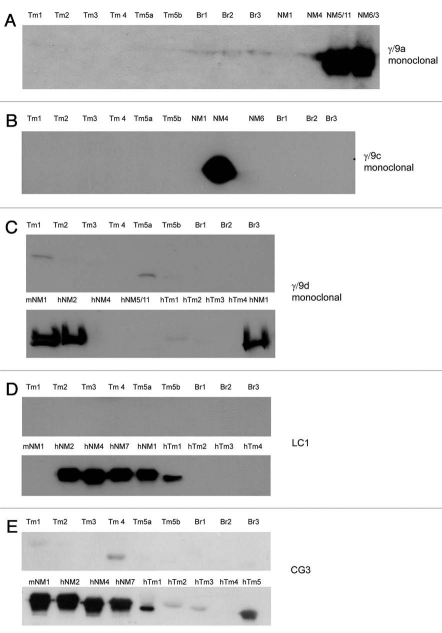
Peptide sequences corresponding to the alternatively spliced C-terminal exons of the TPM3 gene (exons 9a, 9c and 9d) were used to generate the γ/9a, γ/9c and γ/9d antibodies (Table 3). The characterization of these antibodies raised in sheep has been previously documented in reference 60. Here we report on the complementary antibodies generated using the identical peptide sequences but raised as mouse monoclonals. These three antibodies show the predicted isoform specificity (Fig. 8A–C). The γ/9d antibody does exhibit minor cross reactivity with Tm1, 2, 3, 5a and 5b (Fig. 8C). The LC1 antibody is shown to have a high degree of specificity for the human isoforms Tm5NM1, NM2, NM4 and 7 with no cross reactivity to the mouse Tm5NM1 (Fig. 8D). Although the epitope for this antibody is yet to be mapped our data and that reported by Sung et al. strongly indicate that it resides in the first few N-terminal end amino acids of the human exon 1b from the TPM3 gene. Amino acid sequence alignment demonstrates that the only amino acid difference between the mouse/rat and human sequences is the fourth amino acid, isoleucine in human and serine in mouse and rat (Fig. 4). We expect that this residue must be in the LC1 epitope. The CG3 antibody with its epitope mapped to exon 1b amino acids 29–44 64 detects all the cytoskeletal products from this gene both human and mouse (Fig. 8E). It has also been found to detect the striated muscle isoform from this gene via cross reaction with the TPM3 exons 1a or 2b.65
Figure 8.
Evaluation of the specificity of TPM3 gene directed monoclonal antibodies with bacterially produced Tm proteins. Protein gel blot analysis of 0.5µg recombinant Tms probed with (A) γ/9a, (B) γ/9c, (C) γ/9d, (D) LC1 and (E) CG3 antibodies.
Figure 4.
Amino acid sequence comparison of the TPM3 gene from six animal species. Amino acid alignment of all exons contained within the TPM3 gene for selected members of chordata. Species included are human (Homo sapiens), mouse (Mus musculus) and rat (Rattus norviegicus) representing mammalians, chicken (Gallus gallus) representing birds, western clawed frog (Xenopus tropicalis) representing amphibians and zebrafish (Danio rerio) representing fish. Shaded areas and consensus sequence indicate regions of sequence conservation while unshaded regions represent areas of sequence divergence between the aligned species. Dashed lines within alignments imply that either the particular exon is not found within that species or that the exon in question has not been identified due to minimal genomic sequence information and lack of evidence from cDNA library sequences. Antibody epitopes and immunogens for antibodies LC1, CG3, γ/9a, γ/9c and γ/9d are presented as white text highlighted in red and are aligned with the region of the exon from which they were derived.
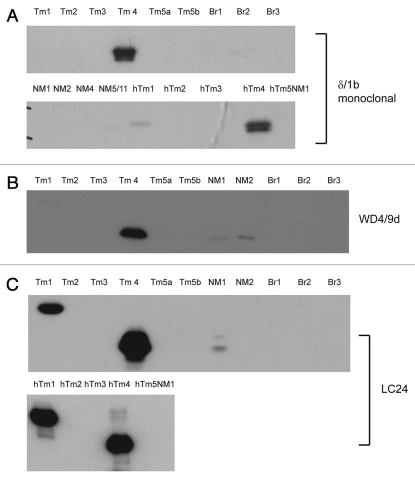
The antibodies known to specifically detect the cytoskeletal Tm4 isoform from the TPM4 gene are δ/1b, WD4/9d and LC24. The δ/1b antibody was raised against the last 19 amino acids of exon 1b from the TPM4 gene. This antibody is shown to detect both rat and human Tm4 and shows no cross reactivity to other exon 1b containing isoforms from the other Tm genes (Tm5a, 5b, Br2, Br3, NM1, NM2, NM4, NM7) (Fig. 9A). It does however, show weak reactivity with human Tm1. The WD4/9d generated in rabbit using a partial amino acid sequence from exon 9d of the TPM4 gene has been previously characterized.60 It detects Tm4 but does cross react with Tm1 from the βTm gene (on a longer exposure, data not shown), and also Tm5NM1 and Tm5NM2 from the γTm gene (Fig. 9B). The LC24 was generated against bacterially produced human Tm4 with only the C-terminal end used.62 This antibody detects both rat and human Tm4 but also cross reacts with Tm1 from the TPM2 gene (Fig. 9C).
Figure 9.
Evaluation of the specificity of TPM4 gene directed antibodies with bacterially produced Tm proteins. Protein gel blot analysis of 0.5 µg recombinant Tms probed with (A) δ/1b, (B) WD4/9d and (C) LC24 antibodies.
The use of Tm antibodies to identify the Tm isoform expression profiles in cell lines and mouse tissues.
The selective repertoire of Tm isoform expression, including the number and type of isoforms expressed in different cell types is strictly regulated by as yet not fully understood mechanisms. Tm isoform expression profiles in different cell types have previously been reviewed in reference 6. Here we report the use of the Tm antibodies described above to profile isoform expression in three different cell types from three different mammalian species, human, mouse and rat and further evaluate the specificity of these tools. On a SDS PAGE gel the HMW Tm isoforms have an apparent molecular weight of 34 to 40 kDa and the LMW isoforms of 28 to 33 kDa. Migration of Tms in SDS gels is not predictable based on MW and in our experience, optimal resolution of Tm isoforms is best achieved on SDS-PAGE gels with a low concentration of bisacrylamide (12.5% acrylamide and 0.1% bisacrylamide).66 The antibodies known to detect isoforms from the TPM1 and TPM2 genes including TM311, α/9d, 1 and CGβ6 all perform well on total protein lysates isolated from cell lines (Fig. 10). The initial observation made on the protein gel blots is the differences in the profiles of isoforms and the quantitative amounts expressed by the three cell lines. Both the human and mouse cell lines express Tm1 as detected with the TM311, α/9d and CG1 antibody (Fig. 10A, C and D). The rat B35 cells show no evidence of Tm1 or Tm3 expression whereas Tm2 and Tm3 are detected in both the human and mouse cells and only Tm2 in the rat B35 cells (Fig. 10A and E). The α/1b antibody detects very low levels of Tm5a and Tm5b but there is also reactivity with unknown bands (Fig. 10B). Antibodies directed to Tm isoforms enriched in brain tissue (TmBr1, Br2 and Br3) and smooth muscle (Tm6) were as predicted absent from these cell lines (data not shown).
Figure 10.
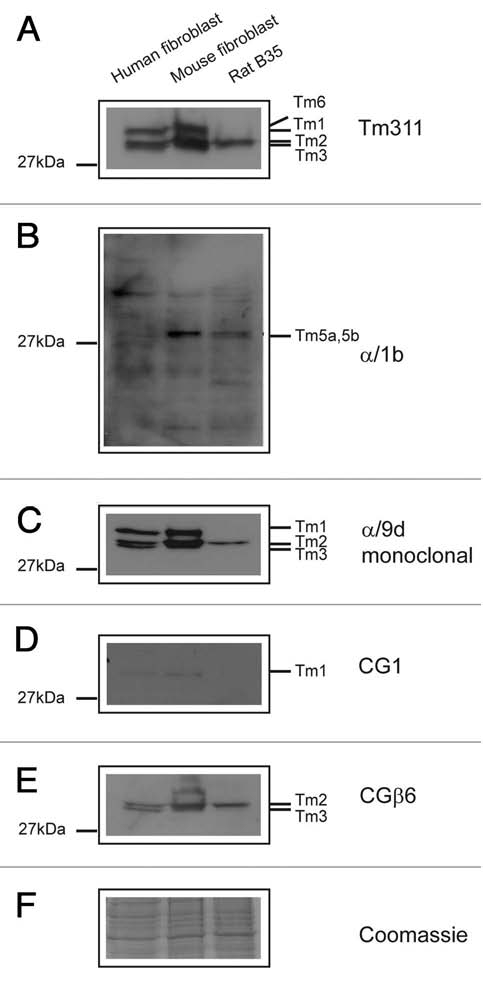
Expression of Tm isoforms coded by the TPM1 and TPM2 genes in three cell lines. Equal loading (20 µg) of total cellular protein isolated from human primary fibroblasts, mouse primary fibroblasts and rat neuroblastoma B35 cells, was electrophoresed on 12.5% SDS gel and individual protein gel blots probed with the (A) TM311, (B) α/1b, (C) α/9d, (D) CG1 and (E) CGβ6 antibodies. The Coomassie Blue stained gel (F) demonstrates equal protein loading.
All the TPM3 antibodies tested on the cell lines were found to detect the expected cytoskeletal LMW isoforms coded by the gene (Fig. 11). The abundance of isoforms detected with the γ/9a antibody was found to be low as a very long exposure time was used to generate the blot shown in Figure 11A. Some additional unknown bands were also detected. The γ/9d antibody detects the predicted 30 kDa corresponding to Tm5NM1/NM2 in all the cell lines (Fig. 11B). As expected the LC1 antibody, like CG3, detects a band in all the human cell lines as its epitope is in exon 1b, but CG3 also sees the same band in mouse and rat unlike LC1 which is human specific (Fig. 11C). The exon 9c containing isoforms identified with the γ/9c antibody were found to be undetected by protein gel blotting (data not shown). Exon 9c containing isoforms are primarily detected in central nervous system cells.67,68
Figure 11.
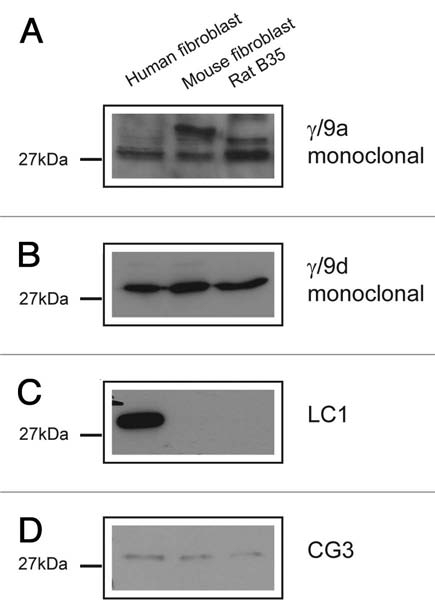
Expression of Tm isoforms coded by the TPM3 gene in three cell lines. Equal loading (20 µg) of total cellular protein isolated from human primary fibroblasts, mouse primary fibroblasts and rat neuroblastoma B35 cells, was electrophoresed on 12.5% SDS gels and individual protein gel blots probed with the (A) γ/9a, (B) γ/9d, (C) LC1 and (D) CG3 antibodies.
Analysis of expression of the cytoskeletal Tm4 isoform with the δ/1b, WD4/9d and LC24 antibodies is shown in Figure 12. The δ/1b is very specific to Tm4 (Fig. 9A). In contrast, the WD4/9d detects in addition to Tm4 a HMW isoform predicted to be Tm1 (Fig. 12B) which is relatively abundant in the human and mouse cells, as seen with the TM311 and α/9d antibodies (Fig. 10A and C). Surprisingly, the LC24 antibody detects Tm4 in human and rat cells but not in the mouse fibroblasts. Further confirmation of the failure of this antibody to detect the mouse cytoskeletal Tm4 isoform is demonstrated in other mouse cells later in this report.
Figure 12.
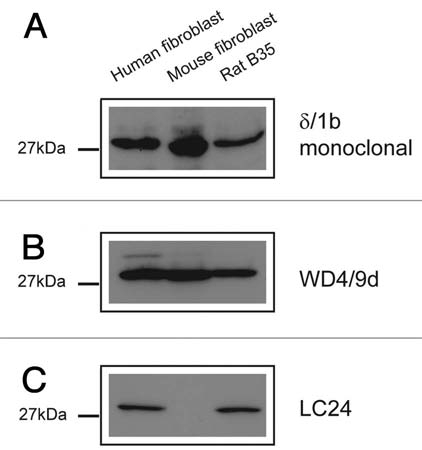
Expression of Tm isoforms coded by the TPM4 gene in three cell lines. Equal loading (20 µg) of total cellular protein isolated from human primary fibroblasts, mouse primary fibroblasts and rat neuroblastoma B35 cells, was electrophoresed on 12.5% SDS gels and individual protein gel blots probed with the (A) δ/1b, (B) WD4/9d and (C) LC24 antibodies.
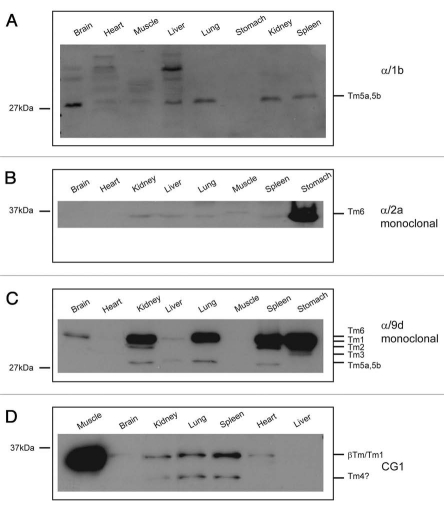
Total protein lysates were generated from both mouse and rat tissues and probed with the Tm antibodies described above. Even though individual tissues are comprised of many different cell types the expression of the major Tm isoforms expressed can be evaluated by protein gel blot analysis. The sheep α/1b antibody detects a prominent band of about 30 kDa in brain, liver, lung, kidney and spleen (Fig. 13A). Since the isoforms detected by this antibody all have similar or the same apparent molecular weights, it is difficult to distinguish whether they correspond to Tm5a, 5b or Br3. Comparison of the Tm expression profile generated with the use of the α/9d antibody shows that Tm5a/5b are most abundant in kidney, liver, lung and spleen whereas these isoforms are undetected in the adult brain at the level of sensitivity of protein gel blotting (Fig. 13C). Hence, we can deduce that the α/1b antibody is detecting TmBr3 in the brain. TmBr3 is one of the major isoforms expressed in mature neurons.69–71
Figure 13.
Expression profile of Tm isoforms coded by the TPM1 and 2 genes in a panel of mouse tissues. Equal loading (20 µg) of total cellular protein isolated from different mouse and rat tissues was electrophoresed on 12.5% SDS gels and individual protein gel blots probed with the (A) α/1b, (B) α/2a, (C) α/9d and (D) CG1 antibodies.
The α/2a monoclonal antibody is raised against a peptide that corresponds to the unique exon 2a found only in the TPM1 gene. Exon 2a containing isoforms are the Tmsmα also known as Tm6 in addition to hTmsmα-1 and hTmskα1-1 identified in human tissues.42 The Tmsmα (Tm6) and hTmsmα-1 are enriched in smooth muscle such as placenta, uterus42 and stomach (Fig. 13B). The expression of the exon 2a containing isoform(s) is highly enriched in mouse stomach (Fig. 13B). Note also the slower mobility of the exon 2a containing isoform in skeletal muscle; possibly Tmskα1-1 (Figs. 1 and 13B).
The monoclonal antibody α/9d was raised against a peptide corresponding to the entire exon 9d of the TPM1 gene with predicted recognition of isoforms Tm1, 2, 3, 5a, 5b and 6. On a panel of mouse tissues, the expression of the HMW isoforms Tm1/6 are most highly enriched in the kidney, lung, spleen and stomach (Fig. 13C). Significant levels of Tm2 are detected in kidney, spleen and stomach and on a longer blot exposure (data not shown) Tm2 is also detected in lung. Expression of Tm3 was limited to the stomach sample. The LMW isoforms Tm5a/5b were enriched in the kidney, lung and spleen and to a lesser extent in the brain, liver and stomach, seen only on a longer exposure (data not shown).
The CG1 antibody, shown in Figure 7F to detect Tm1 but also cross-reacts with Tm4, detects a prominent HMW band in skeletal muscle most likely to correspond to βTm (Fig. 13D). In the kidney, lung and spleen the prominent HMW band most likely corresponds to Tm1 as Tm1 detected with the α/9d antibody is highly expressed in these tissues (Fig. 13D compared to C). The brain and heart also show a faint HMW band and both tissues also express Tm1 but at relatively lower levels (Fig. 13D compared to C). A LMW band is also detected in the kidney, lung and spleen (Fig. 13D). This may correspond to Tm4, as later shown, these tissues express relative high levels of Tm4 detected with the two antibodies (Fig. 15A and C).
Figure 15.
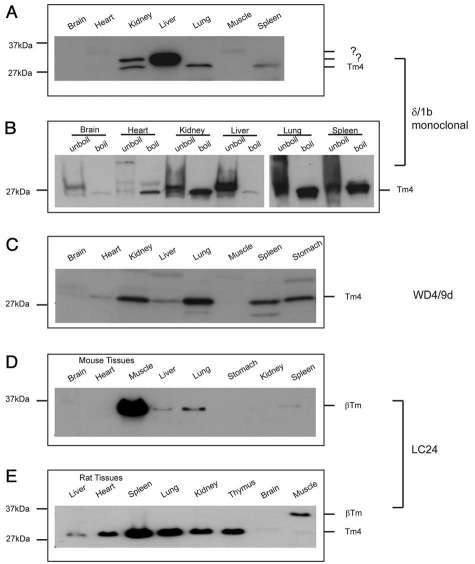
Expression profile of Tm isoforms coded by the TPM4 gene in a part of mouse and rat tissues. Equal loading (20 µg) of total cellular protein isolated from different mouse (A–D) and rat (E) tissues was electrophoresed on 12.5% SDS gels and individual protein gel blots probed with the (A and B) δ/1b, (C) WD4/9d and (D and E) LC24 antibodies. For part (B) the tissues were either unboiled or boiled in order to enrich for Tm.
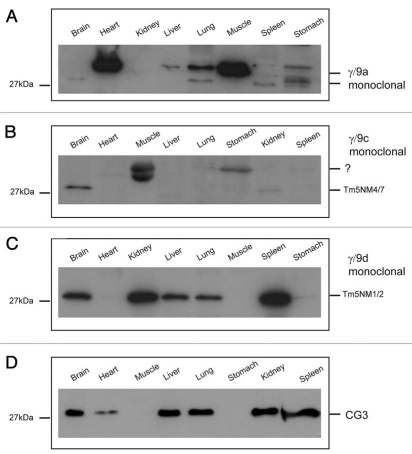
There are four antibodies designed to identify Tm isoforms from the TPM3 gene. The γ/9a, γ/9c, γ/9d mouse monoclonal antibodies detect isoforms containing C-terminal exons 9a, 9c and 9d respectively. The CG3 antibody detects all the exon 1b containing isoforms. In the heart and skeletal muscle the γ/9a antibody detects a prominent band of 36 kDa corresponding to the exon 9a containing muscle isoforms from the TPM1, 2 and 3 genes with liver, lung and stomach expressing relatively lower levels of HMW isoform(s) (Fig. 14A). In the brain, lung, spleen and stomach the LMW, 30 kDa, cytoskeletal exon 9a containing isoforms, may correspond to either Tm5NM5/11 or NM6/3. Stomach shows a doublet at 30 kDa which may correspond to NM8 and/or 9. Tm5NM8 and 9 result from splicing of exon 9a to 9c and result in an extension of 5 additional amino acids derived from exon 9c.33 Attempts to generate an antibody to this sequence have thus far been unsuccessful. The γ/9c antibody detects a 30 kDa band in brain, either NM4 or 7 and cross reacts with an unknown HMW band in muscle and stomach (Fig. 14B). The γ/9d antibody that preferentially reacts with NM1 and NM2 detects a 30 kDa band in brain, kidney, liver, lung and spleen (Fig. 14C) and on a longer exposure NM1/NM2 can also be detected in the heart, skeletal muscle and stomach (data not shown). The CG3 antibody detects all the LMW cytoskeletal exon 1b containing isoforms from the TPM3 gene and a 30 kDa band is seen in all the mouse tissues (Fig. 14D) except in the gastrocnemius muscle used in this panel, even on a longer exposure (data not shown). However, the CG3 antibody does detect a 34 kDa band in extraocular and soleus, corresponding to the αsTm from the TPM3 gene.65
Figure 14.
Expression profile of Tm isoforms coded by the TPM3 gene in a panel of mouse tissues. Equal loading (20 µg) of total cellular protein isolated from different mouse tissues was electrophoresed on 12.5% SDS gels and individual protein gel blots probed with the (A) γ/9a, (B) γ/9c, (C) γ/9d and (D) CG3 antibodies.
The TPM4 gene together with the TPM2 gene are the least alternatively spliced genes, each known to code for only two isoforms. We have generated two antibodies raised against peptides within the N-terminal end, exon 1b and the C-terminal end, exon 9d. On a panel of mouse tissues, the LMW Tm4 isoform, identified with the δ/1b antibody, is abundantly expressed in kidney, lung and spleen (Fig. 15A), on a longer blot exposure a band can been seen in muscle and stomach (data not shown). There is however the presence of a slightly higher MW band seen at significant levels in the liver. In order to confirm that this unknown band corresponds to Tm, we took advantage of the fact that Tm is a heat stable protein. Following the enrichment of Tm by heating the tissues to 95°C for 10 min (see Materials and Methods) we found that the HMW bands seen in kidney and liver were now absent (Fig. 15B). We conclude that δ/1b is detecting non-Tm proteins in mouse tissues. WD4/9d predominantly detects the LMW Tm4 isoform in all tissues examined even in brain and muscle on a longer exposure (not shown) (Fig. 15C). The LC24 was shown to detect both the human and rat Tm1 and Tm4 recombinant proteins (Fig. 9B) however it failed to detect the Tm4 in mouse protein lysates (Fig. 12C). Similarly, in the case of the mouse tissues the LC24 does not detect the LMW cytoskeletal Tm4 isoform (Fig. 15D). However, a HMW band is seen which in mouse we predict to be βTm whereas in liver, lung and spleen it may correspond to Tm1 (Fig. 15D). Surprisingly, in the rat tissues the LC24 antibody detects primarily Tm4 and a HMW isoform in muscle (Fig. 15E).
Some of the Tm antibodies described above have been successfully used to perform immunoprecipitations. These include LC1 and WSα/9c,16 anti-sheep α/2a and CG1 72 and TM311.73
In summary, one of the major limitations in evaluating the Tm isoform composition in either cell lines or tissues is the similarity in the apparent molecular weights when 1-D gel electrophoresis is performed. 2-D electrophoresis may allow for the identification of additional LMW isoforms as some display distinct pI values (Table 4). In some cases quantitative PCR will be the best methodology to assess the presence and quantity of different Tm isoforms, albeit at the mRNA level.
Table 4.
Theoretical isoelectric focusing points
| Tm isoform | Apparent molecular weights on SDS PAGE gels (kDa) | Theoretical pI |
| Tm6 | 40 | 4.70 |
| Tm1 | 38 | 4.63 |
| Tm2 | 36 | 4.69 |
| Tm3 | 34 | 4.69 |
| Tm5a | 30 | 4.74 |
| Tm5b | 30 | 4.75 |
| TmBr1 | 34 | 4.69 |
| TmBr2 | 30 | 4.84 |
| TmBr3 | 30 | 4.74 |
| Tm5NM1 | 30 | 4.72 |
| Tm5NM2 | 30 | 4.73 |
| Tm5NM5/1 | 30 | 4.71 |
| Tm5NM6/3 | 30 | 4.69 |
| Tm5NM4 | 30 | 4.79 |
| Tm5NM7 | 30 | 4.81 |
| Tm5NM8 | 30 | 4.71 |
| Tm5NM9 | 30 | 4.69 |
| Tm4 | 30 | 4.65 |
ExPASy Proteomics server (http://expasy.org/tools/pi_tool.html) was utilized to determine the theoretical pI value.
Tm isoforms mark distinct actin filament populations.
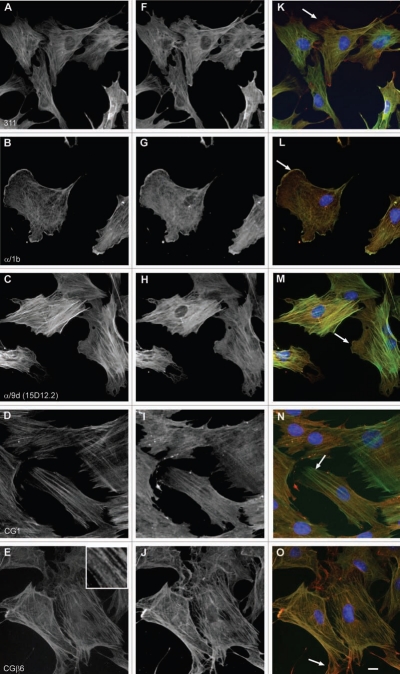
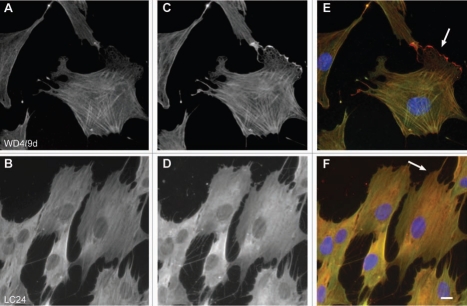
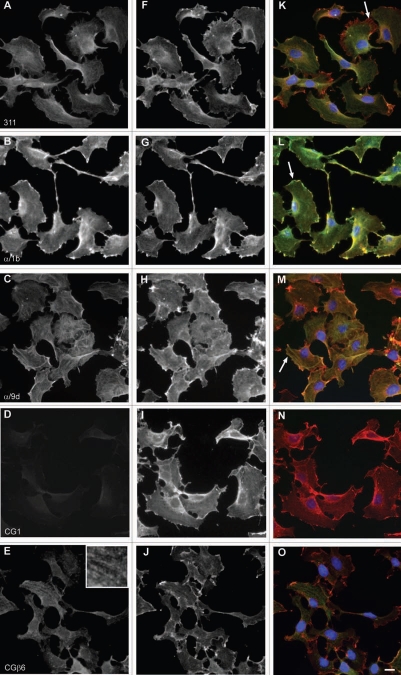
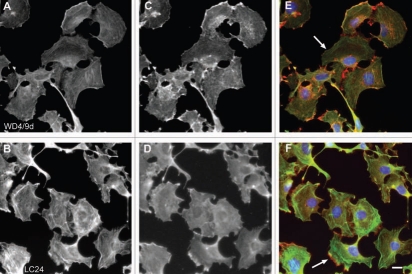
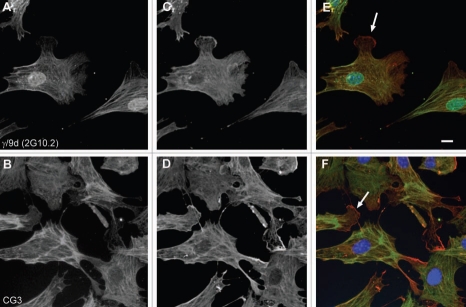
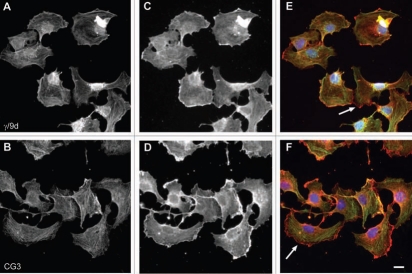
Distinct intracellular subcellular sorting of different Tm isoforms has to date been documented in various cell model systems both in vitro and in vivo (reviewed in refs. 1 and 7). This observed sorting of Tm isoforms implies the existence of distinct populations of actin filaments, marked by Tm isoforms, influencing the dynamics and organization properties of the filaments.1 In order to further evaluate the performance of the Tm antibodies described above, immunofluorescence staining was performed on two cell lines, normal and tumor cells, mouse primary embryonic fibroblasts and the neuroblastoma B35 cells, respectively. The choice of cells is based on the fact that these cells (1) display in the case of the mouse primary fibroblasts, a well organized actin cytoskeleton,60 (2) exhibit specific structures such as ruffling membrane and filopodial, (3) according to Figures 10–12 express various Tm isoforms and (4) represent two commonly used cell types. At the level of resolution of an epifluorescence microscope, a clear localization of Tm to actin stress fibers was far more evident in the normal mouse primary embryonic fibroblasts than in the neuroblastoma B35 cells (compare Figs. 16–18 to 19–21). Subtle differences among the Tm antibodies consist primarily on whether the staining for the Tms extends to the periphery of the cell and the intensity of staining, reflecting the levels of expression. Comparison of the staining patterns of the TM311 (Tm1, 2, 3, 6, Br1) with the α/1b (Tm5a, 5b, Br2, Br3) antibodies demonstrates the diminished staining of TM311 at the periphery of the cell whereas the α/1b extends and is enriched at the cell periphery, seen in both the mouse fibroblasts (Fig. 16K compared to L, arrows) and rat B35 cells (Fig. 19K compared to L, arrows). This observed staining strongly suggests that Tm5a/5b are peripherally enriched isoforms and this correlates with the apical enrichment of these isoforms in epithelial cells.74 Similarly, the α/9d antibody which detects the HMW Tms, 1, 2, 3, 6 and the LMW Tm5a, 5b is also seen to extend to the cell periphery in mouse fibroblasts (Fig. 16M, arrow) and B35 cells (Fig. 19M and arrow) although not as dramatically as for the α/1b antibody. The CG1 (Tm1) antibody detects prominent stress fibers in the mouse fibroblasts (Fig. 16D and N, arrow) and staining is absent in the B35 cells (Fig. 19N). The CGβ6 (Tm2, 3) antibody is seen to detect stress fibers with a striated appearance most prominent in the B35 cells (Figs. 16E and 19E, see inset). Both the γ/9d (Tm5NM1, NM2) and CG3 (all TPM3 cytoskeletal products) antibodies detect stress fibers and no enrichment of staining is seen at the cell periphery (Fig. 17E, F and 20E and F, arrows). The WD4/9d antibody identifies stress fibers best seen in the mouse fibroblasts as compared to the B35 cells (Fig. 18E compared to 21E) and staining is reduced at the cell periphery, most apparent in the mouse fibroblasts (Fig. 18E, arrow). Finally, the LC24 antibody exhibits stress fiber staining in the human immortal fibroblasts and B35 cells (Figs. 18F and 21F) while no staining was detected in the mouse fibroblast cells (data not shown). There is a significant difference in the pattern of LC24 staining seen between the human immortal cells and the B35 cells, with a more even intensity of staining seen in the immortal cells while in the B35 cells the staining is significantly diminished at the cell periphery (Fig. 18F compare to 21F, arrows).
Figure 16.
Immunofluorescence staining of mouse primary embryonic fibroblasts with antibodies directed to Tm isoforms coded by the TPM1 and TPM2 genes. (A–E) Tms in green, (F–J) γactin in red and (K–O) merge images. Nuclei were visualized with DAPI. Arrows in (K–O) denote the cell periphery and in (N) stress fibers. Bar = 10 µm.
Figure 18.
Immunofluorescence staining of fibroblasts with antibodies directed to Tm isoforms coded by the TPM4 gene. (A and B) Tms in green, (C and D) γactin in red and (E and F) merge images. Nuclei were visualized with DAPI. (A, C and E) correspond to mouse fibroblasts and (B, D and F) human immortalized fibroblast cells. Arrows in (E and F) denote the cell periphery. Bar = 10 µm.
Figure 19.
Immunofluorescence staining of B35 cells with antibodies directed to Tm isoforms coded by the TPM1 and TPM2 genes. (A–E) Tms in green, (F–J) γactin in red and (K–o) merge images. Nuclei were visualized with DAPI. Arrows in (K–M) denote the cell periphery. Bar = 10 µm.
Figure 21.
Immunofluorescence staining of B35 cells with antibodies directed to Tm isoforms coded by the TPM4 gene. (A and B) Tm in green, (C and D) γactin in red and (E and F) merge images. Nuclei were visualized with DAPI. Arrows in (E and F) denote the cell periphery. Bar = 10 µm.
Figure 17.
Immunofluorescence staining of mouse primary embryonic fibroblasts with antibodies directed to Tm isoforms coded by the TPM3 gene. (A and B) Tms in green, (C and D) γactin in red and (E and F) merge images. Nuclei were visualized with DAPI. Arrows in (E and F) denote the cell periphery. Bar = 10 µm.
Figure 20.
Immunofluorescence staining of B35 cells with antibodies directed to Tm isoforms coded by the TPM3 gene. (A and B) Tms in green, (C and D) γactin in red and (E and F) merge images. Nuclei were visualized with DAPI. Arrows in (E and F) denote the cell periphery. Bar = 10 µm.
In conclusion, at the level of resolution of an epifluorescence microscope the major differences among the various Tm antibody staining patterns was their enrichment at the cell periphery. In addition, subtle differences among the different cell types, normal and immortal fibroblasts, were observed.
Subcellular localization of individually tagged Tm isoforms.
One of the major drawbacks of using the Tm antibodies to evaluate the subcellular localization of Tms is that the majority of antibodies do detect several isoforms. In order to investigate the intracellular localization of individual Tm isoforms, specific isoforms have been cloned into plasmids containing YFP or GFP (yellow or green fluorescence protein) or hemagglutinin (HA) tags (Table 5). Surprisingly, the addition of a 27 kDa YFP or GFP protein to the N-terminal end appears not to interfere with the head-to-tail association of the Tm dimers, as these tagged proteins are quite capable of forming polymer like structures that colocalize with actin filaments.75 In addition, YFP.Tm5NM1 has been shown to have a direct role in cell migration as its expression in Tm5NM1 null cells rescued the phenotype further demonstrating the functionality of tagged Tms.76 The concern encountered with transfection studies is the fidelity of sorting, as overexpression of these tagged isoforms may lead to the saturation of pools and hence inappropriate subcellular localization. However, recent studies in U2OS cells have shown remarkable fidelity of sorting of these tagged Tms.21
Table 5.
Expression of fluorescently tagged Tm isoforms to study intracellular localization
| Tm isoforms | Cell type and intracellular localization | Reference |
| HA-Tm1, 2, 3, 4, 5NM1 GFP-Tm1, 2, 3, 4, 5NM1 | Both HA and GFP tagged Tms were found in stress fibers and extended into the lamellipodia and filopodia of spreading cells. HA-Tm4 and Tm5NM1 are more enriched in the lamellipodia region than the other Tms. Rat mammary adenocarcinoma MTLn3 and REF cells. | 104 |
| GFP-muscle αTm, Tm1, Tm2, Tm3, Tm4, Tm5a, Tm5NM1 | All except for Tm4 incorporated into sarcomeres. Incorporation of Tm4 into sarcomeres was dependent on the presence of the other Tms. Neonatal rat cardiomyocytes. | 105 |
| YFP-Tm3, Tm5NM1 GFP-Tm5b | Tm3 was found to be less abundant at the cell periphery compared to Tm5b and Tm5NM1. C2C12 mouse myoblasts. |
75 |
| YFP-Tm1, 3, 4, 5NM1, 5NM2 GFP-Tm2 | Each isoform associated with transverse arcs and ventral stress fibers. Within dorsal fibers, Tm2 was found along the entire fiber, whereas Tm1, Tm5NM1 and Tm5NM2 concentrated at the distal ends. Tm3 and Tm4 localized proximally to focal adhesions. Live cell imaging of newly forming focal adhesion shows the presence of Tm5NM2 followed by Tm2. Human osteosarcoma U2OS cells. |
21 |
Overexpression and targeted gene siRNA knockdown in vitro based methods to study Tm isoform specific function.
In order to evaluate the biological function of the different Tm isoforms, overexpression (Table 6) and siRNA knockdown (Table 7) methodology has been employed. The overexpression studies have shed light on the importance of Tm isoforms in defining the organizational properties and molecular composition of actin filaments ultimately influencing the overall morphology of cells.16,21,77–80 In addition, overexpression studies complemented with targeted gene siRNA knockdown experiments have demonstrated the importance of specific Tm isoforms in regulating the structure and dynamic properties of focal adhesions.76,81 Finally, recent siRNA knockdown experiments have played an important role in establishing the nonredundant roles of Tm isoforms in stress fiber assembly.21
Table 6.
Summary of genetically modified cell lines
| Parental Line | Tm isoform | Reference |
| B35 rat neuroepithelial | Rat TmBr1, stable overexpression | 81 |
| B35 rat neuroepithelial | Rat TmBr3, stable overexpression | 16, 81 |
| B35 rat neuroepithelial | Rat Tm3, stable overexpression | 79, 106 |
| B35 rat neuroepithelial | Human Tm5NM1, stable overexpression | 16, 76, 106, 107 |
| RAW264.7 mouse macrophage | Mouse Tm2, stable overexpression | 78 |
| RAW264.7 mouse macrophage | Mouse Tm3, stable overexpression | 78 |
| RAW264.7 mouse macrophage | Mouse Tm4, stable overexpression | 77 |
| Primary Mouse Embryonic Fibroblasts | Mouse Cells isolated from the 129-Tpm3Tm1(neo;Δ9d)Pgun Lack Tm5NM1 and NM2 |
76, 90 |
Table 7.
Summary of published knock-down siRNA sequences
| Tm isoform | Gene/exon | Species | Sequence | Reference |
| Tm5NM1, Tm5NM2 | TPM3 gene: exon 9d | Human | siRNA: 5′-AAA GAG GAG CAC CTC TGT ACA tt-3′ (sense) | 76, 106 |
| Tm2/3 | Tpm1: exons 1a and 2b | Mouse | siRNA1: 5′-AAC UCA AGG GCA CUG AAG Att-3′ (sense) siRNA2: 5′-GAU GCU GAA GCU CGA CAA Att-3′ (sense) |
78 |
| Tm4 | Tpm4: 3′ UTR | Mouse | siRNA1: 5′-CCC AGA GCA AAA AUU AAC Att-3′ (sense) siRNA 2: 5′-CCU ACU CUG UUC UUU ACG Utt-3′ (sense) |
77 |
| Tm1 | TPM2 | Human | 5′-AAG CAC ATC GCT GAG GAT TCA-3′ | 21 |
| Tm2/3 | TPM1 | Human | 5′-AAG CTG GAG CTG GCA GAG AAA-3′ | 21 |
| Tm5NM1/2 | TPM3 | Human | 5′-AAA AGC TGG AAG AAG CTG AAA-3′ | 21 |
| Tm4 | TPM4 | Human | 5′-AAT TAA ACT TCT GTC TGA CAA-3′ | 21 |
The development of mouse models to study tropomyosin.
The primary objective for the generation of Tm gene modified mice has been to study the disease process of various human myopathies. Mutations in both the TPM2 and TPM3 genes are associated with diseases of skeletal muscle such as nemaline myopathy, distal arthrogryposis and most recently “cap” disease. TPM1 gene mutations have been linked to familial hypertrophic cardiomyopathy and dilated cardiomyopathy (reviewed in refs. 82–84). The current mouse models that recapitulated these human myopathies are listed in Table 8. It is noteworthy to mention that although the Tm mutations linked to human diseases are known to exhibit clinical abnormalities mostly restricted to the heart and skeletal muscle, these mutations are present in exons shared by numerous other Tm isoforms (see Tables 2 and 3).85 All known cardiomyopathies carry mutations in Tm isoforms specific to the central nervous system including TmBr1, TmBr2 and TmBr3. In the skeletal muscle myopathies, mutations in the TPM3 gene occur in exons 3, 5 and 8 which are common to all the Tm isoforms (Tm5NM1-11) encoded by this gene. Hence, it is possible that these patients may also display uncharacterized pathologies in organs other than skeletal muscle or the heart. Unfortunately, in the case of the mouse models, it is not possible to address the impact that these Tm mutations may have in other organs since the altered Tms are expressed in a tissue-specific manner. The human skeletal muscle actin or the cardiac specific α-myosin heavy chain promoters were used to generate these transgenic mice.
Table 8.
Tm mouse models that recapitulate human myopathies
| Gene affected (Tm isoform) | Human myopathy | Comments | Reference |
| TPM3 (αTmslow carrying the Met9Arg mutation) | Nemaline myopathy | Human αTmslow carrying the Met9Arg mutation driven by the human skeletal muscle promoter. Mice exhibit late onset nemaline myopathy. |
108 |
| Tpm1 (αTm muscle isoform carrying the Asp175Asn mutation) | Familial hypertrophic cardiomyopathy | αTmfast carrying the Asp175Asn mutation driven by the cardiac specific α-myosin heavy chain promoter. the hearts exhibit a mild hypertrophic phenotype |
109 |
| Tpm1 (αTm muscle isoform carrying the Glu180Gly mutation) | Familial hypertrophic cardiomyopathy | αTmfast carrying the Glu180Gly mutation driven by the cardiac specific α-myosin heavy chain promoter. the hearts develop severe concentric hypertrophy with significant ventricular fibrosis and atrial enlargement that progressively increases from 2.5 months and results in death between 4.5 and 6 months. |
110 |
| Tpm1 (αTm muscle isoform carrying the Glu54Lys mutation) | Dilated cardiomyopathy | αTmfast carrying the Glu54Lys mutation driven by the cardiac specific α-myosin heavy chain promoter. Recapitulates dilated cardiomyopathy and mice exhibit changes in myofilament Ca2+ sensitivity. |
111 |
Various other genetically modified mouse models have been generated primarily to dissect the functional differences among the isoforms and are listed in Table 9. The knockout mouse models reveal that the Tm genes are essential for life as deletion of the TPM1, 2 and 3 genes are embryonic lethal and offer further evidence for the non-redundant nature of the mammalian Tm genes.84,86–89 To date, two transgenic mouse models exist that have overexpression of the cytoskeletal Tm isoforms, Tm3 and Tm5NM1, in major organs as the transgene is driven by the human β-actin promoter.90 The Tm3 transgenic mice demonstrate dystrophic features perhaps due to increase sensitivity to contractile-induced stress.65,91 In the case of the Tm5NM1/NM2 knockout mice, lack of these isoforms leads to T-tubule dysmorphology and altered skeletal muscle function.92 Both the Tm3 and Tm5NM1 transgenics together with the complementary Tm5NM1 knockout mice have become valuable resources for the isolation of primary embryonic cells such as neuronal and fibroblast cells. Primary cortical neurons isolated from these mice have revealed the importance of Tm isoforms in the development and maintenance of neuronal morphogenesis, previously only inferred from subcellular localization studies.16,80,93
Table 9.
Tm mouse models generated to study the functional differences among the isoforms
| Gene affected (Tm isoform) | Comment | Reference |
| Tpm1 (Tm3) | Rat Tm3 driven by the human β-actin promoter. The transgene causes alterations in Tm3-associated actin filaments, resulting in dystrophic features in some skeletal muscles and susceptibility to exercise-induced damaged and reduced neurite outgrowth in isolated cultured neurons. |
65, 80, 90, 91 |
| TPM3 (Tm5NM1) | Human Tm5NM1 driven by the human β-actin promoter. the transgene results in alterations in Tm5NM1-associated actin filaments that enhance neurite outgrowth in isolated cultured neurons. |
16, 80, 92 |
| Tpm3 (γTm muscle) | αTmslow driven by the cardiac specific α-myosin heavy chain promoter. No morphological abnormalities in the sarcomeres of the heart. However, physiological assessment of the hearts reveals a hyper dynamic effect on systolic and diastolic performance. |
112 |
| Tpm1 (αTm muscle) | αTmfast driven by the cardiac specific α-myosin heavy chain promoter. The hearts from these mice exhibit no morphological or physiological changes. |
110, 113 |
| Tpm2 (βTm muscle) | βTm driven by the cardiac specific α-myosin heavy chain promoter. No morphological or pathological alterations in cardiac morphology or sarcomeric structures are observed. However, there is an increase in the activation of the thin filament by strongly bound cross-bridges, an increase in the Ca2+ sensitivity and a decrease in the rightward shift of the Ca2+-force relation induced by cAMP-dependent phosphorylation. |
93,114, 115 |
| (Chimericα/βTm-1) | Chimera 1: αfTm:aa 1–257 and βTm: aa 258–284. Substitution of the carboxyl terminal end of αTm for that of βTm. Transgene driven by cardiac specific α-myosin heavy chain promoter. No morphological or pathological changes are observed in the hearts or myofibers. However, hearts exhibit functional alterations in cardiac performance with a decrease in their rates of contraction and relaxation. |
116 |
| (Chimeric α/βTm-3) | Chimera 3: replaces aa 175–190 of αfTm with the corresponding sequence in βTm. Transgene driven by cardiac specific α-myosin heavy chain promoter. No morphological or pathological changes are observed in the hearts. However, there were decreases in the maximum rates of contraction and relaxation. |
117 |
| (Chimeric α/βTm-2) | Chimera 2: replaces aa 175–190 and 258–284 of αfTm with the corresponding sequence in βTm. Transgene driven by cardiac specific α-myosin heavy chain promoter. Hearts exhibit abnormalities in cardiac performance, especially with decreases in their rates of contraction and relaxation. |
118 |
| Tpm3 (Deletion of all cytoskeletal products from the Tpm3 gene) | Targeted deletion of exon 1b from the Tpm3 gene eliminating all cytoskeletal products from this gene. Embryonic lethal. |
87 |
| Tpm3 (deletion of Tm5NM4 and Tm5NM7) | Targeted deletion of exon 9c from the Tpm3 gene eliminating Tm5NM4 and Tm5NM7. Histological examination of the brains from these mice reveals no gross morphological defect. |
119 |
| Tpm3 (deletion of Tm5NM1 and Tm5NM2) | Targeted deletion of exon 9d from the Tpm3 gene eliminating Tm5NM1 and Tm5NM2. Skeletal muscle from these mice have altered excitation-contraction coupling. Small impact on neurite outgrowth in isolated cultured neurons. Primary embryonic fibroblasts have altered motility properties. |
76, 90, 92, 93 |
| Tpm1 (deletion of the muscle αTm isoform from the Tpm1 gene) | Mice die between embryonic day 9.5 and 13.5 | 86 |
| Tpm2 (Deletion of the muscle βTm isoform from the Tpm1 gene) | Embryonic lethal. | 84, Rajan and Wieczorek, unpublished data |
Materials and Methods
Antibodies.
Table 3 lists the Tm antibodies used in this report. The most suitable dilutions for protein gel blot analysis for the affinity purified mouse monoclonal antibodies were as follows: TM311 (Cat# T2780, Sigma) at 1:500; α/2a at 1:1,000; α/9b; CH1 (Cat# T9283, Sigma) at 1:50; γ/9a at 1:500; γ/9c at 1:500; γ/9d at 1:500 and δ/1b at 1:1,000. We used the hybridoma supernatant for the following mouse monoclonal antibodies, CG1 at 1:100, CGβ6 at 1:100; LC1 at 1:250; CG3 at 1:250, LC24 at 1:100 and α/9c (clone#554, kind gift from Jim Lessard, Cincinatti Children's Hospital Medical Center, Ohio, USA) at 1/500 dilutions. The primary rabbit polyclonal WD4/9d was used at 1:500 dilution. The α/9d, γ/9a, γ/9c and γ/9d mouse monoclonal antibodies were generated by initial synthesis of a peptide conjugated to diphtheria toxin (Millipore). The α/2a, α/9b, γ/9a and δ/1b mouse monoclonal antibodies were generated by initial synthesis of a peptide conjugated to keyhole limpet hemocyanin (KLH) (ProMab Biotechnologies, Inc., CA USA). The secondary antibodies for protein gel blotting were anti-rabbit IgG horseradish peroxidise-linked whole antibody (from donkey) (Cat# NA9341ML) and anti-mouse IgG horseradish peroxidise-linked whole antibody (from sheep) (Cat# NA9311ML) (GE Healthcare). For immunofluorescence staining essentially the same dilution as that used for protein gel blotting was employed. The actin cytoskeleton was visualized by double immunostaining with the anti-sheep γactin antibody at 1:1,000 dilution.60 The secondary antibodies were alexa Fluor® 555 goat anti-rabbit IgG (H + L) (Cat# A-21428), alexa Fluor® 488 goat anti-rabbit (Cat# A-11008), alexa Fluor® 555 goat anti-mouse IgG (H + L) (Cat# A-21422) and alexa Fluor® 488 goat anti-mouse IgG (H + L) (Cat# A11001) and alexa Fluor® 555 donkey anti-sheep IgG (H + L) (Cat# A21436) (Invitrogen).
Recombinant Tms expression constructs.
The pPROEX HT prokaryotic expression system (Gibco BRL, Invitrogen; Melbourne, Australia) or the pET bacterial plasmid systems were used for the production of recombinant Tm isoform proteins. The Tm cDNAs (Tm2, 3, 5a, 5b and NM1 in pGEX plasmids) were originally supplied by D. Helfman and hTm1, hTm2, hTm3 and hTm4 in the pET bacterial plasmid system were supplied by J.J.C Lin. The remaining Tm isoforms made in-house were PCR amplified and cloned into the pPROEX HT vector using restriction enzymes engineered into the PCR primers. All Tm constructs were verified by sequencing. A protocol for induction of recombinant protein was as previously described in reference 60.
Cell culture.
Human immortalized embryonic fibroblasts were a gift from the Weinberg laboratory and cultured as previously described in reference 96. The primary mouse embryonic fibroblasts were isolated and cultured as previously described in reference 60. The rat neuroblastoma B35 cells were cultured as previously described in reference 16. The cells were maintained in DMEM, 10% fetal calf serum at 37°C humidified atmosphere with 5% CO2.
Enrichment of Tm protein by heat.
Mouse tissues were homogenized in 50 mM Tris-Cl, pH 8.0, a sample representing the unheated one was taken and the remainder heated to 95°C for 10 min. After cooling on ice the samples were centrifuged for 10 min at 13,000 g and the supernatant transferred to a clean eppendorf. The chloroform/methanol extraction protocol previously described in reference 97, was used to concentrate the samples. The protein pellets were solubilized in RIPA buffer (50 mM Tris, 150 mM NaCl, 5 mM EDTA, 1% Nonidet P-40, 0.1% SDS, 1% Na Deoxycholate) followed by estimation of the protein concentration.
Immunofluorescence staining.
For all the antibodies reported here, cells were washed gently three times with warm PBS, to avoid disrupting delicate structures such as ruffling membranes and/or filapodia, fixed with 4% paraformaldehyde in PBS for 15 min, washed three times with PBS and permeabilized with chilled methanol for 15 min. Non-specific binding was reduced by incubation with 2% fetal bovine serum for 1 h. Primary antibodies were diluted in PBS and incubated at room temperature for 1 h followed by three washes with 2% fetal bovine serum. The secondary antibodies, diluted at 1:1,000, were incubated in the dark for 1 h, washed three times with PBS and coverslip mounted using FluorSave™ Reagent (Calbiochem). If using this type of mounting media the coverslip must be completely sealed with nail polish. Nuclei were visualized with DAPI staining. Coverslips were examined using the AxioSkop 40 microsope (Carl Zeiss).
Gel electrophoresis and immunoblotting.
The preparation of total protein lysates from the cell lines and different mouse tissues and analysis by SDS PAGE gel electrophoresis is essentially as described in reference 60. Protein concentration was estimated using a BCA protein detection kit (Pierce; Rockford, IL) and equal protein loading was examined by staining the protein gel blots with 0.1% (w/v) Coomassie blue R350, 20% (v/v) methanol and 10% (v/v) acetic acid. A total of 0.5 µg of recombinant proteins, 10 µg of cell line and 20 µg of animal tissues lysates were loaded. Following the transfer of proteins to Immobilon-P PVDF membrane (Millipore Corp., Bedford, MA) for 2 h at 80 V, non-specific binding on the blot was blocked with 5% low-fat skim milk in TBS (100 mM Tris-Cl, pH 7.5, 150 mM NaCl) solution for 1 h. Primary and secondary [anti-rabbit, anti-sheep and anti-mouse Ig-conjugated horseradish peroxidise (GE Healthcare)] antibodies were incubated for 1 to 2 hr each, and 4 × 15 min washes with TTBS (TBS with 0.05% Tween 20) were carried out following each antibody incubation. The protein gel Lighting Chemiluminescence Reagent (PerkinElmer Life Sciences; Boston, MA) was used to develop the blots and blots were then exposed to Fuji X-ray Film (Kodak; Rochester, NY).
Concluding Remarks
Our current understanding of the functional significance of Tm in regulating the organizational properties and dynamic nature of the actin cytoskeleton has stemmed from the use of multiple valuable tools developed over the last few decades. This paper provides a summary of the information that is known for the four tropomyosin genes found in higher animals and an extensive list of the molecular tools and methods that have been compiled to aid in the study of these proteins. This paper has been approached from the point of view of a researcher/student who is unfamiliar with this family of proteins. We therefore, have included an overview of the evolution and regions of amino acid conservation between these genes from selected chordate species as well as information on alternative exon splicing, isoform diversity, and the ability of Tm to form distinct actin filament populations within a cellular environment. An attempt has also been made to clarify much of the misleading nomenclature (Table 2) and incorrect exon sequences that are frequently encountered when attempting to retrieve Tm sequences from online genomic and proteomic databases. The extensive list of Tm antibodies (Table 3) and fluorescently labeled Tm constructs Table 5) that have been profiled for this paper, as well as the functional characterization of specific Tm isoforms using transgenic and knockout mouse models (Table 8 and 9), will provide valuable reference information and aid in experimental work for any newcomer to this field.
We highlight the fact that due to the high degree of evolutionary conservation between Tms in vertebrate species, the tools presented in this paper are likely to be useful to researchers working with a wide range of animal models. A field of research where the work presented in this paper would be of particular value is in MALDI-TOF (matrix assisted laser desorption/ionization-time of flight) mass spectrometry. Fragmented protein samples which are analysed by MALDI-TOF mass spectrometry and then compared to peptide databases will often return numerous hits for Tms. Due to the high degree of similarity between the four Tm genes, determining specific Tm isoforms from MALDI-TOF data is difficult. We strongly advise that an alignment of all the peptides generated via this methodology should be performed. The use of Figures 2–5, which show the amino acid sequence alignment of the Tm genes from 6 animal species, should provide the exon structure and ought to narrow down the identification of the Tm isoform(s) of interest.
There are however, a lot of questions still to be answered regarding the function of this family of proteins and one of the most intriguing is whether actin filaments consist of homo-polymers of a specific Tm isoform. Eventhough muscle Tms can form homodimers, α and β Tms prefentially form stable α/β heterodimers in native muscle. The assembly preference of the cytoskeletal Tms still remains to be established in an in vivo setting (reviewed in ref. 94). The recent development of super high-resolution fluorescent microscopy techniques (e.g., PALM, STED microscopy, etc.,),95 may allow for a much clear discrimination of individual actin filaments populations defined by different Tm isoforms. This technology could also be used to define the molecular composition of actin filaments not only identifying the Tm isoform but potentially other actin binding/signalling proteins associating with a specific population of filaments.
Figure 3.
Amino acid sequence comparison of the TPM2 gene from six animal species. Amino acid alignment of all exons contained within the TPM2 gene for selected members of chordata. Species included are human (Homo sapiens), mouse (Mus musculus) and rat (Rattus norviegicus) representing mammalians, chicken (Gallus gallus) representing birds, western clawed frog (Xenopus tropicalis) representing amphibians and zebrafish (Danio rerio) representing fish. Shaded areas and consensus sequence indicate regions of sequence conservation while unshaded regions represent areas of sequence divergence between the aligned species. Dashed lines within alignments imply that either the particular exon is not found within that species or that the exon in question has not been identified due to minimal genomic sequence information and lack of evidence from cDNA library sequences. Antibody epitopes/immunogens for antibodies TM311, Tm1 (Prasad), δ/9d, γ/9d and α/9d are presented as white text highlighted in red. The Tm1 (Prasad) immunogen is designed to the TPM2 6a exon, whereas the other immunogens are designed to exons in other Tm genes. Shaded and unshaded areas within the immunogen sequence reflect sequence similarity and divergence with the corresponding sequence in the TPM2 gene.
Acknowledgments
We greatly appreciate the technical assistance of summer students Hui Foon Tan and Daniel Jin. We thank Anthony Kee for critical reading of the manuscript. This work was supported by grants to P.G. and G.S. by the National Health and Medical Research Council Australia and the ongoing support of the Oncology Children's Foundation. Some of Tm antibodies listed in Table 3 are commercially available from Millipore/Merk and yield revenue for the Oncology Research Unit.
Abbreviations
- Tm
tropomyosin
- GFP
green fluorescence protein
- YFP
yellow fluorescence protein
- LMW
low molecular weight
- HMW
high molecular weight
- RT-PCR
reverse transcription polymerase chain reaction
- UTR
untranslated region
- HA
hemagglutinin
- kDa
kilodalton
- aa
amino acid
References
- 1.Gunning P, O'Neill G, Hardeman E. Tropomyosin-based regulation of the actin cytoskeleton in time and space. Physiol Rev. 2008;88:1–35. doi: 10.1152/physrev.00001.2007. [DOI] [PubMed] [Google Scholar]
- 2.Staiger C, Hussey P. Actin and actin-modulating proteins. In: Hussey P, editor. Plant Cytoskeleton in Cell Differentiation and Development. Blackwell, Oxford: 2004. [Google Scholar]
- 3.Kandasamy MK, Burgos-Rivera B, McKinney EC, Ruzicka DR, Meagher RB. Class-specific interaction of profilin and ADF isovariants with actin in the regulation of plant development. Plant Cell. 2007;19:3111–3126. doi: 10.1105/tpc.107.052621. [DOI] [PMC free article] [PubMed] [Google Scholar]
- 4.Li XE, Tobacman LS, Mun JY, Craig R, Fischer S, Lehman W. Tropomyosin position on F-actin revealed by EM reconstruction and computational chemistry. Biophys J. 2011;100:1005–1013. doi: 10.1016/j.bpj.2010.12.3697. [DOI] [PMC free article] [PubMed] [Google Scholar]
- 5.Pittenger MF, Kazzaz JA, Helfman DM. Functional properties of non-muscle tropomyosin isoforms. Curr Opin Cell Biol. 1994;6:96–104. doi: 10.1016/0955-0674(94)90122-8. [DOI] [PubMed] [Google Scholar]
- 6.Schevzov G, O'Neill G. Tropomyosin gene expression in vivo and in vitro. Adv Exp Med Biol. 2008;644:43–59. [PubMed] [Google Scholar]
- 7.Martin C, Gunning P. Isoform sorting of tropomyosins. Adv Exp Med Biol. 2008;644:187–200. doi: 10.1007/978-0-387-85766-4_15. [DOI] [PubMed] [Google Scholar]
- 8.Gunning PW, Schevzov G, Kee AJ, Hardeman EC. Tropomyosin isoforms: divining rods for actin cytoskeleton function. Trends Cell Biol. 2005;15:333–341. doi: 10.1016/j.tcb.2005.04.007. [DOI] [PubMed] [Google Scholar]
- 9.Holmes KC, Lehman W. Gestalt-binding of tropomyosin to actin filaments. J Muscle Res Cell Motil. 2008;29:213–219. doi: 10.1007/s10974-008-9157-6. [DOI] [PubMed] [Google Scholar]
- 10.Ishikawa R, Yamashiro S, Matsumura F. Annealing of gelsolin-severed actin fragments by tropomyosin in the presence of Ca2+. Potentiation of the annealing process by caldesmon. J Biol Chem. 1989;264:16764–16770. [PubMed] [Google Scholar]
- 11.Ishikawa R, Yamashiro S, Matsumura F. Differential modulation of actin-severing activity of gelsolin by multiple isoforms of cultured rat cell tropomyosin. Potentiation of protective ability of tropomyosins by 83-kDa nonmuscle caldesmon. J Biol Chem. 1989;264:7490–7497. [PubMed] [Google Scholar]
- 12.Bernstein BW, Bamburg JR. Tropomyosin binding to F-actin protects the F-actin from disassembly by brain actin-depolymerizing factor (ADF) Cell Motil. 1982;2:1–8. doi: 10.1002/cm.970020102. [DOI] [PubMed] [Google Scholar]
- 13.Nishida E, Maekawa S, Sakai H. Cofilin, a protein in porcine brain that binds to actin filaments and inhibits their interactions with myosin and tropomyosin. Biochemistry. 1984;23:5307–5313. doi: 10.1021/bi00317a032. [DOI] [PubMed] [Google Scholar]
- 14.Ono S, Ono K. Tropomyosin inhibits ADF/cofilin-dependent actin filament dynamics. J Cell Biol. 2002;156:1065–1076. doi: 10.1083/jcb.200110013. [DOI] [PMC free article] [PubMed] [Google Scholar]
- 15.Kovar DR, Sirotkin V, Lord M. Three's company: the fission yeast actin cytoskeleton. Trends Cell Biol. 2011;21:177–187. doi: 10.1016/j.tcb.2010.11.001. [DOI] [PMC free article] [PubMed] [Google Scholar]
- 16.Bryce NS, Schevzov G, Ferguson V, Percival JM, Lin JJ, Matsumura F, et al. Specification of actin filament function and molecular composition by tropomyosin isoforms. Mol Biol Cell. 2003;14:1002–1016. doi: 10.1091/mbc.E02-04-0244. [DOI] [PMC free article] [PubMed] [Google Scholar]
- 17.Coulton AT, East DA, Galinska-Rakoczy A, Lehman W, Mulvihill DP. The recruitment of acetylated and unacetylated tropomyosin to distinct actin polymers permits the discrete regulation of specific myosins in fission yeast. J Cell Sci. 2010;123:3235–3243. doi: 10.1242/jcs.069971. [DOI] [PMC free article] [PubMed] [Google Scholar]
- 18.Tang N, Ostap EM. Motor domain-dependent localization of myo1b (myr-1) Curr Biol. 2001;11:1131–1135. doi: 10.1016/s0960-9822(01)00320-7. [DOI] [PubMed] [Google Scholar]
- 19.Strand J, Nili M, Homsher E, Tobacman LS. Modulation of myosin function by isoform-specific properties of Saccharomyces cerevisiae and muscle tropomyosins. J Biol Chem. 2001;276:34832–34839. doi: 10.1074/jbc.M104750200. [DOI] [PubMed] [Google Scholar]
- 20.Fanning AS, Wolenski JS, Mooseker MS, Izant JG. Differential regulation of skeletal muscle myosin-II and brush border myosin-I enzymology and mechanochemistry by bacterially produced tropomyosin isoforms. Cell Motil Cytoskel. 1994;29:29–45. doi: 10.1002/cm.970290104. [DOI] [PubMed] [Google Scholar]
- 21.Tojkander S, Gateva G, Schevzov G, Hotulainen P, Naumanen P, Martin C, et al. A Molecular Pathway for Myosin II Recruitment to Stress Fibers. Curr Biol. 2011;21:539–550. doi: 10.1016/j.cub.2011.03.007. [DOI] [PubMed] [Google Scholar]
- 22.Sobue K, Takahashi K, Wakabayashi I. Caldesmon150 regulates the tropomyosin-enhanced actin-myosin interaction in gizzard smooth muscle. Biochem Biophys Res Comm. 1985;132:645–651. doi: 10.1016/0006-291x(85)91181-7. [DOI] [PubMed] [Google Scholar]
- 23.Watakabe A, Kobayashi R, Helfman DM. N-tropomodulin: a novel isoform of tropomodulin identified as the major binding protein to brain tropomyosin. J Cell Sci. 1996;109:2299–2310. doi: 10.1242/jcs.109.9.2299. [DOI] [PubMed] [Google Scholar]
- 24.Uversky VN, Shah SP, Gritsyna Y, Hitchcock-DeGregori SE, Kostyukova AS. Systematic analysis of tropomodulin/tropomyosin interactions uncovers fine-tuned binding specificity of intrinsically disordered proteins. J Mol Recognit. 2011;24:647–655. doi: 10.1002/jmr.1093. [DOI] [PubMed] [Google Scholar]
- 25.Kostyukova AS, Hitchcock-DeGregori SE. Effect of the structure of the N terminus of tropomyosin on tropomodulin function. J Biol Chem. 2004;279:5066–5071. doi: 10.1074/jbc.M311186200. [DOI] [PubMed] [Google Scholar]
- 26.Pruyne D. Tropomyosin function in yeast. Adv Exp Med Biol. 2008;644:168–186. doi: 10.1007/978-0-387-85766-4_14. [DOI] [PubMed] [Google Scholar]
- 27.Vrhovski B, Theze N, Thiebaud P. Structure and evolution of tropomyosin genes. Adv Exp Med Biol. 2008;644:6–26. doi: 10.1007/978-0-387-85766-4_2. [DOI] [PubMed] [Google Scholar]
- 28.Moutevelis E, Woolfson DN. A periodic Table of coiled-coil protein structures. J Mol Biol. 2009;385:726–732. doi: 10.1016/j.jmb.2008.11.028. [DOI] [PubMed] [Google Scholar]
- 29.Hodges RS, Mills J, McReynolds S, Kirwan JP, Tripet B, Osguthorpe D. Identification of a unique “stability control region” that controls protein stability of tropomyosin: A two-stranded alpha-helical coiled-coil. J Mol Biol. 2009;392:747–762. doi: 10.1016/j.jmb.2009.07.039. [DOI] [PMC free article] [PubMed] [Google Scholar]
- 30.Lehman W, Hatch V, Korman V, Rosol M, Thomas L, Maytum R, et al. Tropomyosin and actin isoforms modulate the localization of tropomyosin strands on actin filaments. J Mol Biol. 2000;302:593–606. doi: 10.1006/jmbi.2000.4080. [DOI] [PubMed] [Google Scholar]
- 31.Barua B, Pamula MC, Hitchcock-Degregori SE. Evolutionarily conserved surface residues constitute actin binding sites of tropomyosin. Proc Natl Acad Sci USA. 2011;108:10150–10155. doi: 10.1073/pnas.1101221108. [DOI] [PMC free article] [PubMed] [Google Scholar]
- 32.Cooley BC, Bergtrom G. Multiple combinations of alternatively spliced exons in rat tropomyosin-alpha gene mRNA: evidence for 20 new isoforms in adult tissues and cultured cells. Arch Biochem Biophys. 2001;390:71–77. doi: 10.1006/abbi.2001.2347. [DOI] [PubMed] [Google Scholar]
- 33.Dufour C, Weinberger RP, Schevzov G, Jeffrey PL, Gunning P. Splicing of two internal and four carboxyl-terminal alternative exons in nonmuscle tropomyosin 5 pre-mRNA is independently regulated during development. J Biol Chem. 1998;273:18547–18555. doi: 10.1074/jbc.273.29.18547. [DOI] [PubMed] [Google Scholar]
- 34.Yamawaki-Kataoka Y, Helfman DM. Isolation and characterization of cDNA clones encoding a low molecular weight nonmuscle tropomyosin isoform. J Biol Chem. 1987;262:10791–10800. [PubMed] [Google Scholar]
- 35.Denz CR, Narshi A, Zajdel RW, Dube DK. Expression of a novel cardiac-specific tropomyosin isoform in humans. Biochem Biophys Res Comm. 2004;320:1291–1297. doi: 10.1016/j.bbrc.2004.06.084. [DOI] [PubMed] [Google Scholar]
- 36.Prasad GL, Masuelli L, Raj MH, Harindranath N. Suppression of src-induced transformed phenotype by expression of tropomyosin-1. Oncogene. 1999;18:2027–2031. doi: 10.1038/sj.onc.1202264. [DOI] [PubMed] [Google Scholar]
- 37.Clayton L, Johnson MH. Tropomyosin in preimplantation mouse development: identification, expression and organization during cell division and polarization. Exp Cell Res. 1998;238:450–464. doi: 10.1006/excr.1997.3854. [DOI] [PubMed] [Google Scholar]
- 38.Gunning P, Gordon M, Wade R, Gahlmann R, Lin CS, Hardeman E. Differential control of tropomyosin mRNA levels during myogenesis suggests the existence of an isoform competition-autoregulatory compensation control mechanism. Dev Biol. 1990;138:443–453. doi: 10.1016/0012-1606(90)90210-a. [DOI] [PubMed] [Google Scholar]
- 39.Beisel KW, Kennedy JE. Identification of novel alternatively spliced isoforms of the tropomyosin-encoding gene, TMnm, in the rat cochlea. Gene. 1994;143:251–256. doi: 10.1016/0378-1119(94)90105-8. [DOI] [PubMed] [Google Scholar]
- 40.Lees-Miller JP, Goodwin LO, Helfman DM. Three novel brain tropomyosin isoforms are expressed from the rat alpha-tropomyosin gene through the use of alternative promoters and alternative RNA processing. Mol Cell Biol. 1990;10:1729–1742. doi: 10.1128/mcb.10.4.1729. [DOI] [PMC free article] [PubMed] [Google Scholar]
- 41.Lees-Miller JP, Yan A, Helfman DM. Structure and complete nucleotide sequence of the gene encoding rat fibroblast tropomyosin 4. J Mol Biol. 1990;213:399–405. doi: 10.1016/S0022-2836(05)80202-5. [DOI] [PubMed] [Google Scholar]
- 42.Lin JJ, Eppinga RD, Warren KS, McCrae KR. Human tropomyosin isoforms in the regulation of cytoskeleton functions. Adv Exp Med Biol. 2008;644:201–222. doi: 10.1007/978-0-387-85766-4_16. [DOI] [PubMed] [Google Scholar]
- 43.Hitchcock-DeGregori SE, Heald RW. Altered actin and troponin binding of amino-terminal variants of chicken striated muscle alpha-tropomyosin expressed in Escherichia coli. J Biol Chem. 1987;262:9730–9735. [PubMed] [Google Scholar]
- 44.Urbancikova M, Hitchcock-DeGregori SE. Requirement of amino-terminal modification for striated muscle alpha-tropomyosin function. J Biol Chem. 1994;269:24310–24315. [PubMed] [Google Scholar]
- 45.Coulton A, Lehrer SS, Geeves MA. Functional homodimers and heterodimers of recombinant smooth muscle tropomyosin. Biochemistry. 2006;45:12853–12858. doi: 10.1021/bi0613224. [DOI] [PMC free article] [PubMed] [Google Scholar]
- 46.Brown JH, Kim KH, Jun G, Greenfield NJ, Dominguez R, Volkmann N, et al. Deciphering the design of the tropomyosin molecule. Proc Natl Acad Sci USA. 2001;98:8496–8501. doi: 10.1073/pnas.131219198. [DOI] [PMC free article] [PubMed] [Google Scholar]
- 47.Skoumpla K, Coulton AT, Lehman W, Geeves MA, Mulvihill DP. Acetylation regulates tropomyosin function in the fission yeast Schizosaccharomyces pombe. J Cell Sci. 2007;120:1635–1645. doi: 10.1242/jcs.001115. [DOI] [PubMed] [Google Scholar]
- 48.Montarras D, Fiszman MY, Gros F. Characterization of the tropomyosin present in various chick embryo muscle types and in muscle cells differentiated in vitro. J Biol Chem. 1981;256:4081–4086. [PubMed] [Google Scholar]
- 49.Ribolow H, Barany M. Phosphorylation of tropomyosin in live frog muscle. Arch Biochem Biophys. 1977;179:718–720. doi: 10.1016/0003-9861(77)90162-x. [DOI] [PubMed] [Google Scholar]
- 50.Mak A, Smillie LB, Barany M. Specific phosphorylation at serine-283 of alpha tropomyosin from frog skeletal and rabbit skeletal and cardiac muscle. Proc Natl Acad Sci USA. 1978;75:3588–3592. doi: 10.1073/pnas.75.8.3588. [DOI] [PMC free article] [PubMed] [Google Scholar]
- 51.O'Connor CM, Balzer DR, Jr, Lazarides E. Phosphorylation of subunit proteins of intermediate filaments from chicken muscle and nonmuscle cells. Proc Natl Acad Sci USA. 1979;76:819–823. doi: 10.1073/pnas.76.2.819. [DOI] [PMC free article] [PubMed] [Google Scholar]
- 52.Heeley DA, Moir AJ, Perry SV. Phosphorylation of tropomyosin during development in mammalian striated muscle. FEBS Lett. 1982;146:115–118. doi: 10.1016/0014-5793(82)80716-3. [DOI] [PubMed] [Google Scholar]
- 53.Heeley DH, Dhoot GK, Perry SV. Factors determining the subunit composition of tropomyosin in mammalian skeletal muscle. Biochem J. 1985;226:461–468. doi: 10.1042/bj2260461. [DOI] [PMC free article] [PubMed] [Google Scholar]
- 54.Dabrowska R, Nowak E, Drabikowski W. Some functional properties of nonpolymerizable and polymerizable tropomyosin. J Muscle Res Cell Motil. 1983;4:143–161. doi: 10.1007/BF00712027. [DOI] [PubMed] [Google Scholar]
- 55.Heeley DH, Smillie LB, Lohmeier-Vogel EM. Effects of deletion of tropomyosin overlap on regulated actomyosin subfragment 1 ATPase. Biochem J. 1989;258:831–836. doi: 10.1042/bj2580831. [DOI] [PMC free article] [PubMed] [Google Scholar]
- 56.Heeley DH. Investigation of the effects of phosphorylation of rabbit striated muscle alpha alpha-tropomyosin and rabbit skeletal muscle troponin-T. Eur J Biochem. 1994;221:129–137. doi: 10.1111/j.1432-1033.1994.tb18721.x. [DOI] [PubMed] [Google Scholar]
- 57.Houle F, Rousseau S, Morrice N, Luc M, Mongrain S, Turner CE, et al. Extracellular signal-regulated kinase mediates phosphorylation of tropomyosin-1 to promote cytoskeleton remodeling in response to oxidative stress: impact on membrane blebbing. Mol Biol Cell. 2003;14:1418–1432. doi: 10.1091/mbc.E02-04-0235. [DOI] [PMC free article] [PubMed] [Google Scholar]
- 58.Naga Prasad SV, Jayatilleke A, Madamanchi A, Rockman HA. Protein kinase activity of phosphoinositide-3-kinase regulates beta-adrenergic receptor endocytosis. Nat Cell Biol. 2005;7:785–796. doi: 10.1038/ncb1278. [DOI] [PubMed] [Google Scholar]
- 59.Huang B, Chen SC, Wang DL. Shear flow increases S-nitrosylation of proteins in endothelial cells. Cardiovasc Res. 2009;83:536–546. doi: 10.1093/cvr/cvp154. [DOI] [PubMed] [Google Scholar]
- 60.Schevzov G, Vrhovski B, Bryce NS, Elmir S, Qiu MR, O'Neill GM, et al. Tissue-specific Tropomyosin Isoform Composition. J Histochem Cytochem. 2005;53:557–570. doi: 10.1369/jhc.4A6505.2005. [DOI] [PubMed] [Google Scholar]
- 61.Lin JJ, Chou CS, Lin JL. Monoclonal antibodies against chicken tropomyosin isoforms: production, characterization and application. Hybridoma. 1985;4:223–242. doi: 10.1089/hyb.1985.4.223. [DOI] [PubMed] [Google Scholar]
- 62.Warren KS, Lin JL, McDermott JP, Lin JJ. Forced expression of chimeric human fibroblast tropomyosin mutants affects cytokinesis. J Cell Biol. 1995;129:697–708. doi: 10.1083/jcb.129.3.697. [DOI] [PMC free article] [PubMed] [Google Scholar]
- 63.Sung LA, Gao KM, Yee LJ, Temm-Grove CJ, Helfman DM, Lin JJ, et al. Tropomyosin isoform 5b is expressed in human erythrocytes: implications of tropomodulin-TM5 or tropomodulin-TM5b complexes in the protofilament and hexagonal organization of membrane skeletons. Blood. 2000;95:1473–1480. [PubMed] [Google Scholar]
- 64.Novy RE, Sellers JR, Liu LF, Lin JJ. In vitro functional characterization of bacterially expressed human fibroblast tropomyosin isoforms and their chimeric mutants. Cell Motil Cytoskel. 1993;26:248–261. doi: 10.1002/cm.970260308. [DOI] [PubMed] [Google Scholar]
- 65.Kee AJ, Schevzov G, Nair-Shalliker V, Robinson CS, Vrhovski B, Ghoddusi M, et al. Sorting of a nonmuscle tropomyosin to a novel cytoskeletal compartment in skeletal muscle results in muscular dystrophy. J Cell Biol. 2004;166:685–696. doi: 10.1083/jcb.200406181. [DOI] [PMC free article] [PubMed] [Google Scholar]
- 66.Lin JJ, Hegmann TE, Lin JL. Differential localization of tropomyosin isoforms in cultured nonmuscle cells. J Cell Biol. 1988;107:563–572. doi: 10.1083/jcb.107.2.563. [DOI] [PMC free article] [PubMed] [Google Scholar]
- 67.Dufour C, Weinberger RP, Gunning P. Tropomyosin isoform diversity and neuronal morphogenesis. Imm Cell Biol. 1998;76:424–429. doi: 10.1046/j.1440-1711.1998.00765.x. [DOI] [PubMed] [Google Scholar]
- 68.Vrhovski B, Schevzov G, Dingle S, Lessard JL, Gunning P, Weinberger RP. Tropomyosin isoforms from the gamma gene differing at the C-terminus are spatially and developmentally regulated in the brain. J Neurosci Res. 2003;72:373–383. doi: 10.1002/jnr.10586. [DOI] [PubMed] [Google Scholar]
- 69.Faivre-Sarrailh C, Had L, Ferraz C, Sri Widada JS, Liautard JP, Rabie A. Expression of tropomyosin genes during the development of the rat cerebellum. J Neurochem. 1990;55:899–906. doi: 10.1111/j.1471-4159.1990.tb04576.x. [DOI] [PubMed] [Google Scholar]
- 70.Stamm S, Casper D, Lees-Miller JP, Helfman DM. Brain-specific tropomyosins TMBr-1 and TMBr-3 have distinct patterns of expression during development and in adult brain. Proc Natl Acad Sci USA. 1993;90:9857–9861. doi: 10.1073/pnas.90.21.9857. [DOI] [PMC free article] [PubMed] [Google Scholar]
- 71.Had L, Faivre-Sarrailh C, Legrand C, Mery J, Brugidou J, Rabie A. Tropomyosin isoforms in rat neurons: the different developmental profiles and distributions of TM-4 and TMBr-3 are consistent with different functions. J Cell Sci. 1994;107:2961–2973. doi: 10.1242/jcs.107.10.2961. [DOI] [PubMed] [Google Scholar]
- 72.Gallant C, Appel S, Graceffa P, Leavis P, Lin JJ, Gunning PW, et al. Tropomyosin variants describe distinct functional subcellular domains in differentiated vascular smooth muscle cells. Am J Physiol Cell Physiol. 2011;300:1356–1365. doi: 10.1152/ajpcell.00450.2010. [DOI] [PMC free article] [PubMed] [Google Scholar]
- 73.Houle F, Poirier A, Dumaresq J, Huot J. DAP kinase mediates the phosphorylation of tropomyosin-1 downstream of the ERK pathway, which regulates the formation of stress fibers in response to oxidative stress. J Cell Sci. 2007;120:3666–3677. doi: 10.1242/jcs.003251. [DOI] [PubMed] [Google Scholar]
- 74.Dalby-Payne JR, O'Loughlin EV, Gunning P. Polarization of specific tropomyosin isoforms in gastro-intestinal epithelial cells and their impact on CFTR at the apical surface. Mol Biol Cell. 2003;14:4365–4375. doi: 10.1091/mbc.E03-03-0169. [DOI] [PMC free article] [PubMed] [Google Scholar]
- 75.Martin C, Schevzov G, Gunning P. Alternatively spliced N-terminal exons in tropomyosin isoforms do not act as autonomous targeting signals. J Struct Biol. 2010;170:286–293. doi: 10.1016/j.jsb.2009.12.016. [DOI] [PubMed] [Google Scholar]
- 76.Bach CTT, Creed S, Zhong J, Mahmassani M, Schevzov G, Stehn J, et al. Tropomyosin Isoform Expression Regulates the Transition of Adhesions To Determine Cell Speed and Direction. Mol Cell Biol. 2009;29:1506–1514. doi: 10.1128/MCB.00857-08. [DOI] [PMC free article] [PubMed] [Google Scholar]
- 77.McMichael BK, Lee BS. Tropomyosin 4 regulates adhesion structures and resorptive capacity in osteoclasts. Exp Cell Res. 2008;314:564–573. doi: 10.1016/j.yexcr.2007.10.018. [DOI] [PMC free article] [PubMed] [Google Scholar]
- 78.Kotadiya P, McMichael BK, Lee BS. High molecular weight tropomyosins regulate osteoclast cytoskeletal morphology. Bone. 2008;43:951–960. doi: 10.1016/j.bone.2008.06.017. [DOI] [PMC free article] [PubMed] [Google Scholar]
- 79.Creed SJ, Desouza M, Bamburg JR, Gunning P, Stehn J. Tropomyosin isoform 3 promotes the formation of filopodia by regulating the recruitment of actin-binding proteins to actin filaments. Exp Cell Res. 2011;317:249–261. doi: 10.1016/j.yexcr.2010.10.019. [DOI] [PubMed] [Google Scholar]
- 80.Schevzov G, Bryce NS, Almonte-Baldonado R, Joya J, Lin JJ, Hardeman E, et al. Specific features of neuronal size and shape are regulated by tropomyosin isoforms. Mol Biol Cell. 2005;16:3425–3437. doi: 10.1091/mbc.E04-10-0951. [DOI] [PMC free article] [PubMed] [Google Scholar]
- 81.Bach CT, Schevzov G, Bryce NS, Gunning PW, O'Neill GM. Tropomyosin isoform modulation of focal adhesion structure and cell migration. Cell Adh Migr. 2010;4:226–234. doi: 10.4161/cam.4.2.10888. [DOI] [PMC free article] [PubMed] [Google Scholar]
- 82.Nguyen MA, Hardeman EC. Mouse models for thin filament disease. Adv Exp Med Biol. 2008;642:66–77. doi: 10.1007/978-0-387-84847-1_6. [DOI] [PubMed] [Google Scholar]
- 83.Kee AJ, Hardeman EC. Tropomyosins in skeletal muscle diseases. Adv Exp Med Biol. 2008;644:143–157. doi: 10.1007/978-0-387-85766-4_12. [DOI] [PubMed] [Google Scholar]
- 84.Jagatheesan G, Rajan S, Wieczorek DF. Investigations into tropomyosin function using mouse models. J Mol Cell Cardiol. 2010;48:893–898. doi: 10.1016/j.yjmcc.2009.10.003. [DOI] [PMC free article] [PubMed] [Google Scholar]
- 85.Schevzov G, Fath TPG. Intracellular structural compartments, disease and tropomyosins. Curr Top Pharmacol. 2009;13:1–15. [Google Scholar]
- 86.Blanchard EM, Iizuka K, Christe M, Conner DA, Geisterfer-Lowrance A, Schoen FJ, et al. Targeted ablation of the murine alpha-tropomyosin gene. Circ Res. 1997;81:1005–1010. doi: 10.1161/01.res.81.6.1005. [DOI] [PubMed] [Google Scholar]
- 87.Hook J, Lemckert F, Qin H, Schevzov G, Gunning P. Gamma tropomyosin gene products are required for embryonic development. Mol Cell Biol. 2004;24:2318–2323. doi: 10.1128/MCB.24.6.2318-2323.2004. [DOI] [PMC free article] [PubMed] [Google Scholar]
- 88.Hook J, Lemckert F, Schevzov G, Fath T, Gunning P. Functional identity of the gamma tropomyosin gene Implications for embryonic development, reproduction and cell viability. BioArch. 2011;1:49–59. doi: 10.4161/bioa.1.1.15172. [DOI] [PMC free article] [PubMed] [Google Scholar]
- 89.Rethinasamy P, Muthuchamy M, Hewett T, Boivin G, Wolska BM, Evans C, et al. Molecular and physiological effects of alpha-tropomyosin ablation in the mouse. Circ Res. 1998;82:116–123. doi: 10.1161/01.res.82.1.116. [DOI] [PubMed] [Google Scholar]
- 90.Schevzov G, Fath T, Vrhovski B, Vlahovich N, Rajan S, Hook J, et al. Divergent Regulation of the Sarcomere and the Cytoskeleton. J Biol Chem. 2008;283:275–283. doi: 10.1074/jbc.M704392200. [DOI] [PubMed] [Google Scholar]
- 91.Kee AJ, Gunning PW, Hardeman EC. A cytoskeletal tropomyosin can compromise the structural integrity of skeletal muscle. Cell Motil Cytoskeleton. 2009;66:710–720. doi: 10.1002/cm.20400. [DOI] [PubMed] [Google Scholar]
- 92.Vlahovich N, Kee AJ, Van der Poel C, Kettle E, Hernandez-Deviez D, Lucas C, et al. Cytoskeletal tropomyosin Tm5NM1 is required for normal excitation-contraction coupling in skeletal muscle. Mol Biol Cell. 2009;20:400–409. doi: 10.1091/mbc.E08-06-0616. [DOI] [PMC free article] [PubMed] [Google Scholar]
- 93.Fath T, Agnes Chan YK, Vrhovski B, Clarke H, Curthoys N, Hook J, et al. New aspects of tropomyosin-regulated neuritogenesis revealed by the deletion of Tm5NM1 and 2. Eur J Cell Biol. 2010;89:489–498. doi: 10.1016/j.ejcb.2009.11.028. [DOI] [PubMed] [Google Scholar]
- 94.Gimona M. Dimerization of tropomyosins. Adv Exp Med Biol. 2008;644:73–84. doi: 10.1007/978-0-387-85766-4_6. [DOI] [PubMed] [Google Scholar]
- 95.Huang B, Bates M, Zhuang X. Super-resolution fluorescence microscopy. Annu Rev Biochem. 2009;78:993–1016. doi: 10.1146/annurev.biochem.77.061906.092014. [DOI] [PMC free article] [PubMed] [Google Scholar]
- 96.Hahn WC, Counter CM, Lundberg AS, Beijersbergen RL, Brooks MW, Weinberg RA. Creation of human tumour cells with defined genetic elements. Nature. 1999;400:464–468. doi: 10.1038/22780. [DOI] [PubMed] [Google Scholar]
- 97.Wessel D, Flugge UI. A method for the quantitative recovery of protein in dilute solution in the presence of detergents and lipids. Anal Biochem. 1984;138:141–143. doi: 10.1016/0003-2697(84)90782-6. [DOI] [PubMed] [Google Scholar]
- 98.Nicholson-Flynn K, Hitchcock-DeGregori SE, Levitt P. Restricted expression of the actin-regulatory protein, tropomyosin, defines distinct boundaries, evaginating neuroepithelium and choroid plexus forerunners during early CNS development. J Neurosci. 1996;16:6853–6863. doi: 10.1523/JNEUROSCI.16-21-06853.1996. [DOI] [PMC free article] [PubMed] [Google Scholar]
- 99.Vrhovski B, McKay K, Schevzov G, Gunning PW, Weinberger RP. Smooth muscle-specific alpha tropomyosin is a marker of fully differentiated smooth muscle in lung. J Histochem Cytochem. 2005;53:875–883. doi: 10.1369/jhc.4A6504.2005. [DOI] [PubMed] [Google Scholar]
- 100.Weinberger R, Schevzov G, Jeffrey P, Gordon K, Hill M, Gunning P. The molecular composition of neuronal microfilaments is spatially and temporally regulated. J Neurosci. 1996;16:238–252. doi: 10.1523/JNEUROSCI.16-01-00238.1996. [DOI] [PMC free article] [PubMed] [Google Scholar]
- 101.Lin JJ, Warren KS, Wamboldt DD, Wang T, Lin JL. Tropomyosin isoforms in nonmuscle cells. Int Rev Cytol. 1997;170:1–38. doi: 10.1016/s0074-7696(08)61619-8. [DOI] [PubMed] [Google Scholar]
- 102.Mahadev K, Raval G, Bharadwaj S, Willingham MC, Lange EM, Vonderhaar B, et al. Suppression of the transformed phenotype of breast cancer by tropomyosin-1. Exp Cell Res. 2002;279:40–51. doi: 10.1006/excr.2002.5583. [DOI] [PubMed] [Google Scholar]
- 103.Hannan AJ, Gunning P, Jeffrey PL, Weinberger RP. Structural compartments within neurons: developmentally regulated organization of microfilament isoform mRNA and protein. Mol Cell Neurosci. 1998;11:289–304. doi: 10.1006/mcne.1998.0693. [DOI] [PubMed] [Google Scholar]
- 104.Hillberg L, Zhao Rathje LS, Nyakern-Meazza M, Helfand B, Goldman RD, Schutt CE, et al. Tropomyosins are present in lamellipodia of motile cells. Eur J Cell Biol. 2006;85:399–409. doi: 10.1016/j.ejcb.2005.12.005. [DOI] [PubMed] [Google Scholar]
- 105.Helfman DM, Berthier C, Grossman J, Leu M, Ehler E, Perriard E, et al. Nonmuscle tropomyosin-4 requires coexpression with other low molecular weight isoforms for binding to thin filaments in cardiomyocytes. J Cell Sci. 1999;112:371–380. doi: 10.1242/jcs.112.3.371. [DOI] [PubMed] [Google Scholar]
- 106.Creed SJ, Bryce N, Naumanen P, Weinberger R, Lappalainen P, Stehn J, et al. Tropomyosin isoforms define distinct microfilament populations with different drug susceptibility. Eur J Cell Biol. 2008;87:709–720. doi: 10.1016/j.ejcb.2008.03.004. [DOI] [PubMed] [Google Scholar]
- 107.Lees JG, Bach CT, Bradbury P, Paul A, Gunning PW, O'Neill GM. The actin-associating protein Tm5NM1 blocks mesenchymal motility without transition to amoeboid motility. Oncogene. 2011;30:1241–1251. doi: 10.1038/onc.2010.516. [DOI] [PubMed] [Google Scholar]
- 108.Corbett MA, Robinson CS, Dunglison GF, Yang N, Joya JE, Stewart AW, et al. A mutation in alpha-tropomyosin(slow) affects muscle strength, maturation and hypertrophy in a mouse model for nemaline myopathy. Hum Mol Gen. 2001;10:317–328. doi: 10.1093/hmg/10.4.317. [DOI] [PubMed] [Google Scholar]
- 109.Muthuchamy M, Pieples K, Rethinasamy P, Hoit B, Grupp IL, Boivin GP, et al. Mouse model of a familial hypertrophic cardiomyopathy mutation in alpha-tropomyosin manifests cardiac dysfunction. Circ Res. 1999;85:47–56. doi: 10.1161/01.res.85.1.47. [DOI] [PubMed] [Google Scholar]
- 110.Prabhakar R, Boivin GP, Grupp IL, Hoit B, Arteaga G, Solaro JR, et al. A familial hypertrophic cardiomyopathy alpha-tropomyosin mutation causes severe cardiac hypertrophy and death in mice. J Mol Cell Cardiol. 2001;33:1815–1828. doi: 10.1006/jmcc.2001.1445. [DOI] [PubMed] [Google Scholar]
- 111.Rajan S, Ahmed RP, Jagatheesan G, Petrashevskaya N, Boivin GP, Urboniene D, et al. Dilated cardiomyopathy mutant tropomyosin mice develop cardiac dysfunction with significantly decreased fractional shortening and myofilament calcium sensitivity. Circ Res. 2007;101:205–214. doi: 10.1161/CIRCRESAHA.107.148379. [DOI] [PubMed] [Google Scholar]
- 112.Pieples K, Arteaga G, Solaro RJ, Grupp I, Lorenz JN, Boivin GP, et al. Tropomyosin 3 expression leads to hypercontractility and attenuates myofilament length-dependent Ca(2+) activation. Am J Physiol Heart Circ Physiol. 2002;283:1344–1353. doi: 10.1152/ajpheart.00351.2002. [DOI] [PubMed] [Google Scholar]
- 113.Wolska BM, Keller RS, Evans CC, Palmiter KA, Phillips RM, Muthuchamy M, et al. Correlation between myofilament response to Ca2+ and altered dynamics of contraction and relaxation in transgenic cardiac cells that express beta-tropomyosin. Circ Res. 1999;84:745–751. doi: 10.1161/01.res.84.7.745. [DOI] [PubMed] [Google Scholar]
- 114.Muthuchamy M, Grupp IL, Grupp G, O'Toole BA, Kier AB, Boivin GP, et al. Molecular and physiological effects of overexpressing striated muscle beta-tropomyosin in the adult murine heart. J Biol Chem. 1995;270:30593–30603. doi: 10.1074/jbc.270.51.30593. [DOI] [PubMed] [Google Scholar]
- 115.Palmiter KA, Kitada Y, Muthuchamy M, Wieczorek DF, Solaro RJ. Exchange of beta- for alpha-tropomyosin in hearts of transgenic mice induces changes in thin filament response to Ca2+, strong cross-bridge binding and protein phosphorylation. J Biol Chem. 1996;271:11611–11614. doi: 10.1074/jbc.271.20.11611. [DOI] [PubMed] [Google Scholar]
- 116.Jagatheesan G, Rajan S, Petrashevskaya N, Schwartz A, Boivin G, Vahebi S, et al. Functional importance of the carboxyl-terminal region of striated muscle tropomyosin. J Biol Chem. 2003;278:23204–23211. doi: 10.1074/jbc.M303073200. [DOI] [PubMed] [Google Scholar]
- 117.Jagatheesan G, Rajan S, Schulz EM, Ahmed RP, Petrashevskaya N, Schwartz A, et al. An internal domain of beta-tropomyosin increases myofilament Ca(2+) sensitivity. Am J Physiol Heart Circ Physiol. 2009;297:181–190. doi: 10.1152/ajpheart.00329.2008. [DOI] [PMC free article] [PubMed] [Google Scholar]
- 118.Jagatheesan G, Rajan S, Petrashevskaya N, Schwartz A, Boivin G, Arteaga G, et al. Physiological significance of troponin T binding domains in striated muscle tropomyosin. Am J Physiol Heart Circ Physiol. 2004;287:1484–1494. doi: 10.1152/ajpheart.01112.2003. [DOI] [PubMed] [Google Scholar]
- 119.Vrhovski B, Lemckert F, Gunning P. Modification of the tropomyosin isoform composition of actin filaments in the brain by deletion of an alternatively spliced exon. Neuropharmacology. 2004;47:684–693. doi: 10.1016/j.neuropharm.2004.07.011. [DOI] [PubMed] [Google Scholar]


