

Abstract
Exposures to ambient air traffic-related pollutants and their sources have been associated with respiratory and asthma morbidity in children. However, longitudinal investigation of the effects of traffic-related exposures during early childhood is limited. We examined associations of residential proximity and density of traffic and stationary sources of air pollution with wheeze, asthma, and immunoglobulin (Ig) E among New York City children between birth and age 5 years.
Subjects included 593 Dominican and African American participants from the Columbia Center for Children’s Environmental Health cohort. Prenatally, through age 5 years, residential and respiratory health data were collected every 3-6 months. At ages 2, 3, and 5 years, serum IgE was measured. Spatial data on the proximity and density of roadways and built environment were collected for a 250 meter buffer around subjects’ homes. Associations of wheeze, asthma, total IgE, and allergen-specific IgE with prenatal, earlier childhood, and concurrent exposures to air pollution sources were analyzed using generalized estimating equations or logistic regression. In repeated measures analyses, concurrent residential density of four-way intersections was associated significantly with wheeze (odds ratio: 1.26; 95% confidence interval [CI]: 1.01, 1.57). Age 1 exposures also were associated with wheeze at subsequent ages. Concurrent proximity to highway was associated more strongly with total IgE (ratio of the geometric mean levels: 1.25; 95% CI: 1.09, 1.42) than were prenatal or earlier childhood exposures. Positive associations also were observed between percent commercial building area and asthma, wheeze, and IgE and between proximity to stationary sources of air pollution and asthma.
Longitudinal investigation suggests that among Dominican and African American children living in Northern Manhattan and South Bronx during ages 0 to 5 years, residence in neighborhoods with high density of traffic and industrial facilities may contribute to chronic respiratory morbidity, and concurrent, prenatal, and earlier childhood exposures may be important. These findings may have broad implications for other urban populations that commonly have high asthma prevalence and exposure to a high density of traffic and stationary air pollution sources.
Keywords: Traffic, Asthma, IgE, Geographic information systems, Air pollution
1. Introduction
Traffic, particularly diesel-related emissions, is an important source of air pollution exposure for the residents of New York City neighborhoods such as Northern Manhattan and the South Bronx (Jung et al., 2010; Lena et al., 2002; Tonne et al., 2004). Among children living in these communities, both prenatal and short-term concurrent exposures to traffic-related pollutants, including polycyclic aromatic hydrocarbons, elemental carbon, and trace metals have been linked to asthma and respiratory symptoms (Miller et al., 2004; Patel et al., 2009a; Patel et al., 2010). In these populations, the lack of long-term air monitoring of traffic-related pollutants at a fine level of spatial resolution has limited the characterization of the health risks associated with chronic exposures to traffic-related pollutants.
Limited epidemiologic evidence links chronic exposure to traffic-related pollutants such as elemental carbon, black carbon, nitrogen dioxide (NO2), carbon monoxide, and fine particulate matter (PM2.5), as assessed by community-wide air concentrations, with asthma prevalence (Kim et al., 2004) and deficits in lung function growth (Gauderman et al., 2004). Further, epidemiologic and experimental studies demonstrate associations of air pollution exposures with allergic sensitization and increases in the proallergic immunoglobulin (Ig) E (Diaz-Sanchez et al., 1994; Herr et al., 2011; Janssen et al., 2003; Liu et al., 2008; Mortimer et al., 2008; Rage et al., 2009; Takenaka et al., 1995). Despite these lines of evidence, the effects of chronic air pollution exposures in susceptible populations such as urban children in the period shortly after birth are not well-characterized.
To address the lack of individual-level measurements of traffic-related air pollution exposures, many studies have assigned exposures using geographic information systems (GIS)-based indicators such as residential roadway density or proximity or pollutant estimates derived from land-use regression modeling of such GIS indicators. Proximity to major roadways and industrial facilities as well as land use regression-derived estimates of black carbon, NO2, and PM2.5 have been associated with asthma- and allergy-related conditions in children in cross-sectional (Chang et al., 2009; Gordian et al., 2006; Ryan et al., 2007) and longitudinal analyses (Clark et al., 2010; Gehring et al., 2010; McConnell et al., 2006; Morgenstern et al., 2007; Morgenstern et al., 2008). However, analyses of repeat measures of exposure and outcomes are limited (Morgenstern et al., 2007; Morgenstern et al., 2008). Roadway proximity and traffic density have been strong, robust predictors of outdoor air concentrations of elemental carbon, NO2, and PM2.5 (Brauer et al., 2003; Clark et al., 2010; Clougherty et al., 2008; Jerrett et al., 2007; Ryan et al., 2008). Hence, GIS indicators of traffic may serve as suitable estimates of individual-level exposures to traffic-related pollutants where direct measurements are unavailable and long-term estimates are desired.
Our objective was to address the lack of longitudinal studies on long-term air pollution exposures and pediatric respiratory disease as part of the Columbia Center for Children’s Environmental Health birth cohort study. We used annual data on residential proximity and density of roadways and industrial facilities to represent air pollution exposures of children for whom annual individual-level air pollutant measurements between birth and age 5 years were unavailable. Given previous findings in this cohort that concurrent air pollution exposures were associated with respiratory symptoms (Patel et al., 2009a), our primary hypothesis was that GIS indicators of traffic and stationary sources of air pollution would be associated concurrently with asthma- and allergy-related outcomes in children between birth and age 5 years. We additionally explored whether prenatal and earlier childhood exposures to these air pollution sources were associated with asthma and allergy through age 5 years.
2. Material and Methods
2.1. Study design and population
Between 1998 and 2006, 727 children were enrolled into the Columbia Center for Children’s Environmental Health birth cohort as described (Jung et al., 2010; Patel et al., 2009a; Perera et al., 2003). Their mothers were recruited during pregnancy from New York Presbyterian Medical Center or Harlem Hospital prenatal clinics, and 846 of 1442 women (59%) who met the initial eligibility criteria (nonsmoking, residence in the New York City neighborhoods of Northern Manhattan or South Bronx, and Dominican or African American ethnicity) agreed to participate (Appendix, Figure A.1). Fifty percent of eligible women (727/1442) provided a cord or prenatal maternal blood sample and completed a prenatal home visit and were considered fully enrolled. Written informed consent was obtained in accordance with the Columbia University Medical Center Institutional Review Board.
Data on subject demographic characteristics, residence, and environmental exposures were obtained by questionnaires administered to mothers prenatally and at child ages 1, 2, 3, and 5 years. Participation rates at ages 1, 2, 3, and 5 years were 77%, 69%, 68%, and 47%, respectively (Appendix, Figure A.1). By September 30, 2010, 593 children (81.8% of the fully enrolled cohort) had reached age 5 years, and GIS and respiratory health data for at least one of the follow-up periods were recorded and available for the present analyses.
2.2. Residential GIS data
Detailed information on GIS data sources is provided in the online Appendix. A priori, seven GIS-based variables were selected to represent a diverse set of indices of air pollution exposure from traffic and stationary sources: proximity to state/county highway (km), roadway density (total km roadways/km2 land), truck route density (total km routes/km2 land), four-way street intersection density (number of intersections/km2 land), number of New York City transit bus stops, proximity to stationary source (percentage of residential buffer area within 0.80 km of an industrial facility), and percentage of building area designated for commercial use (indicator of volume of commercial vehicle and/or diesel traffic).
Except for proximity to highway, data were collected for a 250 m radial buffer around subjects’ homes during the prenatal period and at ages 1, 2, 3, and 5 years using ArcGIS version 9.3 (Redlands, CA, USA). The 250 m buffer size was selected based on findings from several studies conducted across diverse locations indicating that variables such as length of roadways, number of high traffic roads, and traffic density within 200 to 400 m of a sampling location significantly predicted air concentrations of traffic-related pollutants such as PM2.5, NO2, and elemental carbon (Brauer et al, 2003; Clougherty et al., 2008; Gehring et al. 2010; Karner et al., 2010; Morgenstern et al., 2007; Ryan et al., 2008; Zhou and Levy 2007).
2.3. Respiratory health data
Between children’s birth and age 5 years, data on the prevalence of wheeze and doctor diagnosis of asthma were collected by questionnaires administered to mothers. Data were collected every three months from birth to age 2 years and every six months from age 2 to 3 years and age 4 to 5 years. No health data were collected between ages 3 and 4 years. Wheeze and asthma were defined as dichotomous variables, i.e., no report versus any report of wheeze or physician-diagnosed asthma, respectively, by integrating data across the two to four questionnaires administered over the previous 12 months. Wheeze and asthma were calculated for subjects who had data available for at least one of the follow-up periods within a particular year of life. At least three follow-up questionnaires were completed by 89% and 64% of subjects through age 1 year and age 2 years, respectively. At least one of two questionnaires was completed by 73% of subjects between ages 2 and 3 years and by 69% between ages 4 and 5 years. Serum samples were collected at ages 2, 3, and 5 years, and concentrations of total IgE and allergen-specific IgE (mouse, German cockroach, Dermatophagoides farinae 1 dust mite, and cat) were quantified by immunoradiometric assay (Diagnostics Products Corp, Los Angeles, CA, USA) or by Immuno-CAP (Uppsala, Sweden) as described (Donohue et al., 2008). Allergic sensitization was analyzed dichotomously, with positive sensitization defined as any one of the four allergen-specific IgE concentrations greater than 0.35 IU/ml.
2.4. Statistical analysis
GIS variables were examined by assessing their distributions at each age and by using mixed effects models to characterize between- and within-subject variability. We chose to analyze associations between GIS variables and respiratory outcomes using generalized estimating equations as our primary interest was to estimate effects averaged over the population. Generalized estimating equations were developed for the analysis of longitudinal or repeated measures data through the specification of a working correlation matrix to account for correlation in outcomes within subjects (Liang and Zeger 1986). They have been used in similar analyses with repeated assessments of air pollution exposures and/or health outcomes (Gehring et al., 2010; Morgenstern et al., 2008). We specified a covariance structure that allowed for varying correlation among pairs of serially measured outcomes (Agresti, 2002) because correlations were unequal over time but did not necessarily decrease over time (Appendix, Tables A.1-A.3). Wheeze, asthma, and allergic sensitization were modeled as dichotomous variables using a logit link, and total IgE (log-transformed) was modeled as a continuous variable using a normal link.
We assessed associations between GIS variables at the prenatal residence and respiratory outcomes through age 5 years using generalized estimating equations. In order to separate statistically associations of concurrent exposures from prenatal exposures, we examined interactions between GIS variables and any change in residence after the prenatal period. Only subjects who moved had the potential for different prenatal and concurrent measures of proximity and density of air pollution sources. In cases where p-values for interaction terms were < 0.15, separate analyses were performed for the 339 subjects with any move after the prenatal period and the 254 subjects who never moved. To explore further whether associations varied among concurrent, earlier age, or cumulative exposures to air pollution sources, we conducted post-hoc analyses, in which we examined associations between outcomes and GIS variables assessed at the same or earlier age. Cumulative exposure effects were assessed with interactions terms between GIS variables and move status. If interaction terms had p-values < 0.15, analyses were stratified by move status.
Repeated measures analyses were adjusted for sex, ethnicity, presence of smokers in the home, annual household income, concentrations of German cockroach and mouse allergen measured in residential dust samples, and age. Interactions between GIS variables and age were examined to assess whether associations with respiratory outcomes varied across ages. Age-specific models included the same covariates except for age and GIS variable by age interaction terms. The rationale for covariate selection is described in the online Appendix.
All effect estimates are reported as odds ratios (ORs) with 95% confidence intervals (CIs), except for total IgE results, which are reported as ratios of the geometric means and 95% CIs. To facilitate comparisons among GIS variables that have different distributions, effect estimates are presented as the OR or change in total IgE per interquartile range (e.g., difference between the 75th and 25th percentile in proximity to roadway) increase in the magnitude of the GIS variable. All data were analyzed using SAS version 9.1.3 (SAS Institute, Cary, NC, USA), and results with p < 0.05 were considered statistically significant.
3. Results
3.1. Study population characteristics
Of the 593 subjects included in analyses, 485 (82%) had data available for 3 (n = 205) or 4 (n = 280) of the follow-up periods. The distributions of several demographic and health characteristics varied across the evaluated ages (Table 1). Between ages 1 and 5 years, the proportion of Dominican subjects decreased (63% to 57%), as did the proportion of households with smokers (23% to 18%). The proportion of children reported to have received a doctor diagnosis of asthma increased with age (10% to 21%), as did the proportion with positive allergic sensitization (12.7% to 30.7%) (Table 1).
Table 1.
Selected characteristics of the study population from age 1 to 5 years.
| Characteristic | Percenta (Number with characteristic/Total number analyzed)
|
||||
|---|---|---|---|---|---|
| Age 1 year | Age 2 years | Age 3 years | Age 5 years | ||
| Total number of subjects | 559 | 500 | 494 | 341 | |
| Sex | Male | 48% (268/559) | 45% (226/500) | 46% (227/494) | 44% (150/341) |
| Female | 52% (291/559) | 55% (274/500) | 54% (267/494) | 56% (191/341) | |
| Ethnicity | Dominican | 63% (354/559) | 62% (309/500) | 61% (300/494) | 57% (194/341) |
| African American | 37% (205/559) | 38% (191/500) | 39% (194/494) | 43% (147/341) | |
| Mother receiving Medicaid | 75% (415/558) | 77% (380/495) | 72% (352/492) | 72% (243/339) | |
| Annual income | <$10,000 | 39% (210/532) | 35% (166/475) | 34% (165/486) | 27% (92/336) |
| $10,000-19,999 | 34% (179/532) | 31% (149/475) | 33% (158/486) | 35% (116/336) | |
| ≥$20,000 | 27% (143/532) | 34% (160/475) | 34% (163/486) | 38% (128/336) | |
| Smoker in the household | Current | 23% (128/558) | 19% (97/500) | 19% (92/482) | 18% (55/299) |
| Any since birth | 32% (176/558) | 37% (185/500) | 39% (186/482) | 41% (124/299) | |
| Maternal asthma | 22% (83/383) | 22% (74/338) | 22% (73/336) | 21% (53/250) | |
| Doctor says child has asthma | 10% (55/558) | 15% (74/497) | 18% (90/489) | 21% (104/341) | |
| Any wheeze in previous 12 months | 38% (212/559) | 22% (112/500) | 19% (94/494) | 22% (94/341) | |
| Median [range] total IgE [IU/ml] | N/A | 37 [0-684] (n = 380) | 79 [1-2448] (n = 338) | 116 [0-1517] (n = 236) | |
| Positive allergic sensitizationb | Cockroach | N/A | 6.4% (24/373) | 10.4% (37/356) | 22.5% (53/236) |
| Mouse | N/A | 6.9% (26/378) | 7.8% (28/360) | 10.6% (25/235) | |
| Dust mite | N/A | 2.4% (9/376) | 4.4% (16/360) | 9.8% (23/236) | |
| Cat | N.A | 2.9% (9/306) | 5.6% (18/322) | 14.6% (34/232) | |
| Any positive | N/A | 12.7% (53/419) | 16.5% (65/394) | 30.7% (76/248) | |
Percentages may not add up to 100% because of rounding.
Any of the evaluated indoor allergen-specific IgE > 0.35 IU/ml.
The subjects included in these analyses (New York City residents with available GIS and respiratory outcome data) were representative of the fully enrolled cohort except for lower proportions with wheeze or reported asthma in analyzed subjects at age 5 years (Table 1 and Appendix, Table A.4). Although the present study group comprised only nonwhite children, it was representative of the largely nonwhite, low-income source population. The 2000 census data indicate that in Northern Manhattan and South Bronx, 58% of the population is Hispanic, and 29% is Black or African American (U.S. Census Bureau, 2000). Census data also indicate that 52% has an annual household income less than $20,000 (U.S. Census Bureau, 2000).
3.2. Geographic indicators of traffic and built environment
Among the 339 (57%) subjects who reported a change in residence between birth and age 5 years, 180 reported 1 address change, and 159 reported more than 1 address change. The distributions of residential GIS variables in the cohort overall were similar across ages, except that distance to highway increased with increasing age (Appendix, Table A.5). Among prenatal addresses, the median distance to state/county highways was 0.44 km, and the range was 0.01-3.8 km (Table 2). Among the 15-22% of subjects who changed addresses at each time point, wide ranges in change in proximity to highway were observed. For example, between ages 2 and 3 years, the range (interquartile range) of change in proximity to highway was -9.8 to 2.9 km (0.92) (Table 2). A wide range in proximity to stationary source also was observed, with some subjects living greater than 0.80 km away and others having the entire 250 m radial buffer located within 0.80 km of a stationary source. For all GIS variables, greater variability was observed between subjects than within subjects (range of intraclass correlation coefficients = 0.58-0.76) (Appendix, Table A.5); however, within-subject variability contributed significantly to the total variance of all variables (data not shown). Correlations among most GIS variables were weak (Appendix, Table A.6); however, four-way intersection density was correlated moderately with roadway density, number of bus stops, and percent commercial building area.
Table 2.
Distributions of GIS-based measures of air pollution sources within 250 m of homes at the prenatal address and the distributions for the change at each age among the subjects who moved between ages.
| GIS variable | Median (interquartile range), range | ||||
|---|---|---|---|---|---|
| Prenatal period | Change at age 1 year | Change at age 2 years | Change at age 3 years | Change at age 5 years | |
| Number of subjects who moved (%) | N/A | 95 (17) | 74 (15) | 98 (20) | 75 (22) |
|
| |||||
| Proximity to highway | 0.44 (0.96) | 0 (0.66) | 0.15 (1.2) | -0.23 (0.92) | 0.17 (0.83) |
| (km) | 0.01-3.8 | -4.1-2.5 | -2.5-3.6 | -9.8-2.9 | -2.5-4.6 |
|
| |||||
| Roadway density | 19.4 (4.2) | -0.32 (5.6) | 0.32 (6.1) | 0 (6.9) | -0.37 (8.5) |
| (km roadways/km2 land area) | 10.9-45.5 | -31.2-15.8 | -15.1-9.8 | -20.2-28.8 | -14.0-26.2 |
|
| |||||
| Truck route density | 2.5 (2.1) | -0.26 (2.6) | 0 (4.0) | 0 (3.6) | -0.34 (3.9) |
| (km truck routes/km2 land area) | 0-12.6 | -5.6-4.0 | -8.0-10.4 | -6.2-10.6 | -8.8-9.8 |
|
| |||||
| Four-way intersection density | 45.9 (30.6) | 0 (30.8) | -1.0 (35.7) | 0 (35.7) | 0 (41.5) |
| (# intersections/km2 land area) | 0-107 | -55-81 | -61.1-56.1 | -51.0-76.1 | -85.8-71.3 |
|
| |||||
| Number of New York City transit bus | 6 (5) | 0 (6) | -1 (6) | 1 (6) | -1 (6) |
| stops | 0-17 | -10-10 | -8-8 | -10-13 | -15-8 |
|
| |||||
| Stationary source proximity | 25.1 (33.3) | 0 (53.6) | 0 (71.5) | 0 (62.0) | 0 (68.9) |
| (% area within 0.80 km of source) | 0-100 | -84.6-97.9 | -100-71.2 | -100-72.8 | -88.9-82.6 |
|
| |||||
| Percentage of commercial building | 6.2 (5.3) | -0.68 (6.7) | -0.95 (8.8) | -0.29 (7.9) | -1.2 (10.2) |
| area | 0.55-56.8 | -96.8-30.0 | -97.4-46.6 | -24.2-47.3 | -32.3-21.7 |
3.3. Associations of GIS indicators of air pollution sources with concurrent wheeze, asthma, and IgE
In repeated measures models that adjusted for age, sex, ethnicity, smoker in the home, annual household income, and residential concentrations of cockroach and mouse allergen, four-way intersection density and percentage of building area designated for commercial use were associated significantly with concurrent increases in wheeze (Fig. 1 and Appendix, Table A.8). An increase of 30.6 intersections/km2 land (interquartile range) was associated with wheeze in the previous 12 months with an OR (95% CI) of 1.26 (1.01, 1.57). The interaction between four-way intersection density and move status was significant (p = 0.08), and the OR was larger in subjects who never moved (Appendix, Table A.8). The percentage of commercial building area had a smaller estimated effect on wheeze. Increasing proximity to highway (OR per 0.96 km increase in proximity: 1.26 [95% CI: 0.98, 1.62]) and higher roadway density (OR per 4.2 km roadways/km2 land: 1.19 [95% CI: 0.99, 1.43]) were associated with elevated odds of wheeze; however, the associations only approached statistical significance.
Fig. 1.
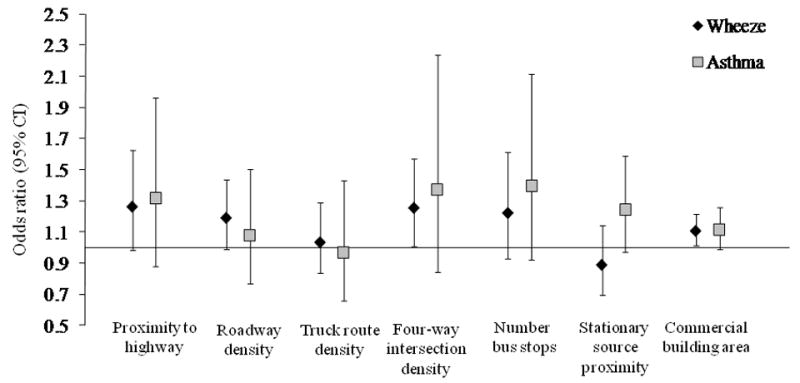
Associations of GIS variables measured repeatedly between birth and age 5 years with concurrent wheeze and parental report of physician-diagnosed asthma. Data points and error bars describes the odds ratio and 95% CI, respectively, for the association of an interquartile range increase in the magnitude of the GIS variable with the presence of wheeze or diagnosis of asthma by a physician in previous 12 months, adjusted for sex, ethnicity, presence of smoker in the home, annual income, residential cockroach allergen concentration, residential mouse allergen concentration, age, and age by GIS variable interaction.
In analyses that included all subjects, only associations of percent commercial building area and proximity to stationary air pollution sources with concurrently reported asthma approached statistical significance (Fig. 1 and Appendix, Table A.8). The association between proximity to stationary source and reported asthma was significant, however, in subjects who moved at least once through age 5 years (OR per 33.3% increase in residential area located within 0.80 km of a stationary source: 1.43 [95% CI: 1.03, 1.97]. Whereas associations of proximity to highway and number of bus stops with concurrently reported asthma were not significant among all subjects, they were significant among subjects who never moved (Appendix, Table A.8).
Positive associations were found between GIS variables and concurrently measured total IgE; however, associations did not significantly differ by move status (p-values for interactions between GIS variables and move status = 0.22-0.61). Among all subjects, the ratio of the geometric mean levels of total IgE was 1.25 (95% CI: 1.09, 1.42) per a 0.96 km increase in proximity to highway. Per a 5.3% increase in the percentage of commercial building area, the ratio of the geometric mean levels of total IgE was 1.55 (95% CI: 1.14, 2.11). None of the other GIS variables were associated significantly with a change in total IgE or with any positive indoor allergen-specific IgE (Fig. 2 and Appendix, Table A.8).
Fig. 2.

Associations of GIS variables measured repeatedly between ages 2 and 5 years with concurrent total IgE (log-transformed). Data points and error bars describe the ratio of the geometric means of total IgE and 95% CI, respectively, per an interquartile range increase in the magnitude of the GIS variable, adjusted for sex, ethnicity, presence of smoker in the home, annual income, residential cockroach allergen concentration, residential mouse allergen concentration, age, and age by GIS variable interaction.
In age-specific models with GIS variables and concurrently measured respiratory outcomes, associations showed small changes with increasing age of children (Appendix, Tables A.9-A.11). However, interactions between GIS variables and age were not statistically significant (data not shown). Odds ratios for the association between percentage commercial building area and concurrent wheeze were the most similar across ages (1.09-1.16). In contrast, for several GIS variables, associations with concurrently reported asthma were larger at ages 1 or 2 than at age 5 years.
3.4. Comparisons of different time windows of exposure
For several of the outcomes, proximity and density of air pollution sources at earlier childhood residences were associated significantly with wheeze and asthma later in childhood (Appendix, Tables A.9-A.11). Proximity to highway at ages 1, 2, and 3 was associated with wheeze at age 5 years, and ORs were larger than those for concurrent wheeze. The OR for proximity to highway at age 1 year and wheeze at age 5 years was higher among children who never moved (2.62) than among those who moved (1.06). Similarly, associations of roadway density, density of four-way intersections, and percent commercial building area at the age 1 home with wheeze at age 5 years were larger among children who never moved. Density of four-way intersections at age 1 year also was associated with wheeze at ages 2 and 3 years, and although ORs were higher among children who moved, they were not statistically significant (Appendix, Table A.9).
Most associations between earlier childhood exposures to air pollution sources and subsequent incidence of asthma were not significant (Appendix, Table A.10). For proximity to stationary source and percentage commercial building area, the highest ORs were found for age 2 exposures and incidence of asthma at age 3 years. Associations of proximity to highway and percentage commercial building area with total IgE were higher for concurrent exposures than for earlier childhood exposures (Appendix, Table A.11). For age-specific analyses of reported asthma and total IgE, interactions between GIS variables and move status were not significant (data not shown).
Among all subjects, prenatal exposures to air pollution sources were not significantly associated with wheeze, total IgE, or any positive allergen-specific IgE between birth and age 5 years (Appendix, Figures A.2 and A.3 and Table A.12). Although concurrent and early childhood proximity to stationary sources and percentage of commercial building area were associated significantly with reported asthma, prenatal exposures were not (Appendix, Figure A.2 and Table A.12). However, for several other GIS variables, associations with reported asthma were larger and significant for prenatal exposures compared with concurrent exposures. Associations of prenatal proximity to highway and four-way intersection density with reported asthma were larger in subjects who never moved from the prenatal residence (Appendix, Table A.12). For prenatal roadway density, the association with asthma was larger and significant among subjects who moved from the prenatal residence (OR: 1.61 [95% CI: 1.03, 2.52]). The number of bus stops at the prenatal residence also was associated with reported asthma between birth and age 5 years (OR: 1.65 [95% CI: 1.02, 2.64]); however, the interaction with move status was not statistically significant (p = 0.16).
4. Discussion
The novel objective of this study was to use repeated measures of GIS indicators of residential proximity and density of traffic and stationary sources of air pollution to represent long-term air pollution exposures of young children living in high-density New York City neighborhoods in Northern Manhattan and South Bronx. In analyses of repeated measures between birth and age 5 years, density of four-way intersections was associated significantly with wheeze, and proximity to highways was associated significantly with total IgE levels. Additionally, the percentage of commercial building area was associated positively with asthma, wheeze, and total IgE. The positive association between proximity to stationary sources of air pollution and reported asthma approached statistical significance. Moreover, in longitudinal analyses, several GIS variables assessed at the prenatal or earlier childhood residence were associated with wheeze and asthma later in childhood, particularly among subjects who never moved. Given that GIS traffic indicators have been strong predictors of ambient air pollutant concentrations across diverse urban locations, these findings indicate that concurrent, prenatal, early childhood, and cumulative exposure to air pollution each may contribute to respiratory morbidity among children during the first five years of life.
Approximately 50% of our cohort resided within 400-480 m of a state or county highway, a zone of elevated concentrations of traffic-related pollutants (Zhou and Levy 2007), as do 75% and 15% of children residing in Manhattan and the Bronx, respectively (Environmental Defense Fund, 2007). While the present findings may be limited to this cohort of Dominican and African American children, given the high percentage of urban populations residing near major roadways and the high prevalence of urban asthma (Akinbami et al., 2011), the implications of these findings for public health may be quite broad.
The major strength of this study was its longitudinal design. To date, most GIS-based studies have used GIS variables ascertained at a single point in time to represent long-term average exposures (Chang et al., 2009; Clark et al., 2010; Gordian et al., 2006; McConnell et al., 2006; Ryan et al., 2007). An additional strength was the availability of data from most subjects for 3-4 time points. Combined, these approaches allowed us to discern more accurately the temporality of associations between exposure and health outcomes and account for changing exposures in a population that moves frequently. Further, with these highly time-resolved GIS data, we were able to compare associations among different time windows of exposure. Such comparisons are important given prior evidence in this cohort of New York City children that both concurrent and prenatal air pollution exposures are associated with recurrent respiratory symptoms and asthma (Miller et al., 2004; Patel et al., 2009a; Rosa et al., 2010).
Because we did not examine associations between the various GIS variables and concentrations of ambient air pollutants, the findings may not be attributable entirely to the effects of exposure to particular traffic-related air pollutants but also may reflect effects related to socioeconomic status, social stressors such as demoralization or violence, or indoor sources of toxicants. However, in studies across diverse locations, different indicators of traffic and built environment have been associated with pollutants such as NO2, PM2.5, and black carbon (Brauer et al., 2008; Morgenstern et al., 2008; Patel et al., 2009b). By examining a diverse set of GIS variables representing traffic proximity, density, vehicle mix, industrial emission sources, and land use characteristics, we aimed to characterize whether particular surrogates of local air pollution mix and perhaps exposures to a mixture of air pollutants were associated with different measures of respiratory health. Further, the yearly individual-level GIS data provided information on air pollution exposures with improved spatial and temporal resolution compared with the air pollutant measurements available from the one to two central monitoring sites.
Associations of GIS indicators varied across the outcomes of wheeze, asthma, and IgE. This result was expected because the relationships among these measures are not fixed early in childhood, especially before age 5 or 6 years (Martinez 2002). Transient wheeze often due to viral infection is common in infancy (Brooks and Lemanske 2002; Lin et al., 2007) and may not predict persistent asthma later in childhood. Atopy also becomes more strongly associated with persistent asthma at older ages (Martinez 2002). Consistent with these published reports, the proportion of children in this cohort with wheeze was highest at age 1 year, whereas the proportion of children reported to be diagnosed with asthma was highest at age 5 years. At each age, there were children with reported asthma who did not wheeze in the previous 12 months (32%, 44%, 47%, and 18% at ages 1, 2, 3, and 5 years, respectively) and children without asthma who did wheeze (31%, 13%, 10%, and 12% at ages 1, 2, 3, and 5 years, respectively).
In this study, asthma was ascertained by parental report of a physician diagnosis. Diagnostic criteria were likely to vary among subjects’ physicians. Additionally, there are limitations to asthma diagnoses in children before age 5 years. Other conditions may have similar symptoms (Pedersen et al., 2011), and asthma before age 5 years may be transient (Martinez 2002). Despite these issues, we expect any error in the ascertainment of asthma to be independent of exposure to air pollution sources and more likely would have resulted in the underestimation of the effects of exposure to traffic and stationary sources of air pollution.
Notably, proximity to highway was associated not only with wheeze and total IgE but also with reported asthma among subjects who never moved, indicating that higher cumulative exposures to traffic-related pollutants between birth and age 5 years may be associated with all three outcomes. In support of our findings, other studies of children in the same age range also have found that greater proximity to major roadway (McConnell et al., 2006) or higher ambient air concentrations of traffic-related pollutants are associated with asthma among children who never moved (Gehring et al., 2010). Also in support of a cumulative exposure effect, we found that multiple measures of traffic volume at the age 1 residence, including proximity to highway, four-way intersection density, and roadway density, were associated significantly with wheeze at age 5 years in subjects who never moved.
The positive association between proximity to highway and total IgE is supported by previous findings that ambient concentrations of traffic-related pollutants such as nitrogen oxides and polycyclic aromatic hydrocarbons are associated with total IgE in children (Herr et al., 2011; Janssen et al. 2003). It has been postulated that ambient traffic-related particles can carry adsorbed allergens into airways and serve as adjuvants during the development of allergy (Diaz-Sanchez et al., 1994; Knox et al., 1997; Liu et al., 2008; Takenaka et al., 1995). We did not find GIS variables to be associated with sensitization to indoor allergens. However, evidence suggests that traffic density measures and air pollution exposures are associated with sensitization to outdoor allergens (Janssen et al., 2003; Kramer et al., 2000; Mortimer et al., 2008) and even food allergens (Brauer et al., 2007) rather than indoor allergens. Thus, the effect of traffic-related air pollution exposure on IgE may be dependent on specific allergens, and in the present study, we only had data on sensitization to indoor allergens.
Among the GIS indicators related specifically to diesel vehicle emissions (e.g., the number of bus stops, truck route density), we found the number of bus stops to be associated significantly with asthma but only when examining prenatal exposure or concurrent exposure among subjects who never moved. Characterizing associations with diesel emissions sources is difficult in the present study because of changes made to the composition of the New York City transit bus fleet (26% diesel-electric hybrid, 27% compressed natural gas, 95% of diesel buses fit with particulate filters by the end of the study period) and because of varying truck volumes among truck routes (Metropolitan Transit Authority, 2011; New York State Department of Transportation, 2011). The exposure measurement error associated with variable contributions of bus and truck emissions to ambient air concentrations of diesel exhaust particles across space and time may have biased associations with respiratory outcomes to the null. Additional investigation is required to characterize associations of the number of bus stops and truck route density with elemental or black carbon air concentrations in the present study area and whether these associations change over time.
We acknowledge that re-examination of these associations using smaller buffer sizes may have been informative. Meta-analyses have indicated that the concentrations of traffic-related pollutants remain elevated over a range of 100 to 500 m (Karner et al., 2011; Zhou and Levy 2007), a range that includes our 250 m buffer size. Additionally, several studies have found asthma or other respiratory outcomes in children to be associated with GIS variables calculated with a similar buffer size or pollutant concentrations estimated with similar buffer sizes (Brauer et al., 2007; Chang et al., 2009; Clark et al., 2010; Gehring et al., 2010; Maantay 2007; Morgenstern et al. 2007; Ryan et al., 2007). Associations also have been found for buffer sizes in the range of 50 to 100 m (Brauer et al., 2007; Clougherty et al., 2008; Gilbert et al., 2005; Gordian et al., 2006; McConnell et al., 2010; Ryan et al., 2007). Thus, in this study, we may have underestimated associations of some traffic sources with respiratory outcomes.
Associations of proximity to stationary sources of air pollution with respiratory morbidity in young children have not been examined widely. In the present study, we assessed the proportion of the 250 m radial buffer located within 0.80 km of an industrial facility included in the 2005 National Emissions Inventory or Toxic Release Inventory. No sites are located in Manhattan; however, facilities with emissions of polycyclic aromatic and other hydrocarbons and lead are located in the South Bronx (U.S. Environmental Protection Agency, 2005). The 0.80 km buffer was designated because it represents an area heavily impacted by source emissions and is associated with asthma exacerbations in the Bronx (Maantay 2007). The associations with asthma that we observed among subjects who moved and for age 2 exposures build on previous cross-sectional evidence (Clark et al., 2010; Maantay 2007) by suggesting that exposures earlier in childhood may impact the subsequent development of asthma. Commercial building area also has not been examined widely as an indicator of air pollution exposure. In the present study, commercial building area was associated positively with wheeze, asthma, and IgE. Commercial building area may serve as a good proxy for the level of traffic activity, and presumed traffic emissions, near the residence. Notably, commercial building area was correlated weakly with most other evaluated GIS variables and thus, also may serve as a surrogate for pollution mixtures or other complex characteristics of the urban environment, such as socioeconomic status and housing conditions that are associated with asthma and allergy.
Roadway density and proximity to highway at the prenatal residence were associated with reported asthma. Both prenatal and concurrent proximity to highway were associated more strongly with asthma among subjects who never moved, indicating that cumulative exposure may be more important than prenatal exposure alone. In contrast, the association of prenatal roadway density with asthma was significant only among children who moved after the prenatal period. While the critical time window of exposure may vary among different air pollution sources and the particular pollutants they may represent, it is important to acknowledge the difficulties in separating prenatal from concurrent exposures because repeated measures of GIS variables were highly correlated within subjects. In a recent study of this cohort, in main effects analyses, prenatal exposures to polycyclic aromatic hydrocarbons were not associated with asthma or IgE after controlling for postnatal exposures (Rosa et al., 2010). Further investigation of associations between GIS variables and residential concentrations of specific air pollutants will permit more meaningful comparisons across the various studies conducted in the Columbia Center for Children’s Environmental Health cohort.
5. Conclusions
In conclusion, the present findings demonstrate that in this longitudinal cohort of Dominican and African American children living in high-density New York City neighborhoods, residential proximity and density of traffic and stationary sources of air pollution are associated with wheeze, reported asthma, and higher levels of total IgE between birth and age 5 years. The findings suggest that long-term exposure to elevated concentrations of air pollution may be associated with respiratory morbidity in young children. Some variables indicate a concurrent or cumulative exposure effect and others indicate an effect of exposure during the prenatal or earlier childhood period. Further investigation is needed to assess whether these observations of varying critical time windows of exposure are due to particular air pollution constituents represented by the different GIS air pollution source metrics (e.g., traffic-related particles, specific components from tire and break wear, diesel exhaust particles).
Supplementary Material
Highlights.
Asthma, wheeze, and IgE were assessed repeatedly in children through age 5
Air pollution exposures were represented by nearby traffic and stationary sources
Traffic and stationary sources were associated longitudinally with asthma morbidity
Proximity to highway was associated with higher levels of total IgE
Long-term air pollution exposure may increase risk for developing asthma and wheeze
Acknowledgments
Sources of funding Funding for the study is provided by the National Institute of Environmental Health Sciences (grants R01 ES013163, P50ES015905, P01 ES009600, P30 ES 009089, and R01 ES008977), U.S. Environmental Protection Agency (grants R827027, RD-832141), Irving General Clinical Research Center (grant RR00645), Educational Foundation of America, Gladys & Roland Harriman Foundation, The New York Community Trust, Trustees of the Blanchette Hooker Rockefeller Fund, and John and Wendy Neu Family Foundation. The study was reviewed and approved by the Columbia University Medical Center Investigation Review Board (protocol number IRB-AAAB4576).
Role of the funding source Study sponsors had no role in study design; in the collection, analysis, and interpretation of data; in the writing of the report; and in the decision to submit the paper for publication.
Footnotes
Disclosure Statement The authors have no actual or potential financial or nonfinancial conflicts of interest to disclose.
Publisher's Disclaimer: This is a PDF file of an unedited manuscript that has been accepted for publication. As a service to our customers we are providing this early version of the manuscript. The manuscript will undergo copyediting, typesetting, and review of the resulting proof before it is published in its final citable form. Please note that during the production process errors may be discovered which could affect the content, and all legal disclaimers that apply to the journal pertain.
References
- Agresti A. Categorical data analysis. 2. Wiley and Sons; Hoboken: 2002. pp. 466–468. [Google Scholar]
- Akinbami LJ, Moorman JE, Liu X. National health statistics reports; no 32. Hyattsville, MD: National Center for Health Statistics; 2011. Asthma prevalence, health care use, and mortality: United States, 2005–2009. [PubMed] [Google Scholar]
- Brauer M, Hoek G, Smit HA, de Jongste JC, Gerritsen J, Postma DS, Kerkhof M, Brunekreef B. Air pollution and development of asthma, allergy and infections in a birth cohort. Eur Respir J. 2007;29:879–888. doi: 10.1183/09031936.00083406. [DOI] [PubMed] [Google Scholar]
- Brauer M, Hoek G, van Vliet P, Meliefste K, Fischer P, Gehring U, Cyrys J, Bellander T, Lewne M, Brunekreef B. Estimating long-term particulate air pollution concentrations: application of traffic indicators and geographic information systems. Epidemiology. 2003;14:228–239. doi: 10.1097/01.EDE.0000041910.49046.9B. [DOI] [PubMed] [Google Scholar]
- Brauer M, Lencar C, Tamburic L, Koehoorn M, Demers PA, Karr CJ. A cohort study of traffic-related pollution impacts on birth outcomes. Environ Health Perspect. 2008;116:680–686. doi: 10.1289/ehp.10952. [DOI] [PMC free article] [PubMed] [Google Scholar]
- Brooks GD, Lemanske RF. Infections and Asthma. Semin Respir Crit Care Med. 2002;23:339–346. doi: 10.1055/s-2002-34329. [DOI] [PubMed] [Google Scholar]
- Chang J, Delfino RJ, Gillen D, Tjoa T, Nickerson B, Cooper D. Repeated respiratory hospital encounters among children with asthma and residential proximity to traffic. Occup Environ Med. 2009;66:90–98. doi: 10.1136/oem.2008.039412. [DOI] [PubMed] [Google Scholar]
- Clark NA, Demers PA, Karr CJ, Koehoorn M, Lencar C, Tamburic L, Brauer M. Effect of early life exposure to air pollution on development of childhood asthma. Environ Health Perspect. 2010;118:284–290. doi: 10.1289/ehp.0900916. [DOI] [PMC free article] [PubMed] [Google Scholar]
- Clougherty JE, Wright RJ, Baxter LK, Levy JI. Land use regression modeling of intra-urban residential variability in multiple traffic-related air pollutants. Environ Health. 2008;7(17) doi: 10.1186/1476-069X-7-17. [DOI] [PMC free article] [PubMed] [Google Scholar]
- Diaz-Sanchez D, Dotson AR, Takenaka H, Saxon A. Diesel exhaust particles induce local IgE production in vivo and alter the pattern of IgE messenger RNA isoforms. J Clin Invest. 1994;94:1417–1425. doi: 10.1172/JCI117478. [DOI] [PMC free article] [PubMed] [Google Scholar]
- Donohue KM, Al-alem U, Perzanowski MS, Chew GL, Johnson A, Divjan A, Kelvin EA, Hoepner LA, Perera FP, Miller RL. Anti-cockroach and anti-mouse IgE are associated with early wheeze and atopy in an inner-city birth cohort. J Allergy Clin Immunol. 2008;122:914–920. doi: 10.1016/j.jaci.2008.08.034. [DOI] [PMC free article] [PubMed] [Google Scholar]
- Environmental Defense Fund. [18 February 2011];2007 Report: All Choked Up. Available: < http://www.edf.org/documents/6117_AllChokedUp_NYCTrafficandHealthReport.pdf>.
- Gauderman JW, Avol E, Gilliland F, Vora H, Thomas D, Berhane K, McConnell R, Kuenzli N, Lurmann F, Rappaport E, Margolis H, Bates D, Peters J. The effect of air pollution on lung development from 10 to 18 years of age. N Engl J Med. 2004;351:1057–1067. doi: 10.1056/NEJMoa040610. [DOI] [PubMed] [Google Scholar]
- Gehring U, Wijga AH, Brauer M, Fischer P, de Jongste JC, Kerkhof M, Oldenwening M, Smit HA, Brunekreef B. Traffic-related air pollution and the development of asthma and allergies during the first 8 years of life. Am J Respir Crit Care Med. 2010;181:596–603. doi: 10.1164/rccm.200906-0858OC. [DOI] [PubMed] [Google Scholar]
- Gilbert NL, Goldberg MS, Beckerman B, Brook JR, Jerrett M. Assessing spatial variability of ambient nitrogen dioxide in Montreal, Canada, with a land-use regression model. J Air Waste Manag Assoc. 2005;55:1059–1063. doi: 10.1080/10473289.2005.10464708. [DOI] [PubMed] [Google Scholar]
- Gordian ME, Haneuse S, Wakefield J. An investigation of the association between traffic exposure and the diagnosis of asthma in children. J Expos Sci Environ Epidemiol. 2006;16:49–55. doi: 10.1038/sj.jea.7500436. [DOI] [PubMed] [Google Scholar]
- Herr CEW, Ghosh R, Dostal M, Skokanova V, Ashwood P, Lipsett M, Joad JP, Pinkerton KE, Yap P, Frost JD, Sram R, Hertz-Picciotto I. Exposure to air pollution in critical prenatal time windows and IgE levels in newborns. Pediatr Allergy Immunol. 2011;22:75–84. doi: 10.1111/j.1399-3038.2010.01074.x. [DOI] [PubMed] [Google Scholar]
- Janssen NAH, Brunekreef B, van Vliet P, Aarts F, Meliefste K, Harssema H, Fischer P. The relationship between air pollution from heavy traffic and allergic sensitization, bronchial hyperresponsiveness, and respiratory symptoms in Dutch schoolchildren. Environ Health Perspect. 2003;111:1512–1518. doi: 10.1289/ehp.6243. [DOI] [PMC free article] [PubMed] [Google Scholar]
- Jerrett M, Arain MA, Kanaroglou P, Beckerman B, Crouse D, Gilbert NL, Brook JR, Finkelstein N, Finkelstein MM. Modeling the intraurban variability of ambient traffic pollution in Toronto, Canada. J Toxicol Environ Health A. 2007;70:200–212. doi: 10.1080/15287390600883018. [DOI] [PubMed] [Google Scholar]
- Jung KH, Patel MM, Moors K, Kinney PL, Chillrud SN, Whyatt R, Hoepner L, Garfinkel R, Yan B, Ross J, Camann D, Perera FP, Miller RL. Effects of heating season on residential indoor and outdoor polycyclic aromatic hydrocarbons, black carbon, and particulate matter in an urban birth cohort. Atmos Environ. 2010;44:4545–4552. doi: 10.1016/j.atmosenv.2010.08.024. [DOI] [PMC free article] [PubMed] [Google Scholar]
- Karner AA, Eisinger DS, Niemeier DA. Near-Roadway Air Quality: Synthesizing the Findings from Real-World Data. Environ Sci Technol. 2010;44:5334–5344. doi: 10.1021/es100008x. [DOI] [PubMed] [Google Scholar]
- Kim JJ, Smorodinsky S, Lipsett M, Singer BC, Hodgson AT, Ostro B. Traffic-related air pollution near busy roads: the East Bay Children’s Respiratory Health Study. Am J Respir Crit Care Med. 2004;170:520–526. doi: 10.1164/rccm.200403-281OC. [DOI] [PubMed] [Google Scholar]
- Knox RB, Suphioglu C, Taylor P, Desai R, Watson HC, Peng JL, Bursill LA. Major grass pollen allergen Lol p 1 binds to diesel exhaust particles: implications for asthma and air pollution. Clin Exp Allergy. 1997;27:246–251. [PubMed] [Google Scholar]
- Kramer U, Koch T, Ranft U, Ring J, Behrendt H. Traffic-related air pollution is associated with atopy in children living in urban areas. Epidemiology. 2000;11:64–70. doi: 10.1097/00001648-200001000-00014. [DOI] [PubMed] [Google Scholar]
- Lena TS, Ochieng V, Carter M, Holguin-Veras J, Kinney PL. Elemental carbon and PM2.5 levels in an urban community heavily impacted by truck traffic. Environ Health Perspect. 2002;110:1009–1015. doi: 10.1289/ehp.021101009. [DOI] [PMC free article] [PubMed] [Google Scholar]
- Liang KY, Zeger SL. Longitudinal data analysis using generalized linear models. Biometrika. 1986;73:13–22. [Google Scholar]
- Lin RY, Pitt TJ, Lou WWY, Qilong Y. Asthma hospitalization patterns in young children relating to admission age, infection presence, sex, and race. Ann Allergy Asthma Immunol. 2007;98:139–145. doi: 10.1016/S1081-1206(10)60686-2. [DOI] [PubMed] [Google Scholar]
- Liu J, Ballaney M, Al-alem U, Quan C, Jin X, Perera F, Chen L-C, Miller RL. Combined inhaled diesel exhaust particles and allergen exposure alter methylation of T helper genes and IgE production in vivo. Toxicol Sci. 2008;102:76–81. doi: 10.1093/toxsci/kfm290. [DOI] [PMC free article] [PubMed] [Google Scholar]
- Maantay J. Asthma and air pollution in the Bronx: Methodological and data considerations in using GIS for environmental justice and health research. Health Place. 2007;13:32–56. doi: 10.1016/j.healthplace.2005.09.009. [DOI] [PubMed] [Google Scholar]
- Martinez FD. Development of wheezing disorders and asthma in preschool children. Pediatrics. 2002;109:362–367. [PubMed] [Google Scholar]
- McConnell R, Berhane K, Yao L, Jerrett M, Lurmann F, Gilliland F, Künzli N, Gauderman J, Avol E, Thomas D, Peters J. Traffic, susceptibility, and childhood asthma. Environ Health Perspect. 2006;114:766–772. doi: 10.1289/ehp.8594. [DOI] [PMC free article] [PubMed] [Google Scholar]
- McConnell R, Islam T, Shankardass K, Jerrett M, Lurmann F, Gilliland F, Gauderman J, Avol E, Kunzli N, Yao L, Peters J, Berhane K. Childhood Incident Asthma and Traffic-Related Air Pollution at Home and School. Environ Health Perspect. 2010;118:1021–1026. doi: 10.1289/ehp.0901232. [DOI] [PMC free article] [PubMed] [Google Scholar]
- Metropolitan Transit Authority. Facts and Figures. [3 June 2011];2011 Available: < http://www.mta.info/nyct/facts/>.
- Miller RL, Garfinkel R, Horton M, Camann D, Perera FP, Whyatt RM, Kinney PL. Polycyclic aromatic hydrocarbons, environmental tobacco smoke, and respiratory symptoms in an inner-city birth cohort. Chest. 2004;126:1071–1078. doi: 10.1378/chest.126.4.1071. [DOI] [PMC free article] [PubMed] [Google Scholar]
- Morgenstern V, Zutavern A, Cyrys J, Brockow I, Gehring U, Koletzko S, Bauer CP, Reinhardt D, Wichmann H-E, Heinrich J. Respiratory health and individual estimated exposure to traffic-related air pollutants in a cohort of young children. Occup Environ Med. 2007;64:8–16. doi: 10.1136/oem.2006.028241. [DOI] [PMC free article] [PubMed] [Google Scholar]
- Morgenstern V, Zutavern A, Cyrys J, Brockow I, Koletzko S, Kramer U, Behrendt H, Herbarth O, von Berg A, Bauer CP, Wichmann HE, Heinrich J. Atopic diseases, allergic sensitization, and exposure to traffic-related air pollution in children. Am J Respir Crit Care Med. 2008;177:1331–1337. doi: 10.1164/rccm.200701-036OC. [DOI] [PubMed] [Google Scholar]
- Mortimer K, Neugebauer R, Lurmann F, Alcorn S, Balmes J, Tager I. Early-lifetime exposure to air pollution and allergic sensitization in children with asthma. J Asthma. 2008;45:874–881. doi: 10.1080/02770900802195722. [DOI] [PubMed] [Google Scholar]
- New York State Department of Transportation. Traffic Count Hourly Report. [3 June 2011];2011 Available: < http://ftp.dot.state.ny.us/tdv/YR2008/R11/01_Bronx/01_1264.pdf> and < http://ftp.dot.state.ny.us/tdv/YR2008/R11/04_New%20York/04_1123.pdf>.
- Patel MM, Chillrud SN, Correa JC, Feinberg M, Hazi Y, Deepti KC, Prakash S, Ross JM, Levy D, Kinney PL. Spatial and temporal variations in traffic-related particulate matter at New York City high schools. Atmos Environ. 2009b;43:4975–4981. doi: 10.1016/j.atmosenv.2009.07.004. [DOI] [PMC free article] [PubMed] [Google Scholar]
- Patel MM, Chillrud SN, Correa JC, Feinberg M, Hazi Y, KC D, Prakash S, Levy D, Kinney PL. Traffic-related particles and respiratory symptoms among urban adolescents. Environ Health Perspect. 2010;118:1338–1343. doi: 10.1289/ehp.0901499. [DOI] [PMC free article] [PubMed] [Google Scholar]
- Patel MM, Hoepner L, Garfinkel R, Chillrud S, Reyes A, Quinn JW, Perera F, Miller RL. Ambient metals, elemental carbon, and wheeze and cough in New York City children through 24 months of age. Am J Respir Crit Care Med. 2009a;180:1107–1113. doi: 10.1164/rccm.200901-0122OC. [DOI] [PMC free article] [PubMed] [Google Scholar]
- Pedersen SE, Hurd SS, Lemanske RF, Becker A, Zar HJ, Sly PD, Soto-Quiroz M, Wong G, Bateman ED. Global strategy for the diagnosis and management of asthma in children 5 years and younger. Pediatr Pulmonol. 2011;46:1–17. doi: 10.1002/ppul.21321. [DOI] [PubMed] [Google Scholar]
- Perera FP, Rauh V, Tsai W-Y, Kinney P, Camann D, Barr D, Bernert T, Garfinkel R, Tu Y-H, Diaz D, Dietrich J, Whyatt RM. Effects of transplacental exposure to environmental pollutants on birth outcomes in a multiethnic population. Environ Health Perspect. 2003;111:201–205. doi: 10.1289/ehp.5742. [DOI] [PMC free article] [PubMed] [Google Scholar]
- Rage E, Jacquemin B, Nadif R, Oryszczyn MP, Siroux V, Aguilera I, Kauffmann F, Kunzli N Epidemiological Study on the Genetics Environment of Asthma. Total serum IgE levels are associated with ambient ozone concentration in asthmatic adults. Allergy. 2009;64:40–46. doi: 10.1111/j.1398-9995.2008.01800.x. [DOI] [PubMed] [Google Scholar]
- Rosa MJ, Jung KH, Perzanowski MS, Kelvin EA, Darling KW, Camann DE, Chillrud SN, Whyatt RM, Kinney PL, Perera FP, Miller RL. Prenatal exposure to polycyclic aromatic hydrocarbons, environmental tobacco smoke and asthma. Respir Med. 2010 doi: 10.1016/j.rmed.2010.11.022. In Press. [DOI] [PMC free article] [PubMed] [Google Scholar]
- Ryan PH, Lemasters GK, Biswas P, Levin L, Lindsey M, Bernstein DI, Lockey J, Villareal M, Khurana Hershey GK, Grinshpun SA. A comparison of proximity and land use regression traffic exposure models and wheezing in infants. Environ Health Perspect. 2007;115:278–284. doi: 10.1289/ehp.9480. [DOI] [PMC free article] [PubMed] [Google Scholar]
- Ryan PH, LeMasters GK, Levin L, Burkle J, Biswas P, Hu S, Grinshpun S, Reponen T. A land-use regression model for estimating microenvironmental diesel exposure given multiple addresses from birth through childhood. Sci Total Environ. 2008;404:139–147. doi: 10.1016/j.scitotenv.2008.05.051. [DOI] [PubMed] [Google Scholar]
- Takenaka H, Zhang K, Diaz-Sanchez D, Tsien A, Saxon A. Enhanced human IgE production results from exposure to the aromatic hydrocarbons from diesel exhaust: Direct effects on B-cell IgE production. J Allergy Clin Immunol. 1995;95:103–115. doi: 10.1016/s0091-6749(95)70158-3. [DOI] [PubMed] [Google Scholar]
- Tonne CC, Whyatt RM, Camann DE, Perera FP, Kinney PL. Predictors of personal polycyclic aromatic hydrocarbon exposures among pregnant minority women in New York City. Environ Health Perspect. 2004;112:754–759. doi: 10.1289/ehp.5955. [DOI] [PMC free article] [PubMed] [Google Scholar]
- United States Census Bureau. Summary File 3 [SF3] Sample Data. [12 May 2011];2000 Available: < www.census.gov/prod/cen2000/doc/sf3.pdf>.
- United States Environmental Protection Agency. Toxic Release Inventory TRI. Toxic Release Inventory Explorer. Facility reports. [18 February 2010];2005 Available: < http://www.epa.gov/cgi-bin/broker?view=COFA&trilib=TRIQ0&sort=_VIEW_&sort_fmt=1&state=36&county=36005&chemical=_ALL_&industry=ALL&year=2005&tab_rpt=1&fld=RELLBY&fld=TSFDSP&_service=oiaa&_program=xp_tri.sasmacr.tristart.macro>.
- Zhou Y, Levy JI. Factors influencing the spatial extent of mobile source air pollution impacts: a meta-analysis. BMC Public Health. 2007;7(89) doi: 10.1186/1471-2458-7-89. [DOI] [PMC free article] [PubMed] [Google Scholar]
Associated Data
This section collects any data citations, data availability statements, or supplementary materials included in this article.