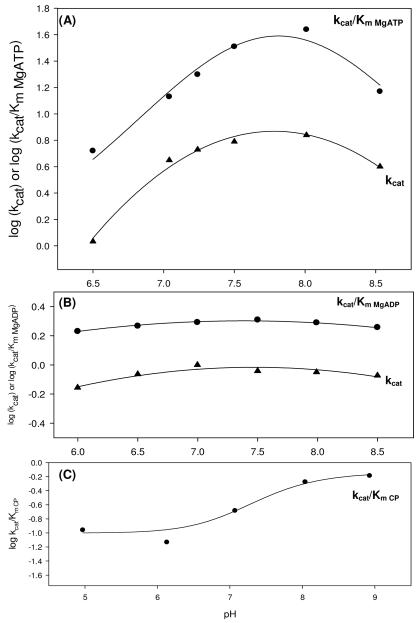
Figure 3.
pH profiles for the pyruvate carboxylation reaction (A), full reverse reaction (B) and MgADP phosphorylation reaction (C) catalyzed by wild-type RePC. (A) For the dependence of kcat/Km for pyruvate carboxylation on pH, pK1 = 8.0 ± 0.1, pK2 = 8.09 ± 0.01 and pK0-pK2 = 8.2 ± 0.5 values were obtained with MgATP as the variable substrate and data fits to eqn (5). kcat data were fitted to eqn (6) and values of pK1 = 6.6 ± 0.8, pK2 = 8.5 ± 0.2 and pK0-pK2 = 7.4 ± 0.2 were obtained. (B) Two pKas were observed in both the kcat/Km MgADP (pK1 = 5.2 ± 0.1 and pK2 = 9.5 ± 0.2) and kcat (pK1 = 5.30 ± 0.08 and pK2 = 9.4 ± 0.1) pH profiles for the full reverse reaction (eqn (7)). (C) The pH had only a partial effect on phosphorylation of MgADP by carbamoyl phosphate and the kcat/Km pH profile showed two pKas (pK1= 6.9 ± 0.2 and pK2 = 7.7 ± 0.2) with carbamoyl phosphate was the variable substrate. Data were fitted to eqn (8).

