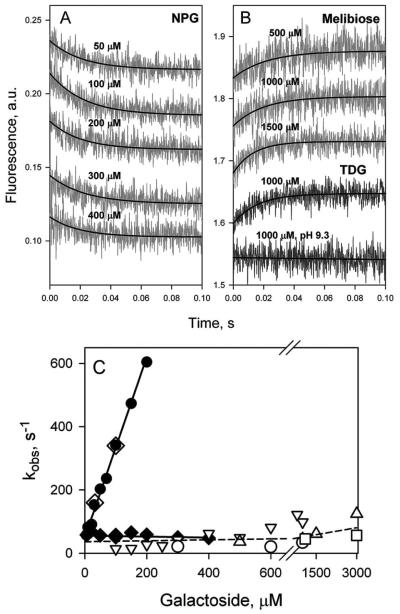
Figure 10.
Comparison of the rates of galactoside binding to N245W mutant reconstituted into proteoliposomes with the rates of opening of the periplasmic cavity. (A) Binding of NPG to protein reconstituted into proteoliposomes measured by Trp151→NPG FRET. Stopped-flow traces are shown for 5 sugar concentrations. Single-exponential fits are shown as black lines. B. Unquenching of Trp245 fluorescence resulting from opening of the periplasmic cavity upon sugar binding. Stopped-flow traces are recorded with the mutant in DDM after mixing with melibiose (3 upper traces) or TDG (2 lower traces) at pH 6.0, except for the trace at pH 9.3. (C) Concentration dependence of sugar binding rates and rates of periplasmic pathway opening. Binding rates (kobs) estimated for purified mutant in DDM (●); reconstituted in proteoliposomes (◆), and after dissolving proteoliposomes in DDM (◇). The reconstituted mutant binds NPG with kobs = 56 ± 7 s−1. Rates of unquenching of Trp245 fluorescence resulting from opening of the periplasmic cavity after sugar binding measured in DDM solution and presented as open symbols: TDG (▽); melibiose (△); octyl-α-d-galactoside (○); methyl-α-d-galactoside (□). The rate of opening of periplasmic cavity in DDM is 50 - 100 s−1 at the saturating concentrations of all 4 galactosides tested.

