Abstract
In natural viewing, an object’s background often changes over time. Temporally varying backgrounds were investigated here with a steady test field within a time-varying surrounding chromaticity. With slow surround variation (below ~3 Hz), the color appearance of a steady test is also perceived to fluctuate. At somewhat higher temporal frequencies, however, temporal variation of the surround is visible but the test appears steady (R. L. De Valois, M. A. Webster, K. K. De Valois, & B. Lingelbach, 1986); also above ~3 Hz, temporal chromatic variation along the l- or s-axis of the MacLeod–Boynton space (symmetric about equal-energy-spectrum “white”) shifts the steady appearance of the test field toward redness or yellowness, respectively (A. D. D’Antona & S. K. Shevell, 2006). In the study here, color shifts were measured with temporal surround modulation at 6 Hz or greater along axes intermediate to the l and s directions. Varying the relative phase of simultaneous surround variation in l and s should not change responses within independent l and s pathways but should differentially excite neural representations that combine l and s signals (so-called higher order chromatic mechanisms). Varying the phase of l and s showed that the induced color shifts were accounted for by neural responses both from nearly independent l and s pathways and from higher order chromatic mechanisms.
Keywords: chromatic induction, temporal variation, higher order color mechanisms, independent pathways
Introduction
Chromatic induction is a well-known example of context influencing our perception of objects. A classic textbook demonstration shows that the same physical (nominally) gray field may be perceived to have different color appearances when presented within different chromatic surrounds.
The study of chromatic induction and of the factors that mediate the phenomenon are mostly within the spatial domain; few studies consider the role of temporal factors (D’Antona & Shevell, 2006; De Valois, Webster, De Valois, & Lingelbach, 1986; Webster & Mollon, 1991,1994). Nonetheless, temporal variation of surrounding context is common in natural viewing. In complex scenes, background temporal variation may result from visually tracking a moving object, from a moving observer fixating a stationary object that is closer in depth than the background, or from a temporally changing background. In psychophysical experiments, temporal variation in the background can be achieved by keeping a central (often nominally gray) field steady while temporally varying the chromaticity in the surround.
When the surround is temporally varied in chromaticity near 1 Hz, the color appearance of the physically steady central region is also perceived to vary (Krauskopf, Zaidi, & Mandler, 1986). When the surround is varied at higher temporal frequencies (above about 3 Hz), however, temporal variation within the surround remains visible but the central region appears steady (De Valois et al.,1986). Moreover, if the surround modulation above 3 Hz is along the l-axis (L/(L + M)) or the s-axis (S/(L + M)) of the MacLeod–Boynton chromaticity diagram (MacLeod & Boynton, 1979; time-average chromaticity metameric to equal-energy-spectrum [EES] “white”), the steady color appearance of the central region shifts toward redness or yellowness, respectively (D’Antona & Shevell, 2006). The shift toward redness disappears above about 18 Hz whereas the shift toward yellowness disappears at lower frequencies, between 9 and 13 Hz.
What might explain the color shifts in a steady achromatic region surrounded by a time-varying fieldwith EES (“white”) time-average chromaticity? A so-called “sandwich” model is proposed (Figure 1): a nonlinear response precedes and follows separate linear temporal filters (D’Antona & Shevell, 2006). The initial linear temporal filter begins attenuation at a relatively high temporal frequency (well above 3 Hz). The signal then passes through a nonlinearity, resulting in a shift in the time-average response. This causes the color of the central region to shift because the time-average neural response from the surround no longer is the same as the neural response to the time-average surrounding stimulation. In the model, the nonlinearity serves only to establish an asymmetric neural response around the time average of the chromatic modulation so many different nonlinearities are possible. The response from the nonlinear stage then passes through a second linear filter that strongly attenuates temporal frequencies above 3 Hz so little or no induced temporal variation is passed above 3-Hz surround modulation. In this model, the second linear filter causes the steady appearance of the center when surround frequencies are above ~3 Hz. The first linear filter controls the temporal frequencies that reach the nonlinearity, and therefore which temporal frequencies induce steady color shifts due to the nonlinear stage. At frequencies above ~18 Hz (l-axis) or 9–13 Hz (s-axis), the first filter nearly abolishes the chromatic induction when the steady test and the time average in the surround have the same chromaticity. Note that the order of the three components is important for explaining the temporal dynamics of the induced steady color shift. If the nonlinearity were before the first linear temporal filter, then the temporally varying surround would induce a steady color shift at any arbitrarily high temporal frequency, which does not occur. Thus, a separate temporal filter must precede the nonlinearity. To account for a steady shift at inducing frequencies as low as 3 Hz, a second linear temporal filter must be after the nonlinearity because if it were prior to the nonlinear stage there would be no induced steady color shift above 3 Hz.
Figure 1.
Diagram showing how the two linear filters and the nonlinear response of the “sandwich” model may influence chromatic induction from a temporally varying surround (see text for further explanation).
The present study focuses on the two linear filters of the proposed “sandwich” model, specifically considering the neural representations at each stage and their loci in the visual system.
Standard model of color vision
According to the standard model of color vision, color processing begins with stimulation of the three types of cones, L, M, and S. Next, the cone responses are combined in antagonistic receptive fields to form three largely independent postreceptoral responses (Derrington, Krauskopf, & Lennie, 1984; Krauskopf, Williams, & Heeley, 1982; Shevell & Kingdom, 2008; Solomon & Lennie, 2007): two chromatic pathways, L/(L + M) and S/ (L + M) (henceforth called the l and s pathways, respectively) and a luminance pathway (L + M). The l pathway contrasts L- and M-cone responses and the s pathway contrasts the response of S-cones with the sum of L- and M-cones. The three largely independent pathways originate in the retina and remain segregated through the lateral geniculate nucleus (LGN) of the thalamus up to at least early input layers in V1 where physiological measurements of neurons adapted to pure l contrast, pure s contrast, or combinations of both suggest that the chromatic pathways remain independent mechanisms (Tailby, Solomon, Dhruv, & Lennie, 2008). The temporal properties of neuronal firing within the independent pathways in the LGN are too fast to explain the observed attenuation of temporally varying induced color changes at frequencies as low as 3 Hz. Cortical neurons generally are described as having slower response characteristics (De Valois et al., 1986), and therefore a cortical site is suggested for induced steady color shifts from a temporally varying surround above 4 Hz. This cortical site could be at a locus where the two chromatic mechanisms are still independent, as in the input layers of V1, or later in the visual system where psychophysical and physiological evidence suggests that the two independent chromatic pathways combine into multiple “higher order” chromatic mechanisms (Horwitz, Chichilnisky, & Albright, 2007; Krauskopf, Williams, Mandler, & Brown, 1986; Lennie, Krauskopf, & Sclar, 1990; Wachtler, Sejnowski, & Albright, 2003; Webster & Mollon, 1991, 1994).
Experimental rationale
The locus of the second linear temporal filter (Experiment 1)
In this study, chromaticity coordinates are expressed in the MacLeod–Boynton chromaticity diagram (MacLeod & Boynton, 1979). Importantly for the rationale, modulation along intermediate axes stimulates both the l and s pathways simultaneously. Changing only the relative temporal phase of the simultaneous modulation along the l- and s-axes does not change the stimulation of each independent pathway.
Consider the neural processes comprising the second linear temporal filter of the “sandwich” model. If they are at a level in the visual system where the l and s pathways are independent, then the steady response from each independent pathway to, say, 6 Hz, modulation should be unaffected by the activity in the other pathway (by definition of independence). The response in each pathway, therefore, should be independent of the relative phase of temporal stimulus variation for the two pathways. When the two pathways contribute to the induced color percept, the steady l and steady s chromatic representations should result in the same induced color appearance regardless of the relative temporal phase between l and s stimulations.
If instead the second linear temporal filter originates at a level in the visual pathway after l and s responses combine, then changing the relative phase of l and s stimulations may cause different induced steady color shifts. For example, the induced color shift may depend on whether high l and high s stimulations occur synchronously (hue variation from magenta to green) or high l is synchronous with low s (variation from orange to aqua).
The locus of the first linear temporal filter (Experiment 2)
If the first linear temporal filter is within independent l and s pathways, then a specific prediction can be made based on a previous finding: the induced steady color shift with surround modulation along only the s-axis in MacLeod–Boynton space is first attenuated at a lower temporal frequency than the induced shift with modulation along only the l-axis (D’Antona & Shevell, 2006). If the first linear temporal filter is within separate l and s pathways, then there should be a temporal frequency at which some chromatic temporal variation is passed in the l pathway but not in the s pathway. With simultaneous temporal modulation in the surround along both l- and s-axes, independent pathways allow the s, but not the l, pathway to stop passing temporal variation to the non-linearity at some temporal frequency, in which case there would be a steady induced color shift in only the l direction.
If instead the first linear temporal filter is located at a level in the visual system where the l and s pathways have combined then simultaneous excitation of both pathways (by varying the surround stimulation along both the l- and s-axes) should not result in a shift along only the l-axis. Instead the shift may reflect the individual temporal tuning of each higher order chromatically selective mechanism.
Materials and methods
Equipment
The experiment took place in a dark room where subjects viewed the stimuli from a distance of 1 m. A chin rest provided head stabilization. All stimuli were displayed on a Sony color cathode ray tube (CRT) display (Model GDM-F520) with a resolution of 1360 × 1024 and a refresh rate set to 75 Hz (noninterlaced). The computer controlling the CRT was a Macintosh G4 with a Radius video board supplying 10-bit resolution for each gun.
Calibration
The outputs from the R, G, and B guns of the CRT were linearized using a 10-bit lookup table. The maximal luminance for each of the guns was measured periodically to check for drift throughout the course of the experiment. The spectral distribution of each of the three phosphors was measured at the maximal output using a Photo-Research PR 650 spectroradiometer.
Color space
Stimuli were expressed along the l- and s-axes of the MacLeod–Boynton chromaticity diagram (MacLeod & Boynton, 1979), where l = L/(L + M) and s = S/(L + M). The scaling of the s-axis is arbitrary and was set here so that s was 1.0 at equal-energy-spectrum (EES) “white”. The Smith and Pokorny (1975) cone fundamentals were used to derive the L, M, and S values used in the Macleod–Boynton color space.
Stimulus
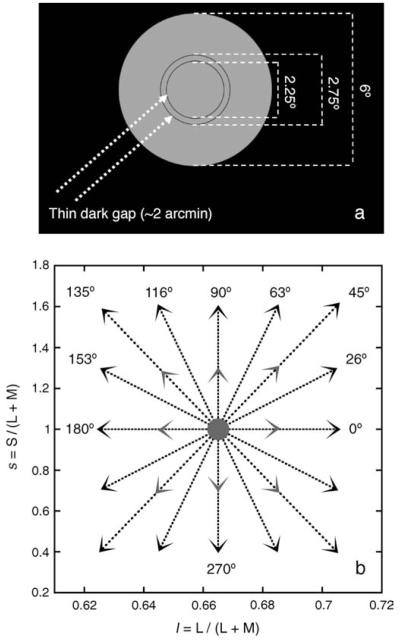
All stimuli (see Figure 2a) had a luminance of 12.8 cd/ m2 and were presented in the center of the CRT screen on a dark background (luminance below 1 cd/m2). The time-average chromaticity of all stimuli was metameric to EES (l = 0.665, s = 1.0). Stimuli consisted of an annulus having an inner diameter of 2.25° and an outer diameter of 2.75° (therefore having a width of 0.25°). The annulus was embedded in a disc with a diameter of 6°. The edges of the annulus were delineated by a thin dark ~2 arcmin gap. When the chromaticity of the 6° disc was varied rapidly over time, a pronounced sensation of flicker was seen in the annulus even though the color did not appear to change (cf. De Valois et al., 1986). Introducing the dark ~2 arcmin gap between the modulating surround and the annulus strongly reduced the perception of flicker in the annulus. The gap also eased the task of the subject by enhancing the boundary between the annulus and its surround, thereby making it easier to assess the color of the annulus (D’Antona & Shevell, 2009).
Figure 2.
(a) Stimulus used in the experiment, shown to scale. (b) Arrowheads mark the chromaticity coordinates of the endpoints of the axes of modulation used in the experiment, shown in a MacLeod–Boynton chromaticity diagram. Axes of modulation (stippled lines) were always symmetric around the EES “white” at the center of the chromaticity diagram (gray circle). The chromaticity diagram shows 8 high-contrast lines of modulation around EES (black arrowheads) and also 4 low-contrast lines of modulation around EES at 0°, 45°, 90°, and 135° (gray arrowheads).
Heterochromatic flicker photometry (HFP) at 12.5 Hz was used to determine equiluminance for each subject. Equiluminance (in this case, the radiance ratio between two different CRT guns causing the least sensation of flicker) can change with the size of the flickering fields. Since the stimulus consisted of two parts with two different sizes (the surround with a diameter of 6° and the annular test field with a width of 0.25°), HFP measurements were made with a large flickering field subtending 5.8° and a smaller field subtending 1°. Pilot measurements showed that the two different HFP values so obtained did not alter the results of the experiment. HFP values obtained with the 1° field were used to set equiluminance for each observer.
The surround was modulated in time along the l and/or s directions at two different contrast levels (square wave). At the highest level, it reached 6% contrast along the l direction (Michaelson contrast (lmax − lmin) / (lmax + lmin)) and 60% along the s direction. At a lower level, it reached 3% contrast along l and 30% contrast along s. Combinations of these contrast levels created 8 chromatic lines always crossing the chromaticity metameric to EES and always at equiluminance (see Figure 2b). Surround modulations at 0°, 45°, 90°, and 135° were tested at both high- and low-contrast levels. A control condition in which the annulus was within a steady surround metameric to EES was also included in the experiment.
Conditions
In each session, the surround was modulated in time along each of the twelve different chromatic modulation conditions shown in Figure 2b. The steady EES surround condition was also run in each session (chromaticity coordinates in the center of the chromaticity diagram in Figure 2b). In total, 13 different surrounds were used in each session. All 13 surround conditions were tested 5 times for a total of 65 trials per session. All trials were presented in random order in each session. Because the focus of this investigation was the induced steady color shift in the annular test area, only frequencies that would result in a steady induced color shift were included. The frequencies of temporal modulation were 6.25, 9.38, 18.75, and 37.5 Hz.
Subjects
All subjects completed consent forms in accordance with the policy of the University of Chicago’s Institutional Review Board. Three subjects participated in the experiments (age 26 to 35 years). Two were authors (JC and AD) and one was a naive paid observer (CF). A Rayleigh match and a Moreland match (Moreland & Kerr, 1979; Pokorny, Smith, Veriest, & Pinckers, 1979) confirmed normal color vision in all subjects. One subject wore eyeglasses, which were checked to assure that they did not have any chromatic filtering.
Subject CF ran three sessions and subject JC ran four sessions for each of the 4 different temporal frequencies. Subject AD ran four sessions at 6.25 and 9.38 Hz and two sessions at 18.75 and 37.5 Hz. In each session, only one frequency was used. The specific frequency in a session was chosen quasi-randomly (all frequencies were tested once before any frequency was tested a second time).
Procedure
All sessions started with 3 min of dark adaptation after which the surround and annulus appeared. The subject’s task was to set the appearance of the annulus so that it appeared to be achromatic (achromatic cancellation or “nulling”). Using a gamepad, the observer changed thechromaticity of the annulus along the l- and s-axes of the MacLeod–Boynton color space. Subjects were free to inspect the whole display but were told to fixate the annulus when judging its color. After a given trial, the next trial would appear without delay. The average amount of time required for a session was about 1 h. High temporal-frequency sessions were finished faster (approx. 45 min) than low temporal-frequency sessions (approx. 1–1.5 h).
Results
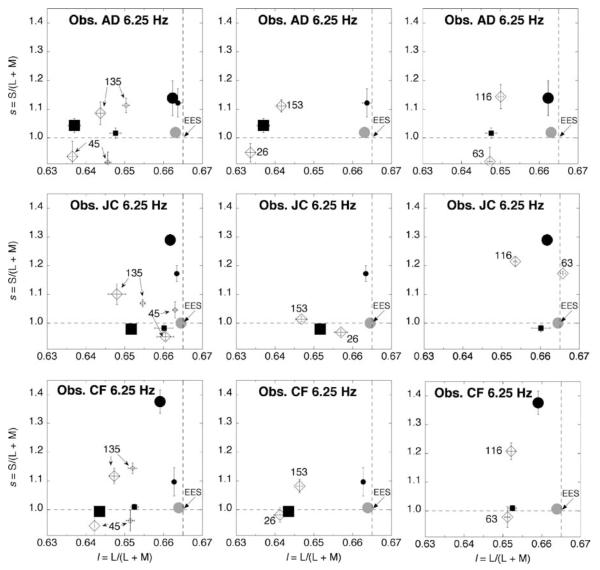
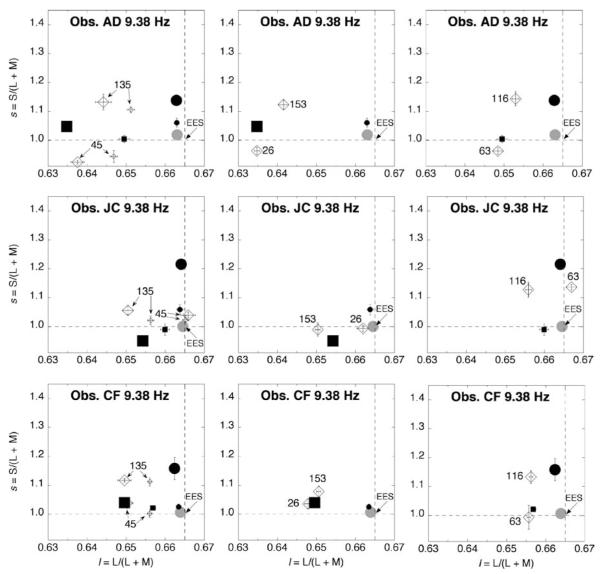
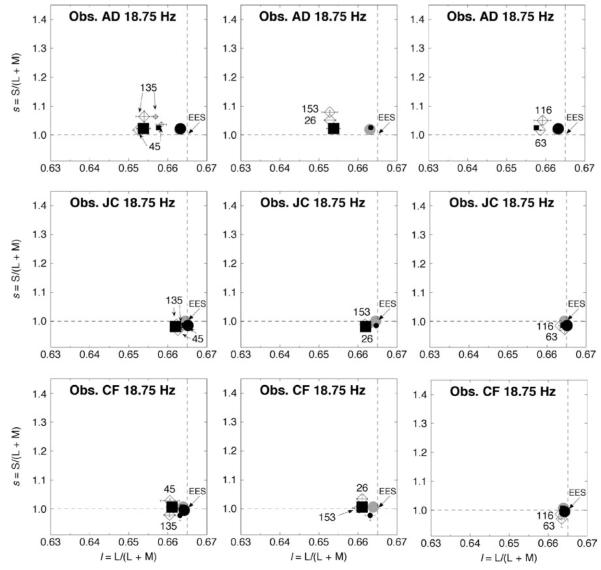
Measurements for temporal modulation at 6.25, 9.38, and 18.75 Hz are shown in Figures 3, 4, and 5, respectively. For each of the three subjects, the results are broken down in panels (one for the 45° and 135° directions, one for 26° and 153°, and one for 63° and 116°). In each panel, the two directions have identical stimulus modulation along l and along s, considered independently (see Figure 2b). The two directions, however, have opposite phase for l and s. For comparison, each panel plots measurements also for modulation along the isolated l (0°) and s (90°) axes. The control condition with a steady EES surround (solid gray circle) is also shown.
Figure 3.
Induced color shifts measured at 6.25-Hz temporal modulation of the surround. Measurements are shown for three observers. Large (small) black circles are color shifts resulting from high (low)-contrast surround modulation along only the s-axis (90°). Large (small) black squares are color shifts resulting from high (low)-contrast surround modulation along only the l-axis (0°). These values are replotted in panels in the second and third columns when they correspond to the level of l or s contrast for the panel’s angles of modulation. Large diamonds are color shifts from surround modulation along intermediate directions. Small diamonds are color shifts from surround modulation of 45° and 135° when both l and s are at low contrast. Angles of modulation for intermediate directions are noted next to each plotted point. Solid gray circle is the measurement from the control condition with a steady surround metameric to EES. Dashed lines cross at coordinates of EES. Error bars indicate ±1 SEM. Axes as in Figure 2b.
Figure 4.
As Figure 3 but for surround modulation at 9.38 Hz.
Figure 5.
As Figure 3 but for surround modulation at 18.75 Hz. For ease of comparison, the symbols are as in Figures 3 and 4. Some symbols representing low-contrast modulation on both l and s are hidden.
The most important feature in Figures 3 (6.25 Hz) and 4 (9.38 Hz) is the large separation between measurements obtained for modulation along the 45° versus 135° axes; the 26° versus 153° axes; and the 63° versus 116° axes. As the temporal frequency of modulation increases, the color shifts become smaller, which corroborates previous work (De Valois et al., 1986). At 18.75 Hz (Figure 5), the measurements approach EES for observers JC and CF: for AD, the color shifts are much weaker than at the lower temporal frequencies (cf. Figures 3 and 4).
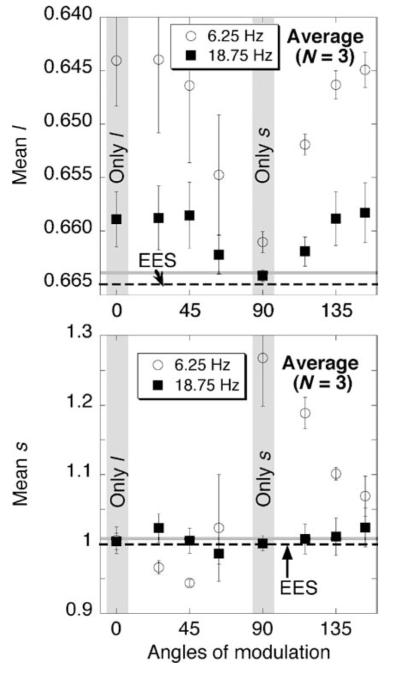
The l and s settings for the eight axes of chromatic surround modulation where there is high-contrast modulation along at least one of the two main axes l or s (see Figure 2b) are plotted for both 6.25 (circles) and 18.75 (squares) Hz in Figure 6. Plotted values are the averages taken over the 3 observers. On the horizontal axis, the angle of modulation starts at 0° and runs counterclockwise through to 153° (see Figure 2b). With the surround modulating at 18.75 Hz (squares), the induced color resulting from modulation along the 90° (only s) axis is virtually indistinguishable from the measurements for the control condition with a steady EES surround (gray horizontal line) in both the top and bottom panels. An induced color shift resulting from modulation along the 0° (only l) axis at 18.75 Hz (leftmost square in each panel), on the other hand, occurs only along the l-axis (top panel) and not the s-axis (bottom panel). This is in accord with earlier work discussed in the Introduction section, which is accounted for by a first linear filter that stops passing temporal chromatic variation at a lower frequency for s-axis modulation than for l-axis modulation (D’Antona & Shevell, 2006). Modulation along intermediate directions results in shifts that are very similar in l (top panel, Figure 6) for any chromatic direction that has the same l component of surround modulation (see Figure 2b): 0°, 26°, 45°, 135°, and 153° have about the same l value; 63° and 116° have their own lower level for l; and at 90° the l value is essentially the same as for the steady EES control condition. For measurements of s (bottom panel), chromatic modulation at 18.75 Hz causes no significant shift in the s settings compared to the s settings with a steady EES surround (P > 0.05 by Dunnet’s test to compare each of the eight axes of modulation to the steady control). The same analysis was carried out for each individual observer. There was no significant difference between the control and any of the eight major axes of modulationfor subjects CF and JC. For subject AD, there was a significant difference between the steady control and modulation at 135° and at 153°.
Figure 6.
Top (bottom) panel shows l values (s values) of color shifts for all angles of modulation at 6.25 Hz (open circles) and 18.75 Hz (black squares). Error bars indicate ±1 SEM. Dashed lines indicate the l or s value for the metamer to equal-energy-spectrum (EES) “white”. Gray horizontal lines show measurements from the control condition with a steady surround metameric to EES. The horizontal axis shows the angle of surround modulation (angles tested were 0°, 26°, 45°, 63°, 90°, 116°, 135°, and 153°; see Figure 2b).
At 37.5 Hz (Figure 7), all observers had measurements with the temporally modulated surround that were very close to those with the steady surround at the time-average (EES) chromaticity, which of course is no surprise (De Valois et al., 1986). The “sandwich” model accounts for this because the first linear temporal filter allows no temporal variation to pass and therefore the nonlinearity and the second linear temporal filter are driven by a constant signal. The 37.5-Hz condition served as a control that verified the chromaticity of the time average of the surround was metameric to EES, as intended.
Figure 7.
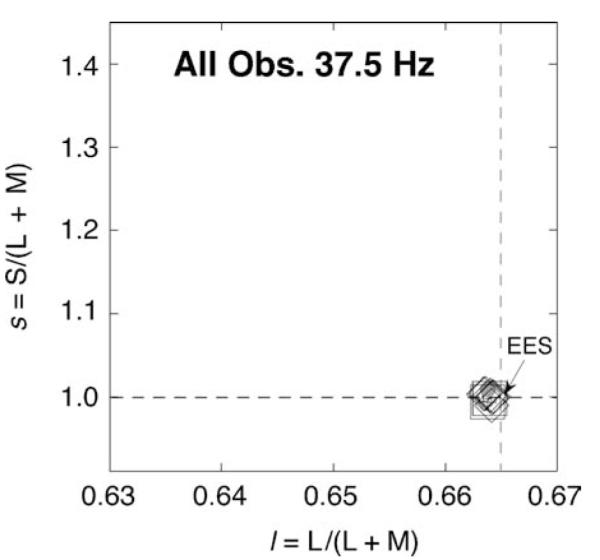
Mean results for three subjects at 37.5 Hz. Diamonds are for surround modulation along intermediate directions. Squares are surround modulation along only l (0°) at high contrast and only s (90°) at high contrast. Gray circle is for the steady surround metameric to EES. Many symbols are hidden.
While it is conceivable that rods contributed to the induced steady color shifts, the stimulus design used here kept average rod stimulation constant in all conditions because the average chromaticity was constant (constant chromaticity guarantees constant rod stimulation from a 3-phosphor CRT). Nonetheless, the 16 chromaticities constituting the 8 chromatic-modulation pairs (the eight conditions depicted in Figure 2b with high contrast along at least one major axis) differentially stimulate rods. Rod excitation for each of the 16 chromaticities was calculated by weighting the relative spectral distribution of each phosphor (wavelength by wavelength) by the scotopic luminosity function V’(λ). Then, these three numbers (one for each phosphor) were weighted by the relative level of each of the three CRT guns for the particular chromaticity. These 16 rod-excitation values were used to calculate rod Michelson contrast for each of the eight pairs of chromaticities. Rod sensitivity should be higher after an hour in the dark experimental room so if rods contributed to induced color shifts they should have done so more after an hour. Therefore, the difference between the first and last chromatic null settings could be due to a rod contribution. To evaluate this possibility, the eight rod contrast values (one for each modulation pair) were correlated with the l difference and, separately, with the s difference, between the first and last chromatic settings made with temporal modulation at 6.25 Hz. The correlations were nonsignificant and of opposite sign across observers, which fails to support the possibility that rods affected the induced color shifts (observer JC: l-axis r = 0.05 (P < 0.78, two-tailed) and s-axis r = 0.22 (P < 0.22); observer CF: l-axis r = 0.03 (P < 0.9) and s-axis r = −0.28 (P < 0.18); observer AD: l-axis r = −0.22 (P < 0.22) and s-axis r = −0.22 (P < 0.22)).
Discussion
The color shifts caused by modulation along only one of the intermediate directions (e.g., either 45° or 135°) might suggest that color shifts are due to independent contributions from the l and s pathways. For example, a gain control mechanism in each independent chromatic pathway (before combining output from the two pathways; Singer & D’Zmura, 1995) might cause the color shift from either 45° or 135° surround modulation. Importantly, however, such an explanation fails to account for the different color shifts resulting from 45° versus 135° chromatic modulation.
The only difference between 45° and 135° modulations is the relative phase of s and l temporal variations. At 45°, +s and +l (as well as −s and −l) occur at the same time; at 135°, +s and −l (as well as −s and +l) co-occur. The phase difference would not affect the adapted state of independent s and l pathways. The measurements in Figures 3 and 4 show that the phase alters the induced steady color shift. This can be explained in the context of the “sandwich model” only if the second linear temporal filter is at a neural locus where responses from s and l chromatic pathways are combined. If instead the second linear temporal filter were within the two early independent chromatic pathways, then each of these two pathways should produce a steady response that would not change with the relative phase of s and l stimulations. Consequently, when the two pathways combine they would produce the same color shifts with modulation along either 45° or 135°, which is contrary to the experimental results. In terms of the known physiology of the two independent pathways, this suggests a neural location of the second linear temporal filter beyond the early input layers in V1, which is the latest recorded site where independence is maintained (Tailby et al., 2008).
The measurements also show that the first linear temporal filter of the “sandwich” model is driven primarily by two independent l and s pathways. Figure 6 compares measurements (average of three observers) with surround modulation at 6.25 Hz and 18.75 Hz. At 18.75 Hz, significant color shifts occur along only the l-axis, not the s-axis (no significant change in the s settings compared to the control with a steady EES surround). Further, at 18.75 Hz all chromatic angles in the surround with the same magnitude of l modulation give nearly the same l shift. Finally, for l but not for s, at any given angle the color shift at 18.75 Hz is nearly a constant fraction of the shift at 6.25 Hz. This was true also for all three observers when inspected individually. These results are consistent with a first linear filter within an independent l pathway.
Surround modulation at 18.75 Hz along only the s-axis does not cause a significant change in the s settings for any of the three subjects (again, change in the s settings is defined relative to the control with a steady EES surround). If this finding is accompanied by no changes in the s settings when the surround is being modulated at 18.75 Hz along any of the seven other chromatic lines in Figure 2b (lines where modulation along at least one main axis has high contrast), a straightforward interpretation is that the first linear temporal filter is located within an independent s pathway. For observers JC and CF, there is no significant change in the s settings along any chromatic line of modulation at 18.75 Hz, which supports a first linear temporal filter being within an independent s pathway. For observer AD, however, there is a significant change for the s setting (compared to the steady EES control) when modulating at 18.75 Hz along two chromatic lines: 135° and 153°. The significant differences for this observer go against the strict property of a first linear temporal filter being within a completely independent s pathway. None-theless, considering all measurements from every observer on both the l- and s-axes, a good first-order account is a first linear temporal filter within independent l and s pathways.
Measurements of the color shifts obtained in the present experiment can be compared with some similar measurements reported by D’Antona and Shevell (2006). The comparison is possible because the stimulus conditions were similar in the two studies. In the experiment here, the background was darker and the annulus was a little narrower than in the previous work, but otherwise the stimuli were the same. In D’Antona and Shevell (2006), a matching paradigm was used. Surrounds were modulated along either the l- or s-axis in MacLeod–Boynton color space. When modulating along the l-axis, subjects were allowed to match by adjusting only along l in the comparison field; when modulating surrounds were along the s-axis subjects were allowed to adjust only along s. In a matching paradigm, the induced color shift toward yellowness is matched in the comparison field by decreasing the chromaticity of the comparison field along the s-axis. In a nulling paradigm, however, the same color shift is nulled by increasing the chromaticity of the test field along the s-axis. Similarly, surround modulation along the l-axis causes a shift toward redness in the test field that is matched in a comparison field by increasing excitation on the l-axis or nulled by decreasing stimulation along the l-axis. Qualitatively, the new and old measurements are consistent though there is a quantitative difference in the magnitude of shift measured by matching versus nulling. The difference in induced color shifts found between a “matching” paradigm (D’Antona & Shevell, 2006) and a “nulling” paradigm is not surprising given earlier studies comparing these techniques (Brown,1992). Overall, the experiments reported here corroborate induced steady color shifts as measured with a matching paradigm, using a different psychophysical technique to measure the induced shifts.
Conclusion
In conclusion, the induced steady color shifts are accounted for well by the “sandwich model” (Figure 1) with its component neural mechanisms at two distinct levels within the visual system. An initial linear filter is at a locus with nearly independent l and s chromatic pathways; a nonlinear response follows; and then a second linear temporal filter is at a locus after signals from the l and s pathways are combined.
Acknowledgments
This work is supported by NIH Grant EY-04802 (SKS) and the Inge Lehmann Grant of 1983 (JHC).
Footnotes
Commercial relationships: none.
Contributor Information
Jens H. Christiansen, Department of Psychology, University of Copenhagen, Copenhagen, Denmark, & Department of Psychology, University of Chicago, Chicago, Illinois, USA
Anthony D. D’Antona, Department of Psychology, University of Chicago, Chicago, Illinois, USA
Steven K. Shevell, Departments of Psychology and Ophthalmology and Visual Science, University of Chicago, Chicago, Illinois, USA
References
- Brown RO. Differences in matching versus cancellation methods of color measurement are due to contrast expansion mechanism. Investigative Ophthalmology & Visual Science. 1992;33:700. [Google Scholar]
- D’Antona AD, Shevell SK. Induced steady color shifts from temporally varying surrounds. Visual Neuroscience. 2006;23:483–487. doi: 10.1017/S0952523806233248. [DOI] [PubMed] [Google Scholar]
- D’Antona AD, Shevell SK. Induced temporal variation at frequencies not in the stimulus: Evidence for a neural nonlinearity. Journal of Vision. 2009;9(3):12, 1–11. doi: 10.1167/9.3.12. http://journalofvision.org/9/3/12/, doi:10.1167/9.3.12. [DOI] [PMC free article] [PubMed] [Google Scholar]
- Derrington AM, Krauskopf J, Lennie P. Chromatic mechanisms in lateral geniculate nucleus of macaque. The Journal of Physiology. 1984;357:241–265. doi: 10.1113/jphysiol.1984.sp015499. [DOI] [PMC free article] [PubMed] [Google Scholar]
- De Valois RL, Webster MA, De Valois KK, Lingelbach B. Temporal properties of brightness and color induction. Vision Research. 1986;26:887–897. doi: 10.1016/0042-6989(86)90147-1. [DOI] [PubMed] [Google Scholar]
- Horwitz GD, Chichilnisky EJ, Albright TD. Cone inputs to simple and complex cells in V1 of awake macaque. Journal of Neurophysiology. 2007;97:3070–3081. doi: 10.1152/jn.00965.2006. [DOI] [PubMed] [Google Scholar]
- Krauskopf J, Williams DR, Heeley DW. Cardinal directions of color space. Vision Research. 1982;22:1123–1131. doi: 10.1016/0042-6989(82)90077-3. [DOI] [PubMed] [Google Scholar]
- Krauskopf J, Williams DR, Mandler MB, Brown AM. Higher order color mechanisms. Vision Research. 1986;26:23–32. doi: 10.1016/0042-6989(86)90068-4. [DOI] [PubMed] [Google Scholar]
- Krauskopf J, Zaidi Q, Mandler MB. Mechanisms of simultaneous color induction. Journal of the Optical Society of America A, Optics and Image Science. 1986;3:1752–1757. doi: 10.1364/josaa.3.001752. [DOI] [PubMed] [Google Scholar]
- Lennie P, Krauskopf J, Sclar G. Chromatic mechanisms in striate cortex of macaque. Journal of Neuroscience. 1990;10:649–669. doi: 10.1523/JNEUROSCI.10-02-00649.1990. [DOI] [PMC free article] [PubMed] [Google Scholar]
- MacLeod DI, Boynton RM. Chromaticity diagram showing cone excitation by stimuli of equal luminance. Journal of the Optical Society of America. 1979;69:1183–1186. doi: 10.1364/josa.69.001183. [DOI] [PubMed] [Google Scholar]
- Moreland JD, Kerr J. Optimization of a Rayleigh-type equation for the detection of tritanomaly. Vision Research. 1979;19:1369–1375. doi: 10.1016/0042-6989(79)90209-8. [DOI] [PubMed] [Google Scholar]
- Pokorny J, Smith VC, Veriest G, Pinckers AJLG, editors. Congenital and acquired color vision defects. Grune & Stratton; New York: 1979. pp. 109–118. [Google Scholar]
- Shevell SK, Kingdom FA. Color in complex scenes. Annual Review of Psychology. 2008;59:143–166. doi: 10.1146/annurev.psych.59.103006.093619. [DOI] [PubMed] [Google Scholar]
- Singer B, D’Zmura M. Contrast gain control: A bilinear model for chromatic selectivity. Journal of the Optical Society of America A, Optics, Image Science, and Vision. 1995;12:667–685. doi: 10.1364/josaa.12.000667. [DOI] [PubMed] [Google Scholar]
- Smith VC, Pokorny J. Spectral sensitivity of the foveal cone photopigments between 400 and 500 nm. Vision Research. 1975;15:161–171. doi: 10.1016/0042-6989(75)90203-5. [DOI] [PubMed] [Google Scholar]
- Solomon SG, Lennie P. The machinery of colour vision. Nature Reviews, Neuroscience. 2007;8:276–286. doi: 10.1038/nrn2094. [DOI] [PubMed] [Google Scholar]
- Tailby C, Solomon SG, Dhruv NT, Lennie P. Habituation reveals fundamental chromatic mechanisms in striate cortex of macaque. Journal of Neuroscience. 2008;28:1131–1139. doi: 10.1523/JNEUROSCI.4682-07.2008. [DOI] [PMC free article] [PubMed] [Google Scholar]
- Wachtler T, Sejnowski TJ, Albright TD. Representation of color stimuli in awake macaque primary visual cortex. Neuron. 2003;37:681–691. doi: 10.1016/s0896-6273(03)00035-7. [DOI] [PMC free article] [PubMed] [Google Scholar]
- Webster MA, Mollon JD. Changes in colour appearance following post-receptoral adaptation. Nature. 1991;349:235–238. doi: 10.1038/349235a0. [DOI] [PubMed] [Google Scholar]
- Webster MA, Mollon JD. The influence of contrast adaptation on color appearance. Vision Research. 1994;34:1993–2020. doi: 10.1016/0042-6989(94)90028-0. [DOI] [PubMed] [Google Scholar]


