

B eq is a well defined entity that represents one property, mean-square displacement, of the anisotropic atomic displacement parameter tensor from which it is derived. B eq is not, however, the best estimate of the B factor that would result from isotropic model refinement. A new entity B est is proposed to serve this purpose.
Keywords: macromolecular refinement, TLS, anisotropy
Abstract
Crystallographic structural models for macromolecules have typically included an isotropic displacement parameter B iso for each atom. In cases where the structural model instead includes anisotropic displacement parameters U ij, the derived quantity B eq can be substituted for B iso for many purposes. B eq is not, however, the best predictor of the value B iso that would hypothetically have been obtained by direct refinement of an isotropic model. A new entity B est is proposed that represents an estimate for B iso that minimizes the Kullback–Leibler divergence from a paired anisotropic model. In general B est/B eq < 1, with the difference between the two values becoming larger for atoms that are more anisotropic. Although this difference does not affect direct refinement of either isotropic or anisotropic models, it is relevant to any analysis that compares isotropic and anisotropic models of the same underlying structure. In particular, it may lead to improved selection of multi-group TLS models based on analysis of an initial isotropic refinement.
1. The origin of B eq
Two forms of atomic displacement parameters (ADPs) are commonly used in crystallographic models. Models refined against atomic-resolution data usually include a  symmetric tensor U for each atom that describes anisotropic displacement. Models refined at lower resolution usually include instead an isotropic term B
iso for each atom. Both the isotropic and anisotropic ADPs describe a three-dimensional Gaussian probability density function centered on the mean position of the corresponding atom. Because crystals of macromolecules typically diffract only to modest resolution, the use of B
iso has been particularly common in structural models for macromolecules. Indeed, the standard ATOM record for structures archived in the Protein Data Bank (PDB) contains a field for a single ‘Temperature factor’ (Berman et al., 2007 ▶), and many software tools that manipulate PDB files expect an isotropic ADP to be provided here.
symmetric tensor U for each atom that describes anisotropic displacement. Models refined at lower resolution usually include instead an isotropic term B
iso for each atom. Both the isotropic and anisotropic ADPs describe a three-dimensional Gaussian probability density function centered on the mean position of the corresponding atom. Because crystals of macromolecules typically diffract only to modest resolution, the use of B
iso has been particularly common in structural models for macromolecules. Indeed, the standard ATOM record for structures archived in the Protein Data Bank (PDB) contains a field for a single ‘Temperature factor’ (Berman et al., 2007 ▶), and many software tools that manipulate PDB files expect an isotropic ADP to be provided here.
The choice to use isotropic ADPs in macromolecular crystallography is a concession to the limited number of Bragg reflections available at lower resolution; only four parameters per atom [ are required for a model with isotropic ADPs as opposed to nine parameters per atom for a model with anisotropic ADPs. It is not driven by an expectation that macromolecular crystals exhibit less anisotropy. On the contrary, the inherent flexibility of macromolecules combined with the high solvent content and relatively loose lattice packing they exhibit when crystallized leads to substantial atomic anisotropy (Hinsen, 2008 ▶). This is borne out experimentally both by refinement of anisotropic ADPs for the small fraction of protein structures that diffract to true atomic resolution (Schneider, 1996 ▶; Merritt, 1999b
▶) and by the improved R-factors obtained even for low-resolution structures when relatively simple descriptions of bulk anisotropy are added to the model (Merritt, 2011 ▶). Thus it is becoming standard practice in protein crystallography to include an explicit model for bulk anisotropic displacements (Zucker et al., 2010 ▶). The most common approach is to treat segments of the protein as approximately rigid groups exhibiting concerted displacements described by the translation/libration/screw (TLS) formalism (Trueblood, 1978 ▶; Howlin et al., 1989 ▶; Winn et al., 2001 ▶; Painter & Merritt, 2006 ▶). A second approach is to model concerted atomic displacements as arising from normal mode vibrations identified by an elastic network model (Poon et al., 2007 ▶). In both approaches these bulk models are applied to generate conventional anisotropic ADP descriptions for each atom, which are in turn used to calculate the gradients that drive crystallographic refinement (Winn et al., 2001 ▶; Chen et al., 2007 ▶). The individual anisotropic ADPs derived in this way are Gaussian approximations to the non-Gaussian distributions described by the TLS or normal mode displacements, an approximation that is strictly valid only in the limiting case of infinitesimal displacement amplitude.
are required for a model with isotropic ADPs as opposed to nine parameters per atom for a model with anisotropic ADPs. It is not driven by an expectation that macromolecular crystals exhibit less anisotropy. On the contrary, the inherent flexibility of macromolecules combined with the high solvent content and relatively loose lattice packing they exhibit when crystallized leads to substantial atomic anisotropy (Hinsen, 2008 ▶). This is borne out experimentally both by refinement of anisotropic ADPs for the small fraction of protein structures that diffract to true atomic resolution (Schneider, 1996 ▶; Merritt, 1999b
▶) and by the improved R-factors obtained even for low-resolution structures when relatively simple descriptions of bulk anisotropy are added to the model (Merritt, 2011 ▶). Thus it is becoming standard practice in protein crystallography to include an explicit model for bulk anisotropic displacements (Zucker et al., 2010 ▶). The most common approach is to treat segments of the protein as approximately rigid groups exhibiting concerted displacements described by the translation/libration/screw (TLS) formalism (Trueblood, 1978 ▶; Howlin et al., 1989 ▶; Winn et al., 2001 ▶; Painter & Merritt, 2006 ▶). A second approach is to model concerted atomic displacements as arising from normal mode vibrations identified by an elastic network model (Poon et al., 2007 ▶). In both approaches these bulk models are applied to generate conventional anisotropic ADP descriptions for each atom, which are in turn used to calculate the gradients that drive crystallographic refinement (Winn et al., 2001 ▶; Chen et al., 2007 ▶). The individual anisotropic ADPs derived in this way are Gaussian approximations to the non-Gaussian distributions described by the TLS or normal mode displacements, an approximation that is strictly valid only in the limiting case of infinitesimal displacement amplitude.
The output from refining this sort of model thus consists of direct estimates for the atomic positional coordinates and for the bulk displacement parameters. From these can be derived estimates of per-atom anisotropic Gaussian displacements. As in the case of refining a model at atomic resolution with anisotropic Gaussian ADPs for each atom, there is no direct refinement of a quantity equivalent to B iso. Nevertheless, as noted above, some software expects to have available a value representing the isotropic displacement of each atom. The quantity recommended for this purpose by the International Union of Crystallography (IUCr) (IUCr Commission on Journals, 1986 ▶) is
where U is the conventional symmetric tensor describing the displacement of that atom as an anisotropic three-dimensional Gaussian in Cartesian coordinates (Hamilton, 1959 ▶; Trueblood et al., 1996 ▶). The physical interpretation of B
eq is the mean-square displacement averaged over all directions. This is appropriate for the generation of figures that use a mean-square displacement isosurface as a visual cue for atomic displacement, e.g.
ORTEP (Burnett & Johnson, 1996 ▶). B
eq is also adequate for qualitative evaluation of the relative vibrational motion of various parts of a structure. But it is not necessarily the best choice for other quantitative purposes. In particular, it is not the best estimate of the isotropic ADP B
iso that would be obtained through direct refinement, as will be shown in this paper.
This distinction becomes important when an anisotropic model, for example a specific set of groups to be described by TLS, is chosen based on an existing model that was refined isotropically. In this case one wants to select from among many possible alternative anisotropic models the one model that makes the observed set of B iso values most likely. Thus a better estimator for B iso may lead to improved model selection.
2. An alternative to B eq
Consider two possible models for the scattering contribution of a particular atom, the first containing an anisotropic description U of displacement about its mean position, the second containing an isotropic description V of displacement about that same mean position. In standard crystallographic treatment both the isotropic and the anisotropic descriptions are Gaussian approximations to the true atomic displacement underlying the experimentally observed scattering. Under these conditions the agreement between the two models may be quantified using the symmetric form of the Kullback–Leibler divergence for the corresponding probability density functions (Kullback & Leibler, 1951 ▶). Because U and V are Gaussian distributions centered at the origin, the symmetric form of their Kullback–Leibler divergence may be expressed (Murshudov et al., 2011 ▶) as
 = 0 if the two models are identical; otherwise > 0. We will explore the hypothesis that, given a set of refined values for the anisotropic ADPs U
ij, the best predictor of the refined isotropic ADP B
iso is that value B
est which minimizes . In other words, we expect refinement of the isotropic model to converge to a state that minimizes disagreement with the anisotropic model.
= 0 if the two models are identical; otherwise > 0. We will explore the hypothesis that, given a set of refined values for the anisotropic ADPs U
ij, the best predictor of the refined isotropic ADP B
iso is that value B
est which minimizes . In other words, we expect refinement of the isotropic model to converge to a state that minimizes disagreement with the anisotropic model.
Since V is isotropic we do not care about the orientation of U and can therefore rotate it to yield the convenient form
where  ,
,  ,
,  are the eigenvalues of the original symmetric tensor. An equivalently convenient tensor form describing V in the same units as U is given by
where the scalar value  =
=  .
.
The minimum of is found by setting
 |
which yields
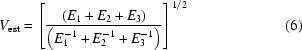 |
and thus the desired entity
 |
In the limiting case that U is isotropic, = = and  =
=  . In the general case, < . As U becomes increasingly anisotropic, the ratio of B
est to B
eq decreases (Fig. 1 ▶).
. In the general case, < . As U becomes increasingly anisotropic, the ratio of B
est to B
eq decreases (Fig. 1 ▶).
Figure 1.

The anisotropy and the ratio  depend on ratios of the three eigenvalues of the ADP tensor U. Anisotropy is defined as the ratio of the smallest eigenvalue to the largest eigenvalue. It is therefore not sensitive to the relative magnitude of the intermediate eigenvalue. The ratio , however, is sensitive to the relative magnitudes of all three eigenvalues. For an isotropic atom, = = and both anisotropy and equal 1 (far right of the plot).
3. Empirical comparison of anisotropic and isotropic refinement at atomic resolution
The atomic anisotropy  for an atom described by ADP tensor U is defined as the ratio of the minimum eigenvalue of U to the maximum eigenvalue of U. For an isotropic atom, = 1. The mean anisotropy of atoms in individual macromolecular crystal structures refined at atomic resolution lies broadly in the range 0.4–0.6, with atoms in the structure exhibiting a roughly Gaussian distribution about that mean (Zucker et al., 2010 ▶). Estimates for B
iso made using B
est rather than B
eq will therefore be significantly smaller for most atoms in such structures. As an empirical test of whether B
est is in fact a more accurate predictor, 15 high-resolution structures were selected as a test set (Table 1 ▶). These structures were chosen to span a range of mean anisotropy from 0.353 to 0.592. Thirteen of the structures were originally refined using SHELXL97 (Sheldrick & Schneider, 1997 ▶), two (3cnj, 3lvc) were refined using phenix.refine (Adams et al., 2010 ▶).
for an atom described by ADP tensor U is defined as the ratio of the minimum eigenvalue of U to the maximum eigenvalue of U. For an isotropic atom, = 1. The mean anisotropy of atoms in individual macromolecular crystal structures refined at atomic resolution lies broadly in the range 0.4–0.6, with atoms in the structure exhibiting a roughly Gaussian distribution about that mean (Zucker et al., 2010 ▶). Estimates for B
iso made using B
est rather than B
eq will therefore be significantly smaller for most atoms in such structures. As an empirical test of whether B
est is in fact a more accurate predictor, 15 high-resolution structures were selected as a test set (Table 1 ▶). These structures were chosen to span a range of mean anisotropy from 0.353 to 0.592. Thirteen of the structures were originally refined using SHELXL97 (Sheldrick & Schneider, 1997 ▶), two (3cnj, 3lvc) were refined using phenix.refine (Adams et al., 2010 ▶).
Table 1. The 15 high-resolution macromolecular structures used to verify empirically the quality of B est as a predictor for B iso .
The value shown for  is the working
  factor for the anisotropic refinement as reported in the corresponding PDB file. The value shown for
  is the working factor for an isotropic model after 15 cycles of refinement in REFMAC. The mean anisotropy and mean B
iso were calculated over all non-water atoms in the structure. The U
ij terms given in ANISOU records of the PDB file were used to calculate B
eq and B
est for each atom. The mean error for each predictor over all non-water atoms is shown in the final two columns.
is the working factor for an isotropic model after 15 cycles of refinement in REFMAC. The mean anisotropy and mean B
iso were calculated over all non-water atoms in the structure. The U
ij terms given in ANISOU records of the PDB file were used to calculate B
eq and B
est for each atom. The mean error for each predictor over all non-water atoms is shown in the final two columns.
| Protein | PDB | Resolution (Å) | |
|
Mean
|
Mean Biso |  |
 |
|
|---|---|---|---|---|---|---|---|---|---|
| Hydrophobin HFBII | 2b97 | 0.75 | 0.130 | 0.180 | 0.437 | 8.7 | 0.070 | 0.063 | |
| Cyclophilin G:cyclosporin A | 2wfj | 0.75 | 0.111 | 0.160 | 0.592 | 8.8 | 0.110 | 0.073 | |
| Triose phosphate isomerase | 1n55 | 0.83 | 0.095 | 0.158 | 0.530 | 8.7 | 0.135 | 0.084 | |
| Trypsin | 1xvo | 0.84 | 0.108 | 0.151 | 0.549 | 4.6 | 0.392 | 0.333 | |
| Cholesterol oxidase | 3cnj | 0.95 | 0.140 | 0.169 | 0.484 | 11.5 | 0.205 | 0.143 | |
| Calmodulin | 1exr | 1.00 | 0.134 | 0.198 | 0.353 | 14.7 | 0.146 | 0.073 | |
| Aldose reductase | 1t41 | 1.00 | 0.108 | 0.159 | 0.353 | 11.4 | 0.173 | 0.088 | |
| HIV protease | 3djk | 1.00 | 0.147 | 0.194 | 0.381 | 12.0 | 0.185 | 0.093 | |
| 23s rRNA domain (RNA) | 3dvz | 1.00 | 0.149 | 0.187 | 0.443 | 12.2 | 0.089 | 0.052 | |
| Photoactive yellow protein | 1ot9 | 1.00 | 0.134 | 0.174 | 0.456 | 11.2 | 0.103 | 0.057 | |
| Dehalogenase | 2rb5 | 1.03 | 0.110 | 0.173 | 0.433 | 11.9 | 0.211 | 0.131 | |
| Parvalbumin | 1rwy | 1.05 | 0.133 | 0.178 | 0.447 | 10.5 | 0.095 | 0.054 | |
| T4 lysozyme | 1sx7 | 1.06 | 0.112 | 0.179 | 0.414 | 12.5 | 0.138 | 0.070 | |
| DDAH | 2ci1 | 1.08 | 0.112 | 0.169 | 0.401 | 10.9 | 0.230 | 0.134 | |
| Green fluorescent protein | 3lvc | 1.14 | 0.139 | 0.164 | 0.510 | 12.7 | 0.198 | 0.147 | |
Coordinates and observed structure factors for each structure in the test set were obtained from the Protein Data Bank. Structure factors were converted from intensities to amplitudes if necessary. Each structure was then subjected to 15 cycles of isotropic refinement using REFMAC version 5.6.0095, starting from the original positional coordinates and the isotropic B factor ( as given in the ATOM records of the corresponding PDB file. To minimize shifts in the positional coordinates during refinement, interatomic distances were strongly restrained to their initial values via the command ‘RIDG DIST SIGM 0.00001’. H atoms were added in riding positions. All other refinement parameters were left at default values.
A modified version of the program coruij (Merritt, 1999a ▶) was used to compare the ATOM and ANISOU records from the original anisotropic model with the ATOM records in the refined isotropic model. The program verifies that the positional shifts are negligible and outputs the original ADP eigenvalues, anisotropy, B eq, B est and B iso for each atom. Analysis showed that B est calculated from the original anisotropic ADPs was a better predictor than B eq in estimating the refined value B iso, particularly for atoms with strong anisotropy (Fig. 2 ▶).
Figure 2.

(a) Fractional error in predicting the B iso obtained from 1.00 Å isotropic refinement of calmodulin (PDB entry 1exr) using the orthogonalized U ij terms from the original anisotropic refinement. Atoms were sorted by anisotropy; each line represents the mean fractional error for atoms in bins of width 0.01 on anisotropy. (b) The difference in fractional error for B eq and B est as a function of anisotropy. The fractional error in predicting B iso was calculated for each atom for both predictors. For example, if B eq for a given atom overpredicts B iso by a factor of 1.5, while B est for that same atom overpredicts by a factor of 1.1, then the improvement in fractional error is 0.40. Each line in the plot shows the mean improvement in the fractional error within a single structure for atoms in bins of width 0.01 on anisotropy.
For some of the structures both B eq and B est are systematically higher than B iso for atoms that are almost isotropic. This effect is visible in the sample plot shown in Fig. 2(a) ▶. The bias may be due to the specific choice of ADP restraint weights used either in the original SHELXL anisotropic refinement or in the isotropic REFMAC refinement. However, since B eq and B est converge as the anisotropy goes to 1, this effect has little impact on the relative accuracy of the two predictors. B est is more accurate overall (Table 1 ▶). For one structure (2b97, bottom curve in Fig. 2b ▶), B est is a poorer predictor of B iso for atoms with anisotropy near 0.5; but, even for this structure, B est is more accurate overall (Table 1 ▶).
4. Application of B est to the identification of TLS groups based on analysis of an isotropic model
TLS analysis was originally introduced to examine an experimentally determined set of anisotropic ADPs for evidence of chemical moieties undergoing approximately rigid-body displacement. The method has been adapted to generate models for macromolecular refinement. In this context the refined ADPs that constitute the starting point for TLS analysis are usually isotropic. The isotropic form of the TLSMD method introduced by Painter & Merritt (2006 ▶) finds an optimal N-group segmentation of a polymer chain by jointly varying the assignment of atoms to groups and the assignment of values to each group’s TLS parameters so as to minimize the residual,
Here, B
iso for each atom is the refined isotropic ADP provided as input, and B
TLS for that atom is the predicted isotropic displacement derived from the TLS parameters being refined for the group it belongs to. The formula used to calculate B
TLS up to now has been  =
=  ; i.e. it is the B
eq of the anisotropic ADP
; i.e. it is the B
eq of the anisotropic ADP  for that atom. In this formulation only ten independent TLS parameters, rather than the full set of 20, contribute to the diagonal elements
  needed to calculate B
TLS (Sternberg et al., 1979 ▶). The partial derivatives of the residual R
TLS with respect to these ten parameters are linear. Optimization is thus computationally simple, but yields only a degenerate TLS description. The remaining parameters are not determined until the TLS model is later subjected to full crystallographic refinement.
needed to calculate B
TLS (Sternberg et al., 1979 ▶). The partial derivatives of the residual R
TLS with respect to these ten parameters are linear. Optimization is thus computationally simple, but yields only a degenerate TLS description. The remaining parameters are not determined until the TLS model is later subjected to full crystallographic refinement.
It is reasonable to expect that use of a modified B
TLS based on B
est rather than B
eq will yield lower residuals and a different minimum for the corresponding TLS parameter values. Furthermore, if B
TLS is reformulated as B
est then it becomes sensitive to ratios of the eigenvalues of . This means that in principle additional TLS terms will contribute to the residual R
TLS. Thus reformulation will generate more complete TLS models owing to reduced degeneracy, at the cost of additional computational complexity arising from introduction of non-linear terms into the minimization. It is plausible, though not certain, that optimization using such a modified residual based on B
est will consequently lead in some cases to different segmentation of the model into groups. The practical effect of this reformulation remains to be explored, as it will require substantial re-working of the TLSMD minimization code.
5. Concluding remarks
Because B
eq is both well defined and easily calculated, it has been used since its introduction by W. C. Hamilton in 1959 ▶ as a convenient scalar approximation to a full anisotropic description of atomic displacement. But B
eq is not necessarily the best value to use in all contexts where a scalar value is needed. The current paper introduces B
est as an improved estimator for the experimentally obtained isotropic  value given an initial anisotropic model for the true electron density. It seems likely that all TLS analyses of isotropic models, including the use of TLSMD to create segmented models of macromolecular structures, would benefit from its adoption. Finally, the demonstration that B
eq is an overestimate for B
iso provides an explanation for anecdotal reports that TLS refinement results in higher B factors.
value given an initial anisotropic model for the true electron density. It seems likely that all TLS analyses of isotropic models, including the use of TLSMD to create segmented models of macromolecular structures, would benefit from its adoption. Finally, the demonstration that B
eq is an overestimate for B
iso provides an explanation for anecdotal reports that TLS refinement results in higher B factors.
Acknowledgments
This work was supported by NIH award R01GM080232. Source code for version 1.1 of the coruij program can be downloaded from http://www.bmsc.washington.edu/parvati/.
References
- Adams, P. D., Afonine, P. V., Bunkóczi, G., Chen, V. B., Davis, I. W., Echols, N., Headd, J. J., Hung, L.-W., Kapral, G. J., Grosse-Kunstleve, R. W., McCoy, A. J., Moriarty, N. W., Oeffner, R., Read, R. J., Richardson, D. C., Richardson, J. S., Terwilliger, T. C. & Zwart, P. H. (2010). Acta Cryst. D66, 213–221. [DOI] [PMC free article] [PubMed]
- Berman, H., Henrick, K., Nakamura, H. & Markley, J. L. (2007). Nucleic Acids Res. 35, D301–D303. [DOI] [PMC free article] [PubMed]
- Burnett, M. N. & Johnson, C. K. (1996). ORTEP-III: Oak Ridge Thermal Ellipsoid Plot Program for Crystal Structure Illustrations. Report ORNL-6895. Oak Ridge National Laboratory, TN, USA.
- Chen, X., Poon, B. K., Dousis, A., Wang, Q. & Ma, J. (2007). Structure, 15, 955–962. [DOI] [PMC free article] [PubMed]
- Hamilton, W. C. (1959). Acta Cryst. 12, 609–610.
- Hinsen, K. (2008). Bioinformatics, 24, 521–528. [DOI] [PubMed]
- Howlin, B., Moss, D. S. & Harris, G. W. (1989). Acta Cryst. A45, 851–861. [DOI] [PubMed]
- IUCr Commission on Journals (1986). Acta Cryst. C42, 1100.
- Kullback, S. & Leibler, R. A. (1951). Ann. Math. Stat. 22, 79–86 (http://projecteuclid.org/euclid.aoms/1177729694).
- Merritt, E. A. (1999a). Acta Cryst. D55, 1997–2004. [DOI] [PubMed]
- Merritt, E. A. (1999b). Acta Cryst. D55, 1109–1117. [DOI] [PubMed]
- Merritt, E. A. (2011). Acta Cryst. D. In the press.
- Murshudov, G. N., Skubák, P., Lebedev, A. A., Pannu, N. S., Steiner, R. A., Nicholls, R. A., Winn, M. D., Long, F. & Vagin, A. A. (2011). Acta Cryst. D67, 355–367. [DOI] [PMC free article] [PubMed]
- Painter, J. & Merritt, E. A. (2006). Acta Cryst. D62, 439–450. [DOI] [PubMed]
- Poon, B. K., Chen, X., Lu, M., Vyas, N. K., Quiocho, F. A., Wang, Q. & Ma, J. (2007). Proc. Natl Acad. Sci. USA, 104, 7869–7874. [DOI] [PMC free article] [PubMed]
- Schneider, T. R. (1996). In Proceeding of the CCP4 Study Weekend, edited by E. Dodson, M. Moore, A. Ralph and S. Bailey, pp. 133–144. Warrington: Daresbury Laboratory.
- Sheldrick, G. M. & Schneider, T. R. (1997). Methods Enzymol. 277, 319–343. [PubMed]
- Sternberg, M. J., Grace, D. E. & Phillips, D. C. (1979). J. Mol. Biol. 130, 231–252. [DOI] [PubMed]
- Trueblood, K. N. (1978). Acta Cryst. A34, 950–954.
- Trueblood, K. N., Bürgi, H.-B., Burzlaff, H., Dunitz, J. D., Gramaccioli, C. M., Schulz, H. H., Shmueli, U. & Abrahams, S. C. (1996). Acta Cryst. A52, 770–781.
- Winn, M. D., Isupov, M. N. & Murshudov, G. N. (2001). Acta Cryst. D57, 122–133. [DOI] [PubMed]
- Zucker, F., Champ, P. C. & Merritt, E. A. (2010). Acta Cryst. D66, 889–900. [DOI] [PMC free article] [PubMed]