Abstract
Background
Provincial governments require timely, economical methods to monitor surgical waiting periods. Although use of prospective procedure-specific registers would be the ideal method, a less elaborate system has been proposed that is based on physician billing data. This study assessed the validity of using the date of the last service billed prior to surgery as a proxy for the beginning of the post-referral, pre-surgical waiting period.
Method
We examined charts for 31 824 elective surgical encounters between 1992 and 1996 at an Ontario teaching hospital. The date of the last service before surgery (the last billing date) was compared with the date of the consultant's letter indicating a decision to book surgery (i.e., to begin waiting).
Results
Several surgical specialties (but excluding cardiac, orthopedic and gynecologic) had a close correlation between the dates of the last pre-surgery visit and those of the actual decision to place the patient on the waiting list. Similar results were found for 12 of 15 individually studied procedures, including some orthopedic and gynecological procedures.
Conclusion
Used judiciously, billing data is a timely, inexpensive and generally accurate method by which provincial governments could monitor trends in waiting times for appropriately selected surgical procedures.
Abstract
Contexte
Les gouvernements provinciaux ont besoin de moyens pratiques et économiques pour surveiller les périodes d'attente en chirurgie. Même si des registres prospectifs particuliers à une intervention constitueraient la méthode idéale, on a proposé un système moins complexe fondé sur les données de facturation des médecins. Au cours de cette étude, les chercheurs ont évalué la validité de l'utilisation du dernier acte facturé avant l'intervention chirurgicale pour représenter le début de la période d'attente après la référence et avant l'intervention.
Méthode
Nous avons étudié les dossiers de 31 824 consultations pour chirurgie élective entre 1992 et 1996 à un hôpital universitaire de l'Ontario. On a comparé la date du dernier acte avant l'intervention chirurgicale (la dernière date de facturation) à celle de la lettre du médecin-conseil indiquant que l'on avait décidé de réserver une intervention chirurgicale (c.-à-d. de commencer à attendre).
Résultats
Dans plusieurs spécialités en chirurgie (sauf toutefois la cardiologie, l'orthopédie et la gynécologie), on a établi un lien direct entre la dernière consultation avant l'intervention chirurgicale et la décision d'inscrire le patient sur la liste d'attente. L'étude individuelle de 12 interventions sur 15, y compris certaines interventions en orthopédie et en gynécologie, a produit des résultats semblables.
Conclusion
Utilisées judicieusement, les données de facturation constituent un moyen pratique, peu coûteux et généralement précis qui permettrait aux gouvernements provinciaux de suivre les tendances des temps d'attente pour certaines interventions chirurgicales soigneusement sélectionnées.
In the late 1990s, the public1 and many health care providers2,3 believed that patients were experiencing increasing waiting periods or “waits” for medical services, despite published evidence suggesting otherwise.4,5,6,7 Not until a Manitoba study in 2000 was there clear evidence in any province that waits for some common procedures had begun to increase.8 While considerable effort has been invested by the Western Canada Wait List Project (www.wcwl.org) in creating prioritizing tools and benchmarks, provinces lack up-to-date data, with the exceptions of a British Columbia website (www.hlth.gov.bc.ca/waitlist) and a few specialized registers such as the Cardiac Care Network (www.ccn.on.ca) and the Joint Replacement Registry in Ontario (http://ojrr.ca/ojrr/public/default.asp). This deficit has been reflected in the provinces' collective inability to report in detail on waiting times, as envisaged by the First Ministers' agreement in 2000.9
In our study we used a chart audit to determine the suitability of billing dates for monitoring provincial trends in surgical waiting periods.
Background
In 1996 the Nova Scotia Department of Health initiated the use of physicians' billing data to estimate surgical waiting times.4 This methodology assumes the last visit billed to the provincial insurance plan before surgery is the date when the decision to operate was made; that is, it marks the beginning of the wait for surgery. The billing date for the surgical procedure itself is deemed an accurate end to the waiting period. In Nova Scotia this approach worked well, since more than 75% of surgical patients had only 1 visit to their surgeon prior to surgery, and few had more than 2 visits. Nonetheless, the method is not applied to cardiac surgery because of its contrasting process of patient prioritization, and has been reported4 to work poorly for orthopedic surgery.
Administrative data collected by all provincial health-insurance plans includes the dates of the last visit before surgery and the surgical procedure. (Such service dates are unrelated to the date on which the billing claim is actually submitted.) For the elapsed time between the 2 service dates to reflect the postconsultation waiting period accurately, the date of the last outpatient visit must coincide with the date of the decision to place the patient on a waiting list for surgery. Since this can not be determined from current administrative data, chart audits would be needed to determine if the last visit and the decision to place the patient in a queue coincide.
Whereas this approach has been used in 2 Manitoban studies6,7 and 1 in Ontario of angiography waits,8 it is possible that the process may not accurately capture practice patterns outside Nova Scotia. For example, in areas with a higher concentration of surgeons there may be competition for patients, leading to more pre-surgical visits per patient. Similarly, in regions experiencing considerable hospital restructuring, diminished access to beds might force surgeons to manage patients for longer periods as outpatients. Finally, differing modes of surgeon remuneration might create different incentives for surgical disease management. Such possibilities call for validation of the the Nova Scotia method in another jurisdiction.
The purpose of this study was to determine if there is a statistically significant difference between the date of last outpatient visit before surgery and the date cited in the consultant's letter to the referring physician of the decision to operate.
Method
Setting
Kingston General Hospital (KGH) is 1 of 2 general hospitals in the South Eastern Ontario Academic Medical Organization.
Data collection
According to operating-room records 31 824 elective surgeries took place at KGH in the 4-year period beginning July 1, 1992. The chart data abstracted included the date the patient was placed on a waiting list, as recorded in a consultant's letter to the referring physician; the date of the patient's last visit to the surgeon before the procedure; the date the procedure took place; and the type of surgery done.
Analysis
The principal analyses undertaken were based upon a series of analyses of variance (ANOVAs) using a completely random design. In each instance, 95% confidence limits were determined. We considered a simplified queuing model for elective surgery, with three assumptions about the various components of the system: arrivals are independent random events and follow a Poisson distribution; queue discipline is “first in, first out” (that is, once assigned a place in the queue, patients proceed in that order unless their clinical status changes); and the system (comprising the hospital, operating-room staff and surgeon) varies in the time taken to complete different services.
Under these assumptions, the distribution of waiting times in the queue will assume a Gamma distribution. This family of distributions is governed by 2 parameters describing the shape (c) and the scale (b).10 When the shape parameter c ≤ 1, the distribution describes an exponential curve; when c = 2, a χ2 distribution; and as c becomes large, a normal distribution.
In practice, most surgical waiting time queues have shape parameters 1 < c < 2 and approximate an exponential or log-normal curve.11 This allows normalization of these data through loge transformations of the waiting time data by taking [ln(wait + 1)]. Such transformation is necessary before using ANOVA or other statistical techniques that assume that data follow a normal distribution. After ANOVA, the means calculated using the log-transformed data can subsequently be inverse-transformed by exponentiation back to the original scale using exp[Σln(wait + 1)/n] – 1.
The resulting mean is not an arithmetic mean, as would be obtained by averaging the untransformed data, but rather a geometric mean of the original series of data.12 When the distribution of the log-transformed data is fairly normal in shape, the inverse-transformed (geometric) mean will approximate the median of the untransformed original data.13 As used hereafter in this article, “mean” refers to the geometric mean calculated with this method.
The study question of date of decision versus date of last appointment was approached in 2 ways: by grouping patient encounters by surgical specialty, and then by analyzing 15 individual procedures chosen from those listed in the Nova Scotia report.4 Statistical significance was fixed at p < 0.05 (1-tailed test).
Results
General comparison
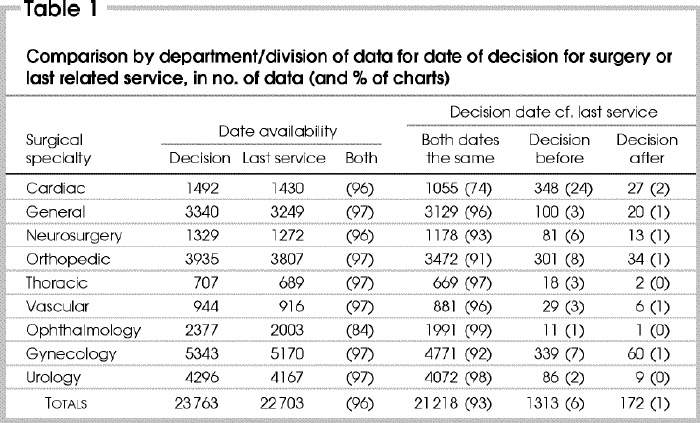
In 23 763 of the 31 824 charts audited (75%), the date of decision to undergo surgery was identified; and in 96% of those (in 22 703 charts), the date of the patient's last appointment prior to that surgery could also be determined. In ophthalmology, both dates were found for only 84%.
In the vast majority of cases (93%), the last-appointment date matched the date on which the decision to operate was made. In 6% of the cases, the decision was made before the last-appointment date; in 1%, the decision came afterwards (Table 1).
Table 1

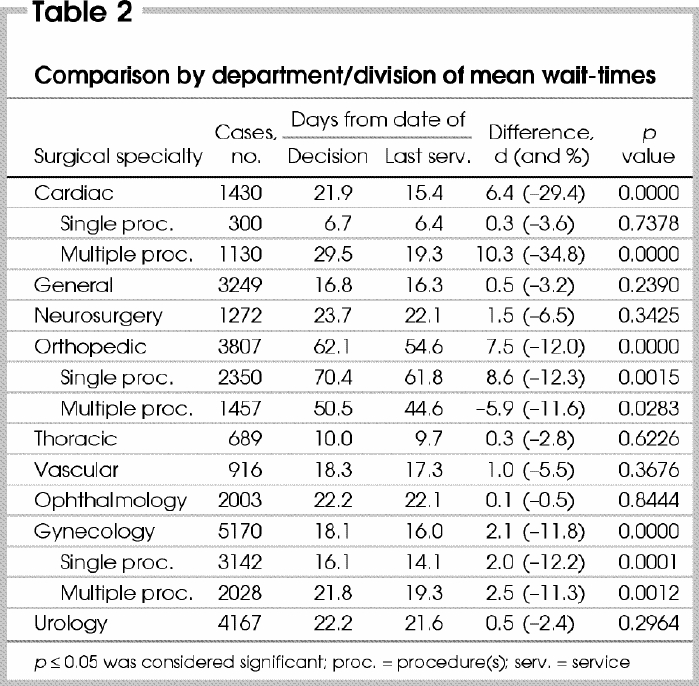
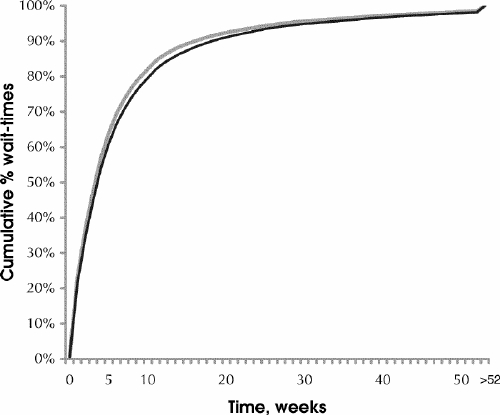
ANOVA of the log-transformed data compared mean values grouped by surgical specialty (Table 2). Overall, use of the last service date as a proxy for the date of the decision to undergo surgery according to the consultant's letter produced a mild but statistically insignificant underestimate of the actual waiting-time (Fig. 1). This was also generally the case when data were aggregated by specialty. For cardiac, orthopedic and gynecological surgery, however, the variances in wait times were sufficient to suggest that using the proxy measures would be inappropriate.
Table 2


FIG. 1. Waiting times: cumulative percentage.
The process by which patients are assigned to a waiting list for cardiac surgery differs from other specialties. Other than in cases of pacemaker implantation or servicing, the date of a patient's last appointment with a cardiac surgeon does not produce a reliable estimate of the mean period spent by cardiac patients waiting for their surgery.
In both orthopedic and gynecological surgery, the differences between mean wait times measured using the decision date versus last appointment were statistically significant, not only for type of surgery but also for single- and multiple-procedure surgeries, analyzed separately.
Comparison by 15 common procedures
It was possible to gather sufficient data to permit comparisons for these 15 procedures: disc surgery/ laminectomy, hip arthroplasty, laparoscopy, hemorrhoidectomy, cholecysectomy, hernia / hydrocele repair, cystoscopy, cataract extraction, hysterectomy, dilation and curettage, vaginal repair, prostatectomy, excisional breast biopsy, lumpectomy– mastectomy and radical mastectomy.
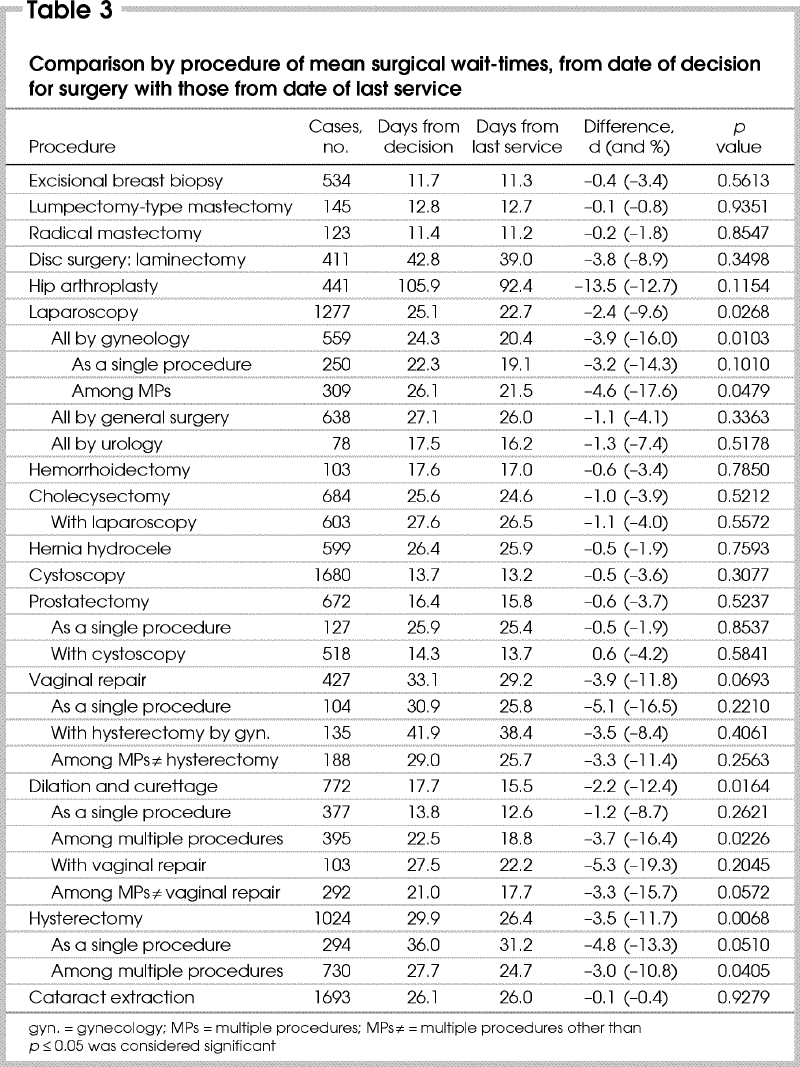
ANOVA of wait-time comparisons of recorded decision date versus billing date of last service are presented in Table 3. Mean wait times derived from date of last service were all slightly less than the those derived from dates in consultants' letters. In general, however, the underestimations were not substantial. In 12 of the 15 procedures, the differences were not statistically significant. The 3 procedures for which differences attained statistical significance were laparoscopy, dilation and curettage, and hysterectomy.
Table 3

Laparoscopy
ANOVAs reveal a significant difference between the mean waits derived from the dates recorded in consultants' letters (25.1 d) and those derived from last service dates (22.7 d, p = 0.0268). However, when the data were analyzed in subsets defined by the department or division of the specialist, the results varied.
Wait-time differences were not significant between the 2 methods for laparoscopies performed by urologists (17.5 v. 16.2 d, p = 0.5178) or general surgeons (27.1 v. 26.0 d, p = 0.5572). For gynecological laparoscopy data overall a significant difference in mean wait measures was identified (24.3 v. 20.4 d, p = 0.0103). However, when divided into single versus multiple-procedure surgeries, it was determined that there was no statistical difference in the measure of mean waits for the single-procedure surgeries (22.3 v. 19.1 d, p = 0.1010).
Dilation and curettage
ANOVAs reveal that, in general, the last date of service prior to surgery should not be used as a proxy for measuring the mean waiting period for a dilation and curettage (DC) procedure (17.7 v. 15.5 d, p = 0.0164). This is certainly the case if the DC is part of a complex surgery (22.5 v. 18.8 d, p = 0.0226). However, if the DC is the only procedure undertaken, the mean wait measured from the date of the last appointment with the surgeon was seen to be a reasonable proxy measure (13.8 v. 12.6 d, p = 0.2621).
Hysterectomy and vaginal repair
There was a statistically significant difference between the measures of mean wait for hysterectomies (29.9 v. 26.4 d, p = 0.0068). In the 29% of these surgeries listed as a single procedure, there was no difference (36.0 v. 31.2 d, p = 0.0510). However, 71% of hysterectomies were undertaken as part of multiple-procedure surgeries for which the last service prior to surgery was not a reliable point from which to measure of the mean for the operation (27.7 v. 24.7 d, p = 0.0405).
Overall, the period from date of last appointment proved to be a reasonable proxy measure of waiting-times for vaginal repair (33.1 v. 29.2 d, p = 0.0693). If the vaginal repair procedure was performed as part of a multiple-procedure surgery, other than with a hysterectomy, there was virtually no difference in mean wait times (29.0 v. 25.7 d, p = 0.2563) when compared to those performed as a single procedure (30.9 v. 25.8 d, p = 0.2210). If a hysterectomy was included as part of the surgery (n = 135 of 427), a substantially greater average wait could be expected (41.9 v. 38.4 d, p = 0.4061).
Prostatectomy and cystoscopy
For cystoscopy, analysis confirmed there was no statistically significant difference in the 2 methods of measuring mean waiting-times (13.7 v. 13.2 d, p = 0.3077). However, with approximately 31% of the cystoscopies for which there were data (n = 518/1680), a prostatectomy was also listed as part of the surgery. Since this figure also amounts to about 77% of all prostatectomies performed (n = 518/672), this concurrence indicated a closer examination of the data might be warranted. Whereas the mean wait for a prostatectomy as a single procedure (25.9 v. 25.4 d, p = 0.2210) varied considerably from those listed along with cystoscopies (14.3 v. 13.7 d, p = 0.5841), in each instance ANOVAs confirmed that the period from the date of the patient's last service prior to surgery and the date of the operation itself was a reasonable estimation of the mean (average) amount of time spent on the list awaiting this type of surgery.
Discussion
The Nova Scotia method of using billing data to estimate surgical waits was based on the untested assumption that a patient's last service with a surgeon prior to surgery was a legitimate point at which to begin measuring the period spent awaiting a procedure. The present study confirmed that, when the work of 6 of 9 surgical specialties is taken as a whole, there is a reliable correspondence between the date of the decision to queue and the date of the patient's last visit prior to surgery. The exceptions were cardiac, orthopedic and gynecological surgery. Similarly, for 12 of 15 common surgical procedures, including some from orthopedics and gynecology, there was no statistically significant difference between the two dates. However, for laparoscopy, dilation and curettage, and hysterectomy, it was determined that the date of the last appointment generally was not a reasonable substitute for the actual decision date.
This study has important limitations. The waiting period measured here, from the last pre-operative visit to surgical procedure, constitutes only one phase in a patient's wait for service. However, while the method can not be used to capture the clinical implications of waiting for individual patients, we have shown that it can be reliably used at a system level to describe procedure-specific waiting trends over time, particularly for specialties in which registry data is unlikely to be available.
The use of retrospective data from administrative sources will fail to capture the experience of patients who spent time waiting for service but either dropped off the waiting list or still continue to await service. Registries, which allow more accurate prospective monitoring of waiting times14 are clearly preferable for tracking costly high-demand services where waiting may have significant clinical implications.
A large sample size may yield many statistically significant relationships; however, if the procedures under study are all elective, such results may have very minor clinical importance. In the case of gynecological procedures, statistical significance was found for differences as small as 2 days in a 2–3-week waiting period; however, whether such differences are clinically important for elective gynecologic procedures is doubtful. Similarly, a statistically significant 7.5-day difference in a 7–8-week waiting period for elective orthopaedic surgery is unlikely to be clinically significant. However, the same reasoning may not be justified for statistically significant differences found in cardiac surgery.
We conclude the use of billing data is a timely, economical means to follow trends in waiting times for appropriately selected surgeries and specialties. Using such a methodology, provinces would gain a capacity they currently lack:15 the capability to monitor waiting times in compliance with recent health system report-card obligations.9 It would also permit governments to make institutional, regional and interprovincial comparisons, as well as to track targeted areas such as oncology surgery.
Acknowledgments
Funding for this research was provided by the Physicians' Services Incorporated Foundation.
Research supported by a grant from Physicians' Services Incorporated Foundation
Competing interests: None declared.
Correspondence to: Dr. Samuel E. D. Shortt, Centre for Health Services and Policy Research, Abramsky Hall 3rd floor, Queen's University, Kingston ON K7L 3N6; fax 613 533-6353; seds@post.queensu.ca
Accepted for publication July 17, 2003
References
- 1.Canadian Medical Association. Canadians say health care worse today than a year ago [news release]. 1997 Apr 29.
- 2.Ontario College of Family Physicians. CFPC headlines. Chapter 1998;10:2. Toronto: the College; 1998.
- 3.Ramsay C, Walker M. Waiting your turn: hospital waiting lists in Canada. 8th ed. Vancouver: Fraser Institute Critical Issues Bulletin; 1998.
- 4.Nova Scotia Department of Health. Reporting health performance, elective procedure waiting times in Nova Scotia, 1992-1996. Halifax: the Department; 1996. p. 1-64.
- 5.British Columbia Ministry of Health and Ministry Responsible for Seniors. Waiting list report. Victoria: the Ministry; 1997. p. 1-23.
- 6.DeCoster C, Carriere K, Peterson S, Walld R, MacWilliams L. Surgical waiting times in Manitoba. Winnipeg: Manitoba Centre for Health Policy and Evaluation; 1998. p. 1-74.
- 7.DeCoster C, MacWilliam L, Walld R. Waiting times for surgery: 1997/98 and 1998/99 update. Winnipeg: Manitoba Centre for Health Policy and Evaluation, 2000.
- 8.Alter DA, Naylor CD, Austin P, Tu JV. Effects of socioeconomic status on access to invasive cardiac procedures and on mortality after acute myocardial infarction. N Engl J Med 1999;341:1359-67. [DOI] [PubMed]
- 9.Ontario Ministry of Health and Long-Term Care. Ontario's health system performance report:14 common indicator areas of health and health system performance. Toronto: the Ministry; 2002. Available: www.health.gov.on.ca/english/public/pub/ministry_reports/pirc/pirc_tech.pdf (accessed 2004 Feb 23).
- 10.Hastings NAJ, Peacock JB. Statistical distributions. New York: Halsted Press; 1975.
- 11.Elliott D. A technique to measure proxy waiting times for procedures: methodology, assessment of validity and initial applications [thesis]. Halifax NS: Dalhousie University; 1999.
- 12.Armitage P, Berry G. Statistical methods in medical research. 3rd ed. Oxford: Blackwell Science; 1994.
- 13.Fletcher RH, Fletcher SW, Wagner EH. Clinical epidemiology: the essentials. 3rd ed. New York: Lippincott Williams and Wilkins; 1996.
- 14.Sobolev B,Brown P, Zelt D, Shortt S. Bias inherent in retrospective waiting-time studies. CMAJ 2000;162:1821-2. [PMC free article] [PubMed]
- 15.McDonald P, Shortt S, Sanmartin C, Barer M, Lewis S, Sheps S. Waiting lists and waiting times for health care in Canada: more management!! more money?? Ottawa; Health Canada; 1998. p. 35-48.


