The crystal structure of the catalytic domain of ARF GTPase-activating protein (ARFGAP) of Plasmodium falciparum has been determined at 2.4 Å resolution and compared with the structures of mammalian ARFGAPs.
Keywords: GTPase-activating proteins, protein trafficking, Plasmodium falciparum
Abstract
The crystal structure of the catalytic domain of the ADP ribosylation factor GTPase-activating protein (ARFGAP) from Plasmodium falciparum has been determined and refined to 2.4 Å resolution. Multiwavength anomalous diffraction (MAD) data were collected utilizing the Zn2+ ion bound at the zinc-finger domain and were used to solve the structure. The overall structure of the domain is similar to those of mammalian ARFGAPs. However, several amino-acid residues in the area where GAP interacts with ARF1 differ in P. falciparum ARFGAP. Moreover, a number of residues that form the dimer interface in the crystal structure are unique in P. falciparum ARFGAP.
1. Introduction
In eukaryotic cells, proteins are trafficked between compartments in a vesicle-mediated manner (Bonifacino & Glick, 2004 ▶; Weimer et al., 2008 ▶). Proteins and lipids from each organelle are selectively packaged into vesicles that specifically recognize the acceptor compartment, fuse with it and deliver the cargo. Vesicles budding from the cis-Golgi compartment are coated with the COPI protein complex that depends on ADP ribosylation factors (ARFs), a family of small GTP-binding proteins within the Ras superfamily. The activity of ARFs is primarily controlled by two classes of proteins: guanine nucleotide-exchange factors (GEFs) and GTPase-activating proteins (GAPs). GDP-bound ARF interacts on the membrane surface with a GEF that catalyzes the release of GDP and the uptake of GTP. This transition induces conformational changes that allow ARF to interact with the lipid bilayer through its myristoylated amino-terminus. The membrane-bound ARF–GTP then triggers the recruitment of the coat-protein complex to the donor membrane. The assembly of coat subunits deforms the donor membrane and captures cargo molecules in the forming vesicle. A vesicle-associated GAP then stimulates the hydrolysis of GTP and triggers coat dissociation prior to vesicle fusion (Goldberg, 1999 ▶; Mandiyan et al., 1999 ▶). Since ARF in its GTP-bound form interacts with the majority of its effector molecules, by catalyzing the hydrolysis of GTP ARFGAP may play an important role in terminating effector interactions (Spang et al., 2010 ▶). Moreover, ARFGAPs play multiple roles in cellular signal transduction that may or may not involve ARF (Inoue & Randazzo, 2007 ▶). ARFGAPs constitute a large family of proteins that are distributed in many subfamilies; however, all ARFGAPs contain a characteristic zinc-finger motif (CX 2CX 16CX 2C) in the catalytic domain. They also contain additional domains that are likely to be involved in other functions.
Plasmodium falciparum is the most lethal strain of human malaria parasite. The complex life cycle of P. falciparum involves alternating between a vertebrate and an invertebrate host and the development of multiple specialized organelles. Extensive protein trafficking both in the parasite and out to the host cell surface are necessary for the survival and growth of the parasite, particularly during the intraerythrocytic stage that is responsible for the symptoms and pathological consequences of malaria. The significance of protein trafficking in P. falciparum has been discussed extensively (Haase & de Koning-Ward, 2010 ▶; Crabb et al., 2010 ▶; Trelka et al., 2000 ▶). Since under normal circumstances erythrocytes do not require protein trafficking, it is conceivable that a strategy for interrupting the protein-trafficking machinery within plasmodium-infected erythrocytes may be effective in arresting the life cycle of the parasite and thereby preventing disease progression.
To date, only one sequence each for ARF and ARFGAP have been identified in the plasmodium genome (PlasmoDB). Recently, we have described the crystal structure of P. falciparum ARF1 (PDB entry 3lrp; Cook et al., 2010 ▶). Here, we present the crystal structure of the catalytic domain of P. falciparum ARFGAP (PfARFGAP).
2. Materials and methods
2.1. Expression and purification
The expression and purification of the catalytic domain of PfARFGAP have been described in detail (Senkovich & Chattopadhyay, 2004 ▶). Sequencing of the recombinant plasmid revealed that the DNA encodes a phenylalanine residue at position 8, while the database sequence for PfARFGAP (GenBank accession No. AAN36512) has a leucine at this position. The recombinant protein contained residues 1–160 of the parasitic ARFGAP and a three-residue remnant of the vector-encoded N-terminal hexahistidine tag, which was removed by proteolysis with thrombin prior to crystallization.
2.2. Crystallization and data collection
Purified protein was concentrated to approximately 10 mg ml−1 in 10 mM HEPES buffer pH 7.0. Crystals were grown at 296 K by the hanging-drop method using 4 µl drops (2 µl protein solution and 2 µl reservoir solution) and 1 ml reservoir solution consisting of 1.4 M lithium sulfate in 0.1 M HEPES buffer pH 7.0. The crystal used for multi-wavelength anomalous diffraction (MAD) data collection was grown in the presence of 4 mM zinc chloride using the same crystallization condition, and the cryopreservative solution contained 4 mM zinc chloride in the reservoir solution in addition to 22% glycerol. A single crystal was used for the collection of MAD data at three wavelengths following the inverse-beam strategy. The data were collected on the SER-CAT beamline 22ID at the Advanced Photon Source synchrotron facility.
2.3. Structure determination and refinement
Attempts to solve the PfARFGAP structure by molecular replacement using the crystal structure of rat ARFGAP (Goldberg, 1999 ▶) as a search model were not successful. Therefore, the structure was solved using the MAD technique. The positions of the two Zn atoms (one for each molecule in the asymmetric unit) were determined from a MAD Fourier map and phases were calculated with SOLVE (Terwilliger & Berendzen, 1999 ▶). Prior to the calculation of electron-density maps, the phases were improved by solvent-flattening techniques using the DM program (Cowtan, 1994 ▶) from the CCP4 suite of programs (Winn et al., 2011 ▶). Using data to 3.4 Å resolution, eight of the 12 α-helices in the asymmetric unit were identified and these coordinates were used to calculate an initial noncrystallographic symmetry (NCS) matrix. Optimization of the NCS operators was performed using the IMP option of the RAVE program suite (Kleywegt & Jones, 1994 ▶). The model was fitted to the 3.4 Å resolution MAD Fourier map in the first few rounds and subsequent model building was performed using electron-density maps calculated with combined phases to 3.4 Å resolution and native data to 2.4 Å resolution (Read, 1986 ▶) using the computer programs CHAIN (Sack, 1988 ▶) and Coot (Emsley & Cowtan, 2004 ▶).
Refinement of the structure was performed by simulated annealing using CNS (Brünger et al., 1998 ▶) with the stereochemical parameter files defined by Engh & Huber (1991 ▶). No σ cutoff was applied to the data. 5% of the data were randomly selected and removed prior to refinement for analysis of the free R factor (Brünger, 1992 ▶). The two monomers were restrained by the noncrystallographic symmetry during most of the refinement. The restraints were gradually relaxed as refinement proceeded and were completely removed in the final stage of refinement. In the final stage of refinement we used the TLS and restrained refinement option in REFMAC5 (Murshudov et al., 2011 ▶). TLS parameters were generated using the TLS Motion Determination (TLSMD) server (http://skuld.bmsc.washington.edu/~tlsmd/; Painter & Merritt, 2006a ▶,b ▶).
Table 1 ▶ contains a summary of the data-collection and refinement statistics for PfARFGAP native data. Statistics of the MAD data sets for PfARFGAP are shown in Table 2 ▶. Atomic coordinates and structure factors have been deposited in the Protein Data Bank (http://www.rcsb.org) with PDB code 3sub.
Table 1. Data-collection and refinement statistics.
Values in parentheses are for the outermost resolution shell.
| Crystal data | |
| Space group | P3221 |
| Unit-cell parameters (Å) | a = 95.9, c = 92.8 |
| VM (Å3 Da−1) | 3.38 |
| Solvent content (%) | 64 |
| Data collection | |
| Resolution range (Å) | 24.81–2.40 (2.49–2.40) |
| No. of intensity measurements | 216328 |
| No. of unique reflections | 19608 |
| Multiplicity | 11.0 |
| Completeness (%) | 99.9 (100) |
| Rmerge† (%) | 0.05 (0.23) |
| Mean I/σ(I) | 8.8 |
| Refinement statistics | |
| Resolution range (Å) | 24.81–2.40 (2.46–2.40) |
| Reflections (working set) | 18635 (1320) |
| Reflections (test set) | 947 (58) |
| R value | 0.209 (0.248) |
| Free R value | 0.227 (0.302) |
| No. of protein atoms | 2164 |
| No. of Zn atoms | 2 |
| No. of water molecules | 123 |
| No. of sulfate ions | 6 |
| Estimated coordinate error based on R value‡ (Å) | 0.246 |
| Estimated coordinate error based on free R value (Å) | 0.190 |
| R.m.s. deviations from ideal values | |
| Bond lengths (Å) | 0.006 |
| Bond angles (°) | 0.900 |
| Average B factors (Å2) | |
| Overall | 37.7 |
| Protein | 37.5 |
| Zinc | 36.7 |
| Water | 38.8 |
| Structure quality | |
| Ramachandran favored (%) | 99.25 |
| Ramachandran outliers (%) | 0.00 |
| Rotamer outliers (%) | 0.42 |
R
merge = 
 , where 〈I(hkl)〉 is the mean intensity of the i reflections with intensities I
i(hkl).
Coordinate errors were estimated by the method of Cruickshank (1999 ▶).
Table 2. MAD data statistics.
Values in parentheses are for the highest resolution shell. Friedel mates are treated as different reflections. f′ and f′′ are the anomalous scattering factors.
| Peak | Edge | Remote | |
|---|---|---|---|
| Wavelength (Å) | 1.2828 | 1.2834 | 1.26966 |
| f/f′′ | −8.2/4.69 | −9.99/2.78 | 0.73/9.11 |
| Unit-cell parameters | |||
| a (Å) | 95.870 | 95.952 | 95.816 |
| c (Å) | 92.742 | 92.847 | 92.741 |
| Resolution range (Å) | 50.0–2.70 (2.80–2.70) | 50.0–2.70 (2.80–2.70) | 50–2.70 (2.80–2.70) |
| No. of intensity measurements | 304801 | 306032 | 306677 |
| No. of unique reflections | 13773 | 13832 | 13856 |
| Rmerge (%) | 0.10 (0.33) | 0.10 (0.34) | 0.10 (0.35) |
| Mean I/σ(I) | 7.3 | 7.1 | 7.1 |
| Completeness (%) | 99.2 (98.2) | 99.2 (98.4) | 99.2 (98.5) |
| Multiplicity | 22.1 | 22.1 | 22.1 |
3. Results and discussion
3.1. Quality of the structure
The overall quality of the PfARFGAP structure was excellent. The electron density for the entire model was excellent. Validation with MolProbity (Chen et al., 2010 ▶) produced a clash score of 3.76 (99th percentile for 331 structures in the resolution range 2.40 ± 0.25 Å) and an overall score of 1.16 (100th percentile for 8058 structures in the same resolution range). In the final model, >99% of the residues were in the favored areas of the Ramachandran plot. Table 1 ▶ presents a summary of the data-collection and refinement statistics for native data. Statistics for the MAD data sets used for structure determination are shown in Table 2 ▶.
3.2. General description of the PfARFGAP structure
The crystal structure of PfARFGAP contains two subunits (chains A and B) in the asymmetric unit which are related by a noncrystallographic twofold axis. The r.m.s.d. for alignment of equivalent Cα atoms in the two chains is 0.396 Å. The purified protein used for crystallization contained residues 1–160 of the PfARFGAP catalytic domain and three residues (GSH) that remained at the N-terminus after proteolytic cleavage of the hexahistidine tag. However, in the crystal structure only residues 1–136 and three residues (GSH) from the tag were visible in subunit A and only residues 5–135 could be modeled in subunit B. There are two sulfate ions (presumably from the crystallization reagents), one near the N-terminus and the other near Arg114 of subunit A. The amino-acid residue at position 8 was found to be Phe, although in the database it is reported as Leu. Electron density for this residue in subunit A was excellent and its identity was also verified by DNA sequencing of the recombinant plasmid used for protein preparation.
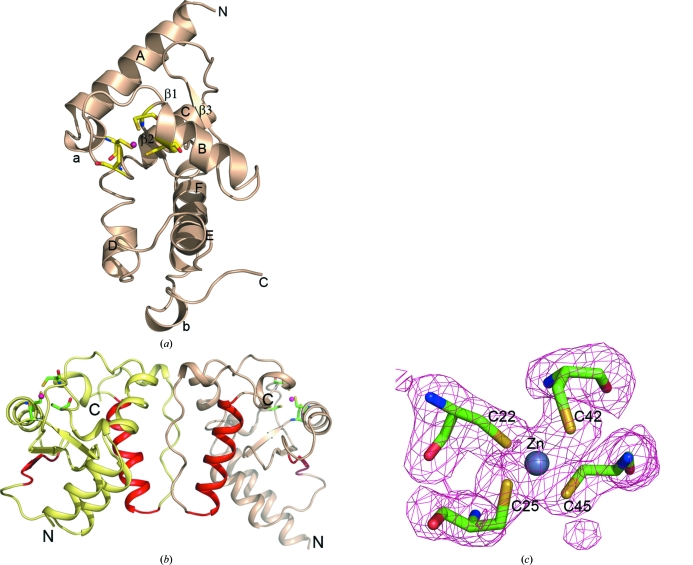
ARFGAP is an α/β protein. The catalytic domain of PfARFGAP contains six α-helices (A–F) and a short three-stranded antiparallel β-sheet (β1–β3). There are two short 310-helices (17–20 and 128–130; labeled a and b, respectively, in Fig. 1 ▶ a). Fig. 1 ▶(b) shows a drawing of the PfARFGAP dimer in the asymmetric unit.
Figure 1.
Structure of the catalytic domain of PfARFGAP. (a) Cartoon drawing of the structure of PfARFGAP. The four cysteine residues that form the zinc-binding site are shown as stick models. The Zn2+ ion is shown as a magenta sphere. The α-helices are labeled A–F and the β-strands are labeled β2 and β3; β1 remains at the back. The 310-helices are labeled a and b. (b) Cartoon drawing of the two molecules related by the noncrystallographic twofold axis in the asymmetric unit. The four cysteine residues that form the zinc-binding site in each molecule are shown as stick models. The Zn2+ ions are shown as magenta spheres. The residues involved in binding ARF, based on the ARF–ARFGAP structure (Goldberg, 1999 ▶), are shown in red. (c) Cysteine residues in the zinc-finger domain of molecule A with associated electron density. Figs. 1, 3, 4 and 5 were created with PyMOL (DeLano, 2002 ▶).
One Zn2+ ion in each molecule of the asymmetric unit was clearly identifiable in the native 2F o − F c electron-density maps and the refined positions correspond to the expected positions for Zn2+ ions in similar zinc-finger proteins. The Zn2+–Cys distances range from 2.23 to 2.41 Å for molecule A and 2.26 to 2.38 Å for molecule B. The Zn2+ ion and the coordinating cysteine residues are shown in Fig. 1 ▶(c).
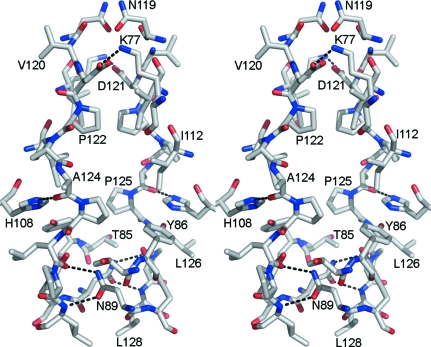
Interactions between the subunits in the asymmetric unit mainly involve the loop (119–127) that joins helix F and the C-terminal 310-helix (Figs. 1 ▶ a and 2 ▶). This loop consists predominantly of hydrophobic residues (Val120, Pro122, Pro123, Pro125, Leu126, Pro127 and Leu128). Interactions with residues from spatially adjacent areas of the same subunit also stabilize the conformation of the interface in each subunit. For example, His108 ND1 is within hydrogen-bonding distance of the main-chain O atom of Ala124 in the loop and His108 NE2 forms a hydrogen bond to the hydroxyl group of Tyr86 (Fig. 3 ▶). The imidazole ring of His108 is also involved in potential hydrophobic interactions with the side chain of Leu126. There are six hydrogen bonds between the two subunits. The terminal NH2 of the Lys77 side chain in each subunit forms a hydrogen bond to the carboxyl side chain of Asp121 of the other subunit. The side-chain amide group of Asn89 in each subunit is involved in two hydrogen-bonding interactions: the N atom bonds to the main-chain O atom of Leu126 of the other subunit and the O atom forms a hydrogen bond to the main-chain N atom of Leu128 of the other subunit. Interestingly, several of the amino-acid residues that form this interface are distinct in PfARFGAP when compared with mammalian and other eukaryotic ARFGAPs. Thus, this surface may represent a site for plasmodium-specific protein–protein interactions. It should be noted that the C-terminal amino-acid residues 136–160 are disordered in the present structure. The C-terminal ten residues of rat GAP in the ARF1–GAP complex were also disordered (Goldberg, 1999 ▶). Thus, interaction with additional GAP-binding proteins may be necessary for stabilization of this region.
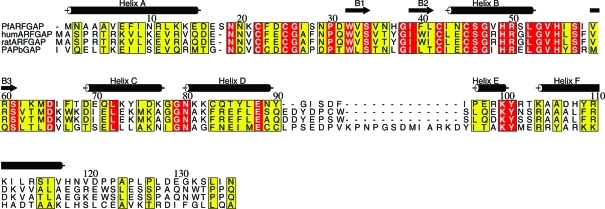
Figure 2.
Alignment of the primary sequence of residues 1–136 of PfARFGAP with the corresponding residues of rat and human ARFGAPs and mouse PAPβGAP. Sequences are taken from GenBank accession Nos. AAN36512 (PfARFGAP), AAH00786 (human), AAH70895 (rat) and Q7SIG6 (mouse). Residue 8 in the PfARFGAP structure was found to be phenylalanine but was reported as leucine in the database. The α-helices and β-strands in PfARFGAP are indicated. Note that two additional short β-strands are assigned in the rat ARFGAP structure (Goldberg, 1999 ▶) but are not seen in PfARFGAP. This figure was prepared using ALSCRIPT (Barton, 1993 ▶).
Figure 3.
Dimer interface. The stereo drawing illustrates interactions that stabilize the conformation of the interface between monomers in the asymmetric unit. Amino-acid residues are shown as stick models. Important hydrogen bonds are indicated by dashed lines. Several amino-acid residues at the interface are distinctive in the PfARFGAP sequence.
3.3. Comparison of PfARFGAP with other ARFGAP structures
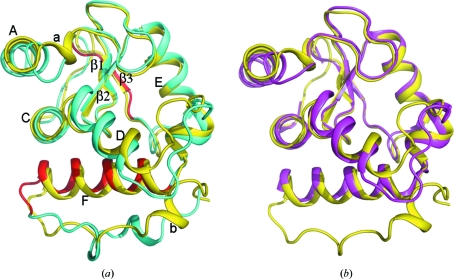
Fig. 2 ▶ shows a sequence alignment of the catalytic domain of PfARFGAP with those of human and rat ARFGAP (Goldberg, 1999 ▶) and with the GAP domain of PYK2-associated protein β (PAPβGAP; Mandiyan et al., 1999 ▶). The primary sequences of the catalytic domains of human and Plasmodium ARFGAP show 39% identity and 52% similarity; the same regions of rat and Plasmodium ARFGAP exhibit 39% identity and 52% similarity. The overall structure of the catalytic domain of PfARFGAP is very similar to those of human and rat ARFGAP (Fig. 4 ▶). The r.m.s.d. between the structures of PfARFGAP (chain A) and human ARFGAP is 1.22 Å for 114 Cα atoms; the r.m.s.d. between PfARFGAP (chain A) and the rat ARFGAP structure is 3.13 Å for 129 Cα atoms. The divergence in the C-terminal region (16 or 17 residues) of the latter structures contributes at least partly to the higher r.m.s.d. This area was not resolved in the human ARFGAP structure.
Figure 4.
Alignment of structures. (a) Structures of the catalytic domain of PfARFGAP (yellow) and rat ARFGAP (cyan) are superimposed. The ARF-binding region, based on the ARF–rat ARFGAP structure (Goldberg, 1999 ▶), is colored red. α-Helices and β-strands in PfARFGAP are labeled A–F and 1–3, respectively; 310-helices are labeled a and b. (b) Structures of the catalytic domain of PfARFGAP (yellow) and human ARFGAP (magenta) are superimposed in the same orientation as in (a). Note that the human ARFGAP structure (PDB entry 3dwd) only extends to residue 120.
There are other noticeable differences in the local structures of these proteins. These include the N-terminal segment containing helix A and the first 310-helix in PfARFGAP (helix a; Fig. 1 ▶ a). Moreover, the loop just prior to the first cysteine residue of the zinc-finger motif (Cys22) is one residue longer in PfARFGAP. When compared with human and rat ARFGAP, there is a slight movement of helix D and a significant divergence in the loop connecting helix D to helix E in PfARFGAP (Fig. 4 ▶). While the sequence of residues forming this loop is similar in human and rat ARFGAP, in PfARFGAP this loop is shorter and the amino-acid residues are quite different. When superimposed on the rat and human ARFGAP structures, helix F in PfARFGAP also shows some movement. Residues beyond this helix are absent in the human ARFGAP structure and the C-terminal regions beyond helix F diverge significantly in the PfARFGAP and rat ARFGAP structures. However, since helix F in rat ARFGAP is involved in interaction with the ARF molecule in the complex, the difference in this area of the molecule may be influenced by protein–protein interactions. As mentioned above, this portion of the PfARFGAP structure also participates in the formation of the dimeric interface (Fig. 3 ▶) and most of the amino-acid residues in this area are different in the PfARFGAP sequence.
The human ARFGAP structure also contains two molecules in the asymmetric unit, but in this case the subunits are joined by a disulfide bond between the Cys96 residues. There is no other intermolecular contact between the two molecules in the human ARFGAP dimer. The PAPβGAP domain crystallized as a monomer (PDB entry 1dcq; Mandiyan et al., 1999 ▶). The structure of the first 90 residues in the GAP domain of PAPβ (through the fourth helix) is quite similar to the structures of PfARFGAP and the mammalian ARFGAPs, but compared with PfARFGAP and the mammalian ARFGAPs the GAP domain of PAPβ has a 15-residue insertion after the fourth helix and after this point it bears no similarity to the other three structures.
3.4. ARFGAP binding to ARF1
Several structures of the complexes of GTP-binding proteins with their corresponding GTPases are known, including Ras–RasGAP (Scheffzek et al., 1997 ▶), Rho–RhoGAP (Rittinger et al., 1997 ▶) and the Sec23–Sar1 complex (Bi et al., 2002 ▶). However, to our knowledge only one complex of an ARF1 and an ARFGAP has been published (Goldberg, 1999 ▶). While GTPases possess similar tertiary structures, Sec23 and the three GAPs share no structural homology with each other. In the Ras–RasGAP, Rho–RhoGAP and Sec23–Sar1 complexes the interaction sites on the GTPase are essentially confined to the two switch regions. The protein–protein interactions with the corresponding GAPs stabilize these regions of the GTPase, which are poorly defined in the GTPase structures in the absence of GAP. Stabilization of the switch regions appears to be one of the two major factors that drive the activation of the GTPase reaction by GAPs. The other major factor is the donation of an ‘arginine finger’ to the nucleotide-binding site. These highly conserved arginine residues insert into the nucleotide-binding site close to the terminal phosphate of GTP. The conserved arginine residue in RasGAP and RhoGAP occurs in a loop, but the catalytic arginine in Sec23 occurs in a short α-helix.
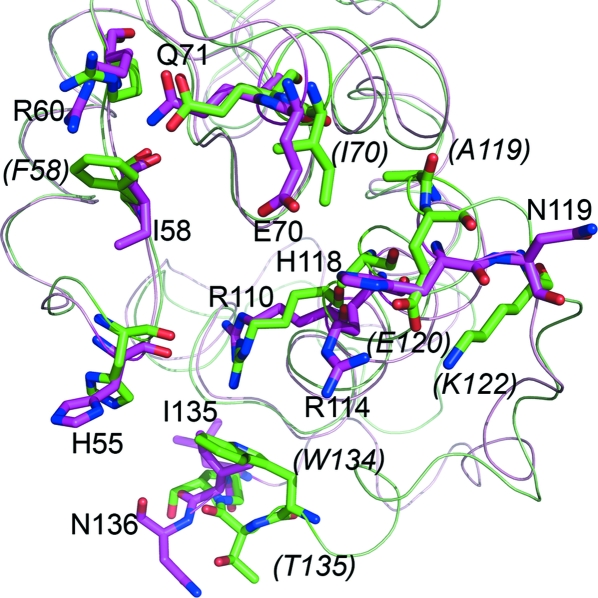
PfARFGAP, human ARFGAP, rat ARFGAP and PAPβGAP also contain a highly conserved arginine residue (corresponding to Arg50 in PfARFGAP) in the center of helix B. This arginine residue is located on the opposite side of the dimer interface, towards the ARF-binding face of ARFGAP. However, in the crystal structure of the ARF1–ARFGAP complex (Goldberg, 1999 ▶) residues that interact with ARF1 are located on β5 (corresponding to β3 in PfARFGAP) and helix F. As shown in Fig. 5 ▶, a number of PfARFGAP residues corresponding to ARF-binding residues in rat ARFGAP are identical, but several are different.
Figure 5.
Potential ARF-binding regions. Comparison of the residues involved in binding ARF, based on the ARF–ARFGAP structure (Goldberg, 1999 ▶). Crystal structures of PfARFGAP (light magenta) and rat ARFGAP (green) are superimposed. The residues in rat ARFGAP (green) that differ from the corresponding residues in PfARFGAP (magenta) are indicated in italics and in parentheses.
During the various stages of its complex life cycle, P. falciparum proteins are trafficked to multiple unusual organelles of the parasite and also to the host cell. It is remarkable that P. falciparum is able to accomplish elaborate trafficking despite its rudimentary Golgi apparatus, which most probably consists of a single cisterna. Homologs of the eukaryotic trafficking machinery have been identified in the Plasmodium genome. Some of the members of these pathways in P. falciparum display unusual features distinguishing these parasitic molecules from their eukaryotic homologs (Baumgartner et al., 2001 ▶). The identification of molecules that are involved in the secretory pathways of P. falciparum and their detailed structural and functional analysis will provide a better understanding of the unique properties of these molecules and may offer new targets for therapeutic intervention.
Supplementary Material
PDB reference: catalytic domain of ARFGAP, 3sub
Acknowledgments
We thank Dr Jonathan Goldberg of Memorial Sloan–Kettering Cancer Center for kindly providing the coordinates of the ARF1–ARFGAP complex. We thank the staff of the SER-CAT beamline at the Advanced Photon Source. Use of the Argonne National Laboratory SER-CAT beamline was supported by the US Department of Energy, Office of Energy Research under contract W-31-109-ENG-38.
References
- Barton, G. J. (1993). Protein Eng. 6, 37–40. [DOI] [PubMed]
- Baumgartner, F., Wiek, S., Paprotka, K., Zauner, S. & Lingelbach, K. (2001). Mol. Microbiol. 41, 1151–1158. [DOI] [PubMed]
- Bi, X., Corpina, R. A. & Goldberg, J. (2002). Nature (London), 419, 271–277. [DOI] [PubMed]
- Bonifacino, J. S. & Glick, B. S. (2004). Cell, 116, 153–166. [DOI] [PubMed]
- Brünger, A. T. (1992). Nature (London), 355, 472–475. [DOI] [PubMed]
- Brünger, A. T., Adams, P. D., Clore, G. M., DeLano, W. L., Gros, P., Grosse-Kunstleve, R. W., Jiang, J.-S., Kuszewski, J., Nilges, M., Pannu, N. S., Read, R. J., Rice, L. M., Simonson, T. & Warren, G. L. (1998). Acta Cryst. D54, 905–921. [DOI] [PubMed]
- Chen, V. B., Arendall, W. B., Headd, J. J., Keedy, D. A., Immormino, R. M., Kapral, G. J., Murray, L. W., Richardson, J. S. & Richardson, D. C. (2010). Acta Cryst. D66, 12–21. [DOI] [PMC free article] [PubMed]
- Cook, W. J., Smith, C. D., Senkovich, O., Holder, A. A. & Chattopadhyay, D. (2010). Acta Cryst. F66, 1426–1431. [DOI] [PMC free article] [PubMed]
- Cowtan, K. (1994). Jnt CCP4/ESF–EACBM Newsl. Protein Crystallogr. 31, 34–38.
- Crabb, B. S., de Koning-Ward, T. F. & Gilson, P. R. (2010). Int. J. Parasitol. 40, 509–513. [DOI] [PubMed]
- Cruickshank, D. W. J. (1999). Acta Cryst. D55, 583–601. [DOI] [PubMed]
- DeLano, W. L. (2002). PyMOL http://www.pymol.org.
- Emsley, P. & Cowtan, K. (2004). Acta Cryst. D60, 2126–2132. [DOI] [PubMed]
- Engh, R. A. & Huber, R. (1991). Acta Cryst. A47, 392–400.
- Goldberg, J. (1999). Cell, 96, 893–902. [DOI] [PubMed]
- Haase, S. & de Koning-Ward, T. F. (2010). Cell. Microbiol. 12, 580–587. [DOI] [PubMed]
- Inoue, H. & Randazzo, P. A. (2007). Traffic, 8, 1465–1475. [DOI] [PubMed]
- Kleywegt, G. J. & Jones, T. A. (1994). Proceedings of the CCP4 Study Weekend. From First Map to Final Model, edited by S. Bailey, R. Hubbard & D. Waller, pp. 59–66. Warrington: Daresbury Laboratory.
- Mandiyan, V., Andreev, J., Schlessinger, J. & Hubbard, S. R. (1999). EMBO J. 18, 6890–6898. [DOI] [PMC free article] [PubMed]
- Murshudov, G. N., Skubák, P., Lebedev, A. A., Pannu, N. S., Steiner, R. A., Nicholls, R. A., Winn, M. D., Long, F. & Vagin, A. A. (2011). Acta Cryst. D67, 355–367. [DOI] [PMC free article] [PubMed]
- Painter, J. & Merritt, E. A. (2006a). Acta Cryst. D62, 439–450. [DOI] [PubMed]
- Painter, J. & Merritt, E. A. (2006b). J. Appl. Cryst. 39, 109–111.
- Read, R. J. (1986). Acta Cryst. A42, 140–149.
- Rittinger, K., Walker, P. A., Eccleston, J. F., Nurmahomed, K., Owen, D., Laue, E., Gamblin, S. J. & Smerdon, S. J. (1997). Nature (London), 388, 693–697. [DOI] [PubMed]
- Sack, J. S. (1988). J. Mol. Graph. 6, 244–245.
- Scheffzek, K., Ahmadian, M. R., Kabsch, W., Wiesmüller, L., Lautwein, A., Schmitz, F. & Wittinghofer, A. (1997). Science, 277, 333–338. [DOI] [PubMed]
- Senkovich, O. & Chattopadhyay, D. (2004). Biophys. Biochim Acta, 1698, 127–130. [DOI] [PubMed]
- Spang, A., Shiba, Y. & Randazzo, P. A. (2010). FEBS Lett. 584, 2646–2651. [DOI] [PMC free article] [PubMed]
- Terwilliger, T. C. & Berendzen, J. (1999). Acta Cryst. D55, 849–861. [DOI] [PMC free article] [PubMed]
- Trelka, D. P., Schneider, T. G., Reeder, J. C. & Taraschi, T. F. (2000). Mol. Biochem. Parasitol. 106, 131–145. [DOI] [PubMed]
- Weimer, C., Beck, R., Eckert, P., Reckmann, I., Moelleken, J., Brügger, B. & Wieland, F. (2008). J. Cell Biol. 183, 725–735. [DOI] [PMC free article] [PubMed]
- Winn, M. D. et al. (2011). Acta Cryst. D67, 235–242.
Associated Data
This section collects any data citations, data availability statements, or supplementary materials included in this article.
Supplementary Materials
PDB reference: catalytic domain of ARFGAP, 3sub


