

Abstract
Background and rationale
MicroRNAs (miRs) recently emerged as prominent regulators of cancer processes. In the current study, we aimed at elucidating regulatory pathways and mechanisms through which miR-494, one of the miR species found to be downregulated in CCA, participates in cancer homeostasis. miR-494 was identified as downregulated in CCA based on miR arrays. Its expression was verified with quantitative real time RT-PCR (qRT-PCR). To enforce miR expression, we employed both transfection methods, as well as a retroviral construct to stably overexpress miR-494.
Main Results
Upregulation of miR-494 in cancer cells decreased growth, consistent with a functional role. mRNA arrays of cells treated with miR-494, followed by pathway analysis, suggested that miR-494 impacts cell cycle regulation. Cell cycle analyses demonstrated that miR-494 induces a significant G1/S checkpoint reinforcement. Further analyses demonstrated that miR-494 downregulates multiple molecules involved in this transition checkpoint. Luciferase reporter assays demonstrated a direct interaction between miR-494 and the 3’-Untranslated Region (UTR) of Cyclin-dependent-kinase 6 (CDK6). Last, xenograft experiments demonstrated that miR-494 induces a significant cancer growth retardation in-vivo.
Conclusions
Our findings demonstrate that miR-494 is downregulated in CCA and that its upregulation induces cancer cell growth retardation through multiple targets involved in G1-S transition. These findings support the paradigm that miRs are salient cellular signaling pathway modulators, and thus represent attractive therapeutic targets. miR-494 emerges as an important regulator of cholangiocarcinoma growth and its further study may lead to the development of novel therapeutics.
Keywords: cancer, cell cycle
INTRODUCTION
Cholangiocarcinomas (CCA) are epithelial cancers of the biliary tree (1). CCAs are usually diagnosed late in their progression, and the patient survival is usually measured in months (2). Primary Sclerosing Cholangitis (PSC) is a major CCA risk factor in the USA, while infection with Opistorchis Viverrini and Chlonorchis Sinensis represents a major CCA risk factor in Southeast Asia (3, 4). These observations lead to the hypothesis that inflammation in the biliary tree is a major predisposing factor to cancer formation. Molecular characterization of CCAs (5) further suggested that inflammation and cholestasis, through modulation of genes involved in DNA damage repair, promote cancer development.
MicroRNAs (miRs) are short, single-stranded sequences of RNA that were recently demonstrated to play a major role in the regulation of virtually all cellular processes (6, 7). In addition, microRNAs were also implicated in all solid cancers evaluated to date (6, 8, 9). MicroRNAs act mainly by decreasing protein expression at a posttranscriptional level, largely through nucleotide complementarity to the 3’UTR of corresponding species of mRNA (10).
The involvement of miRs in the genesis or homeostasis of CCA was reported by several studies. Alterations of miR expression was first reported in CCA cell lines (11), then in human tissues (12). Subsequent studies demonstrated that the expression of miRs-7a, -29 and -370 is linked to cholangiocarcinogenesis, either through an IL-6-dependent pathway, or by interacting with Mcl-1 (13–16). Further work linked miRs to cholangiocyte immune responses to infection, suggesting miR implication in inflammation-derived carcinogenesis (17–20).
One major hurdle in identifying miR roles and mechanisms in cancer results from the high number of predicted targets for any single miR species (21). Nonetheless, experimental validation confirms only a small fraction of these targets (21). To complicate matters, conserved miR binding sites are as widespread in the open reading frame as they are in the 3’UTR, and are also common in the 5’UTR regions (22). Therefore, employing in-silico search engines as a sole modality to identify biologically relevant targets appears to have relatively low accuracy. Fortunately, recent work demonstrated that decreasing amount of the target mRNA species account for approximately 84% of the miR effects on protein expression (23). Therefore, it appears that screening for alterations in mRNA levels in response to miR manipulation through either mRNA arrays or sequencing offers a valuable complement to search strategies employing in-silico engines.
In the current study, we find that miR-494 is downregulated in human CCAs. To obtain a comprehensive and unbiased view regarding the effects of miR-494 in cancer cells, we performed mRNA arrays on cells overexpressing miR-494 and on negative control, respectively. By employing pathway analysis and then confirming the results with western blotting, we found that miR-494 exerts moderate effects on multiple molecules along the canonical G1-S transition pathway. These actions appear to converge to restore the G1-S checkpoint, which explains, at least in part, the delayed growth of cells expressing miR-494.
EXPERIMENTAL PROCEDURES
Human tissues
The human specimens had been obtained at surgery performed at the Johns Hopkins Hospital, the Mayo Clinic, and Fundeni Clinical Institute. The normal bile duct (NBD) specimens had been obtained from surgical resections performed for other cancers. Informed consent was obtained from all patients.
Cell lines
HuCCT1 and TFK1 cells were maintained in Dulbelcco’s Modified Eagle Media (DMEM) supplemented with 10% fetal calf serum (FCS), 1000 U/mL penicillin/streptomycin (P/S), as previously described (24). H69 cells, a gift from Dr. D. Jefferson, Tufts University, Boston, MA), are normal human intrahepatic cholangiocytes transformed with SV-40. They were derived from a normal liver prior to liver transplantation (25).
RNA extraction
Total RNA extraction was performed by lysing cells in TRIzol reagent (Invitrogen, Carlsbad CA).
Quantitative real time RT-PCR (qRT-PCR) for miR expression
We performed miR qRT-PCR to evaluate the expression of candidate miRs. TaqMan miR Assays (Applied Biosystems, Foster City, CA) were used. Cycle passing threshold (Ct) was recorded and normalized to RNU6B expression. Relative expression was calculated as 2Ct_miR-Ct_RNU6B. PCR reactions were carried out in duplicate.
Transfection of miR mimic
The synthesized miR-494 mimic was purchased from Dharmacon (Lafayette, CO). 30~50% confluent cells were transfected with 60nM of miR-494 mimic, or mimic-negative control using Lipofectamine RNAi MAX (Invitrogen). RNA and proteins were harvested 72 hours after transfection.
Western blotting
Western blotting was performed per standard protocols. Antibodies to Phospho-Rb, CDK4, CCND1 and CCNE2 were purchased from Cell Signaling, and to CDK6 was purchased from Santa Cruz.
Cell counting
Ten thousand cells were plated in 24-well plates (Day 0), transfected 24 hours later (Day 1) and counted daily for a total of 5 days (Days 2–6) by using a hemocytometer and an inverted-light microscope.
cDNA microarrays and filtering genes
The Illumina cDNA microarray platform in the Johns Hopkins genomics facility was used for cDNA microarrays. Cells were treated with miR-494 or NSM, and 72 hours later the RNA was extracted. Candidate genes were filtered as follows: genes with expression in either HuCCT1 or TFK1 cells under 3,000 units were eliminated from analysis due to low expression. Genes that demonstrated less than 20% decrease in both HuCCT1 and TFK1 cells upon stimulation with miR-494 were eliminated. From 24,527 tags, the list of genes was reduced to 137. These genes were input into Ingenuity Pathway Analysis (IPA) to identify the pathways in which they are involved.
Proliferation assay with BrdU incorporation
72 hours post-transfection, cells were cultured for 10 minutes with 10uM BrdU in DMEM. Subsequently, the cells were fixed and permeabilized, then were than treated with 100 μL PBS, 300 μg/mL DNase I (BD PharMingen) for 1 hour at 37°C in the dark. After washing, the cells were stained with allophycocianin (APC) labeled anti-BrdU antibody for 20 minutes at RT in the dark, and analyzed by FACSCalibur.
Cell cycle analysis by flow cytometry
Cells were incubated with PI staining buffer (PBS 0.1mg/mL PI, 0.6% NP40, 2mg/mL RNase A for 30 min on ice (Roche Diagnostics). The DNA content was analyzed using FACSCalibur (BD Biosciences, San Jose, CA) and Cell Quest software (BD Biosciences). Nocodazole treatment, where applicable, was performed 24 hours prior to harvesting cells, at a final concentration of 100 ng/mL.
Retroviral vectors, viral supernatant production and viral transduction
MSCV-based bicistronic retroviral vector, MIEG3 (26) was used to express miR-494. The genomic DNA sequence from -80 to +80 of miR-494 was amplified using PCR primers flanked by EcoRI (5’) and XhoI (3’) and cloned into the multiple cloning site of MIEG3. The expression of miR-494 was linked with expression of enhanced green fluorescence protein (eGFP) via internal ribosome entry site 2 (IRES2).
The plasmid DNA was used to generate viral supernatant from Phoenix-gp cells as previously described (27). To stably express miR-494, 1x10⁵ HuCCT cells were incubated with 3 mL of viral supernatant containing 8 mg/mL of hexadimethrine bromide (Polybrene, Sigma-Aldrich, Milwaukee, WI). After 6-8h, the viral supernatant was discarded and fresh DMEM was added. Two days after transduction, cells were harvested and sorted for eGFP expression.
Luciferase reporter assay
A portion of the CDK6 3′-untranslated region (3′UTR), containing miR-494 predicted binding site, was amplified using linker primers containing XbaI restriction sites. Next, we employed Gene Tailor Site-Directed Mutagenesis System (Invitrogen) to introduce mutations in the miR-494 binding site. The sequences of primers is provided in the Supplementary materials. After sequence verification, 6,000 cells per well were seeded onto 96-well plates on the day prior to transfection. Cells were transfected with miR-494 mimic (Dharmacon) or the control, then with the pGL3 vector and an internal control pRL-CMV (Renilla luciferase). Forty-eight hours later, the luciferase reporter assay was performed using a Dual-Glo Luciferase Assay System (Promega). The luminescence intensity of firefly luciferase was normalized to that of Renilla luciferase. The effect of miR-494 on the wild type or mutant CDK6 3’UTR was calculated as a fraction of the effect exerted by the negative control (NSM). The raw data allowing direct comparison of wild type and mutant CDK6 3’UTR luciferase activities is available in Supplementary materials.
Subcutaneous tumor formation
HuCCT1-MIEG3-E and HuCCT1-MIEG3-miR494 were grown in T175 plastic flasks. A number of 3.25 million cells were resuspended in 350 uL of PBS and 200uL of Matrigel. The cells were injected subcutaneously into 6 week-old NOD/SCID mice (strain 394) purchased from Charles River Laboratories. Tumors were measured with a caliper. The reason we choose the NOD/SCID mouse model instead of the SCID mouse was based on the following rationale: Severe combined immune-deficient (SCID) mice have T and B cell deficiencies (28) , however, they retain residual immunity from Natural Killer (NK) cells and complement. The non-obese diabetic (NOD)/SCID mice represent a theoretical advantage for tumor xenotransplantation compared to the SCID mice, because they have less residual immunity resulting from defects in complement pathway and macrophage function (29). In addition, NOD/SCID mice housed in clean conditions may have less NK cells (29). Due to these considerations, we opined that choosing NOD/SCID mice for our xenotransplantation experiments might offer higher tumor engraftment.
RESULTS
We have previously identified miR species dysregulated in CCA (28). For the purpose of this study, we concentrated on miRs that were downregulated in CCA vs. normal biliary duct epithelia (NBD). The arrays were performed on 5 NBDs and 5 CCAs. Data was filtered as previously described (30). In brief, raw expression data less than 5 was considered to be at background levels. We then performed 75th percentile normalization. miR species demonstrating a statistically significant difference (unpaired Student’s t-test) between the CCA and NBD group were retained for further analyses. The candidate miRs were then ordered by the mean expression in NBDs, since a higher expression in normal tissue is suggestive of a putative role, which might be lost in cancer. The top 5 miRs are displayed in Table 1. We selected miR-494 for all subsequent studies. To confirm these initial miR array data, quantitative real time RT-PCR (qRT-PCR) analysis was performed using 12 human CCA as well as 5 normal cholangiocyte specimens. As shown in Figure 1A, miR-494 is uniformly and significantly downregulated in human CCA specimens vs. normal specimens. In addition, the level of miR-494 in a transformed normal cholangiocyte cell line, H69, was similar to the level found in NBDs. Correspondingly, the level of miR-494 in a cholangiocarcinoma cell line, HuCCT1, was similar to the level found in human primary CCA specimens (Figure 1A, last lane). Since H69 and HuCCT1 cell lines closely mimic the levels of miR-494 in normal and malignant cholangiocytes, respectively, they were used as an in-vitro model to further characterize the function of miR-494 in CCA. To verify our findings, we measured the levels of miR-494 in a larger cohort of CCA specimens that was obtained after the screening experiments. As Figure 1B demonstrates, miR-494 was found to be statistically significantly downregulated in a group of 43 CCA vs. 30 normal tissues.
Table 1. miR-494 is overexpressed in human CCA vs. normal biliary epithelium.
Microarray data is presented. The top 5 downregulated miRs in CCA are displayed. The miRs are ordered based on the expression of miR-494 in normal biliary epithelium. NBD – normal biliary duct epithelium; CCA – cholangiocarcinoma; NBD/CCA – average expression in NBD divided by average expression in CCA; t-test–unpaired Student’s t-test
| Mean NBD | Mean CCA | NBD/CCA | t-test | |
|---|---|---|---|---|
| hsa-miR-494 | 300.37 | 32.25 | 9.314657911 | 0.01 |
| hsa-miR-370 | 137.87 | 13.82 | 9.973922306 | 0.00 |
| hsa-miR-513 | 46.04 | 3.70 | 12.45113096 | 0.00 |
| hsa-miR-188 | 31.37 | 2.05 | 15.28287383 | 0.00 |
| hsa-miR-560 | 8.53 | 1.17 | 7.298486017 | 0.02 |
Figure 1.
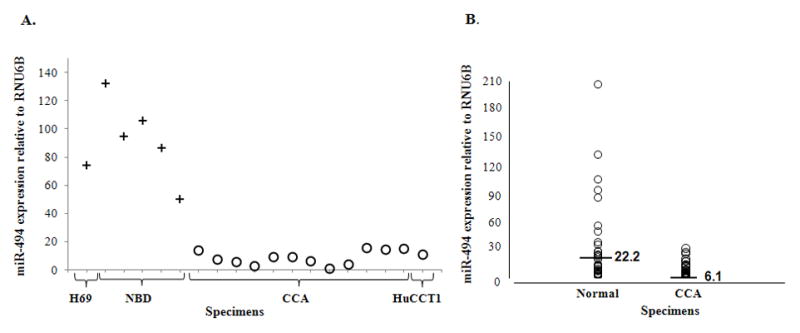
A. miR-494 is downregulated in CCA vs. normal biliary epithelium Crosses – normal cholangiocytes; Circles – malignant cholangiocytes; X-axis – specimens; lane 1–H69 normal cholangiocytes; lanes 2-6–primary human normal biliary epithelium; lanes 7–13–primary human CCA; lane 14–HuCCT1 malignant cholangiocytes. Y-axis–qRT-PCR expression of miR-494 vs. RNU6B. B. qRT-PCR expression of miR-494 is decreased in a large cohort of CCA vs. normal. X-axis–Normal and CCA specimens, respectively, are shown. Y-axis – expression of miR-494 vs. RNU6B.
To characterize the function of miR-494 in cancer, miR-494-mimic or non-specific mimic (NSM) were transfected into HuCCT1 cells. Cells transfected with miR-494 showed a significant decrease in growth as early as Day 2 and this difference became more obvious at later time points (Figure 2A). Once we established that miR-494 promotes decreased cancer cell growth, we sought to further delineate the specific mechanisms underlying its function. First, we confirmed the effects of miR-494 on cancer cell proliferation. Malignant HuCCT1 cells were transfected with miR-494 or NSM and analyzed for Brd-U incorporation. As shown in Figure 2B, HuCCT1 cells transfected with miR-494 have significantly decreased BrdU uptake when compared to cells transfected with non-specific mimic, which explains, at least in part, the difference in their growth.
Figure 2.
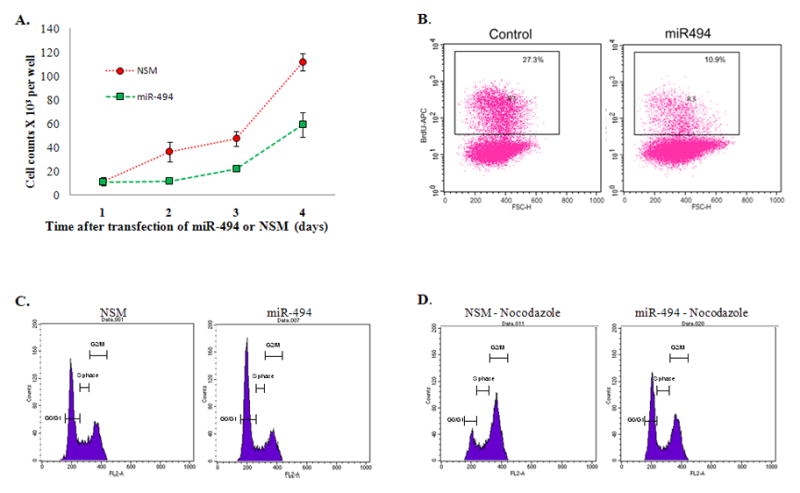
A. HuCCT1 malignant cholangiocytes display decreased growth upon miR-494 reinforced expression X-axis–HuCCT1 cells counted at day 1, 2, 3 and 4 after transfection of miR-494. Y-axis–counts × 103 of HuCCT1 cells transfected with miR-494 (green line) or the control non-specific mimic (NSM–red line). Average of 5 experiments, n=5. B. HuCCT1 malignant cholangiocytes display decreased proliferation upon miR-494 reinforced expression. Flow cytometric analysis of BrdU incorporation of HuCCT1 cells transfected with miR-494 (right panel) or NSM (left panel). Percentage displayed represent percentage BrdU positive cells of total cells. X-axis–Forward Scatter (FSC); Y axis–BrdU incorporation, representative of 3 experiments with 3 replicates per experiment. C. HuCCT1 display G1 arrest upon reinforced miR-494 expression. Flow cytometric analysis of cell cycle via PI staining of HuCCT1 cells transfected with miR-494 (right panel) or NSM (left panel). X-axis – DNA content as measured by PI incorporation. Y-axis – cell counts for each phase of the cell cycle. This experiment was performed without nocodazole. The figure is representative of 3 experiments with 3 replicates per experiment. D. HuCCT1 cells treated with nocodazole display a more pronounced G1 arrest upon reinforced miR-494 expression. Flow cytometric analysis of cell cycle upon nocodazole treatment of HuCCT1 cells transfected with miR-494 (right panel) or NSM (left panel). X-axis –DNA content as measured by PI incorporation. Y-axis – cell counts for each phase of the cell cycle. This experiment was performed with nocodazole. The figure is representative of 3 experiments with 3 replicates per experiment.
To obtain a mechanistic view into the effects of miR-494 in cancer cells, and since miR-induced destabilization of mRNA is the main reason for decreased protein levels (23), we stimulated 2 different CCA cell lines, HuCCT1 and TFK1 cells with a miR-494 mimic and performed cDNA microarray analysis to quantify changes in mRNA levels. We added the second CCA cell line to circumvent any potential cell line-specific biases. The list of genes identified to be downregulated upon miR-494 stimulation in both cell lines was then filtered and input into Ingenuity Pathway Analysis (IPA, Ingenuity Systems Incorporated, Redwood City, CA), with the purpose of identifying general mechanisms of miR function. Of note, this analysis was performed on mRNA species that are reported to be downregulated by miR-494 on the cDNA arrays, irrespective of presence of binding site in the 3’UTR or in-silico search engine prediction. IPA reported that the top 2 networks associated with the list of genes regulated by miR-494 were “Cell Cycle, Antigen Presentation, Cellular Function”, and “Cell cycle, Cancer, Genetic Disorder”, respectively (Supplementary Table 1). Furthermore, the top ranked molecular and cellular function of the genes regulated by miR-494 was reported to be “Cell Cycle” (Supplementary Table 1).
Data obtained from 1) cell growth and proliferation and 2) cDNA arrays coupled with IPA analysis, suggested that miR-494 exerts its function mainly through regulation of cell cycle. To identify the precise effects of miR-494 on cell-cycle, we performed cell cycle analysis by PI staining. These experiments demonstrate an increased in G0/G1 fraction in miR-494 transfected cells (Figure 2C), consistent with data obtained from BrdU incorporation experiments. This difference becomes more robust upon treatment with Nocodazole, a microtubule-destabilizing agent (Figure 2D). Interestingly, the downregulation of miR-494 in HuCCT1 cells has no impact on cell cycle distribution, presumably because of low baseline levels of miR-494 in these cells (Supplementary Figure 1). Of note, the transfection of H69 normal cholangiocytes with miR-494 had no effect on cell cycle progression despite upregulation of miR-494 by 18-fold (Supplementary Figure 2).
To study the molecular mechanisms responsible for the miR-494-induced G1/S arrest, we queried IPA in regards to genes impacted by miR-494 that are also involved in the G1/S checkpoint. As Figure 3 shows, based on cDNA microarray data, miR-494 appears to regulate several molecules involved in the G1/S checkpoint. The mRNA levels of Cyclin-dependent-Kinase 4 (CDK4), Cyclin-dependent-Kinase 6 (CDK6), Cyclin-D1 (CCND1), Cyclin-E2 (CCNE2) and Histone-Deacetylase-1 (HDAC1) decreased following miR-494 stimulation. We then verified if miR-494 impacts the protein levels of these targets, by treating HuCCT1 cells with miR-494 mimic and performing western blotting for these putative targets. As seen in Figure 4A, expression of miR-494 results in decreased protein levels of CDK6, CDK4, CCND1, CCNE2 and HDAC1. If the effects of miR-494 on these proteins are significant, then, we hypothesized, the final step in the G1 to S transition checkpoint should be affected. We therefore determined whether cells treated with miR-494 showed decreased phosphorylation of Rb. In accord with our hypothesis, we found a decreasing level of phospho-Rb in cells treated with miR-494 (Figure 4A). We therefore concluded that treatment of cancer cells with miR-494 reinstates the G1/S checkpoint through the coordinated downregulation of CDK6, CDK4, CCND1, CCNE2 and HDAC1, resulting in decreased phosphorylation of Rb and finally, delayed cell cycle progression.
Figure 3. Genes with altered expression upon miR-494 stimulation are involved in the G1/S checkpoint.
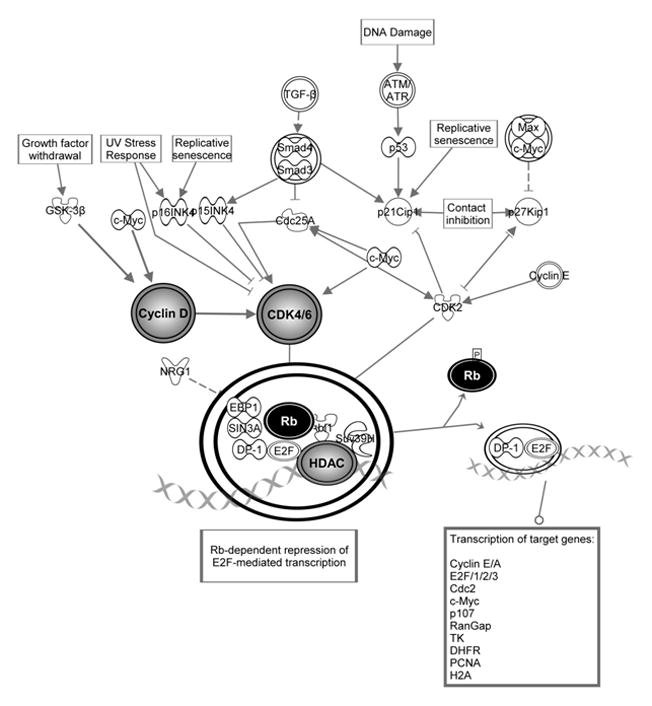
CCND1, CCNE2, CDK4, and HDAC1 were identified to be regulated by miR-494. They are involved in the final steps of G1/S checkpoint regulation. The decreasing levels of these molecules results in decreased phosphorylated Rb, with the end result of reinforcement of G1/S checkpoint.
Figure 4.
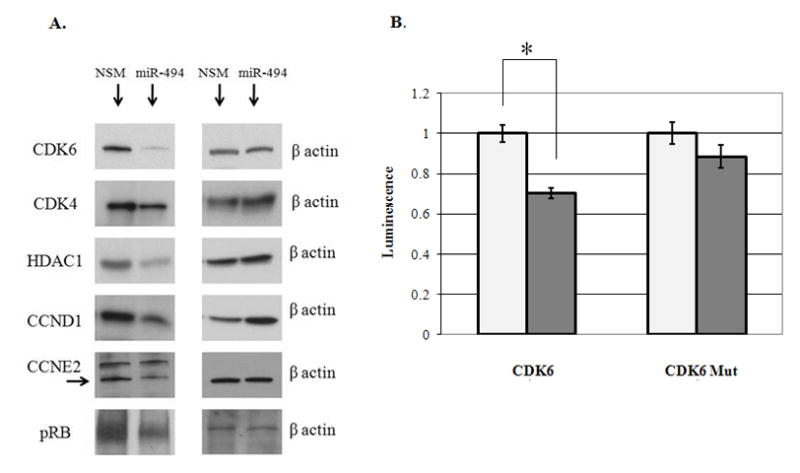
A. Protein expression of miR-494 target genes decrease upon miR-494 stimulation Representative western blots for CCND1, CCNE2, CDK4, HDAC1 and phospho-Rb are shown. Equal protein loading was performed, as shown by b-actin. B. miR-494 directly interacts with binding site in the 3’UTR of CDK6. Y-axis –relative luminescence normalized to the luminescence level in NSM (non-specific mimic) treatment. X-axis –treatment conditions. NSM –non-specific mimic, 494M –miR-494 mimic; CDK6 – correct orientation fragment of CDK6 3’UTR containing miR-494 binding site; CDK6 –Mut fragment of CDK6 3’UTR containing a mutated miR-494 binding site. Shown is the Standard Error of the Mean. miR-494 induces a statistically significant decrease in luminescence (p-value < 0.001, Student’s t-test) of the forward CDK6 3’UTR fragment vs. NSM.
The therapeutic upregulation of miR-494 specifically in cancer cells, without affecting normal surrounding cells may prove difficult from a practical perspective, in particular if high levels of miR-494 need to be delivered. To accomplish a lower, more physiologic level of miR-494 upregulation than in transfection experiments, we inserted the genomic locus of miR-494 in a retrovirus, MSCV-IRES-Enhanced-GFP-3 (MIEG3). We then infected HuCCT1 cells with MIEG3-miR-494 and determined the level of miR-494 upregulation. Compared to cells infected with MIEG3 alone, cells infected with MIEG3-miR-494 displayed a 2.5 fold upregulation of miR-494 (Supplementary Figure 3A). Of note, this level of miR-494, is higher than in CCA, and close to the level of miR-494 in normal cholangiocytes. In spite of this modest upregulation of miR-494, cells infected with MIEG3-miR494 behaved similarly to cells transfected with miR-494, displaying restoration of the G1-S checkpoint (Supplementary Figure 3B).
To study the mechanism of miR-494 directed downregulation of CDK6, CDK4, CCND1, CCNE2 and HDAC1, we searched for conserved binding sites in the 3’UTR of these genes by employing TargetScan (www.targetscan.org). We found that CDK6 is the only gene that has a conserved binding site in its 3’UTR. The binding site is located at position 228-234 in the 3’UTR. A fragment of CDK6 3’UTR, containing the putative miR-494 binding site, was cloned into a luciferase vector. We chose to clone a fragment of CDK6 3’UTR because the whole length of the 3’UTR is 10,208 nucleotides. While cloning the whole 3’UTR would have been ideal, previous experience shows that cloning of large fragments is difficult to be achieved due to the adverse effect of size of insert on ligation and transformation efficiencies (31). In addition, the standard in the field is to clone a fragment of the 3’UTR containing the putative miR binding side into the reporter vector (32). Cells transfected with the CDK6 3’UTR fragment showed an average of 30% reduction in luciferase activity upon treatment with miR-494 compared to a non-specific microRNA mimic (NSM). This decrease was statistically significant, with a p-value of less than 0.001 (Student’s unpaired t-test). Upon miR-494 binding site mutation, the effect of miR-494 on CDK6 was lost, as evinced by similar luciferase activity between miR-494 and NSM treated cells (p-value = 0.15, Student’s unpaired t-test, Figure 4B and Supplementary Figure 4).
To study the effects of miR-494 upregulation in-vivo, we injected HuCCT1-MIEG3-Empty (control, HuCCT1-EV) and HuCCT1-MIEG3-miR494 (HuCCT1-494V) cells subcutaneously in NOD/SCID mice. Each mouse was injected with 3.25 million HuCCT1-EV cells in the right flank, and with 3.25 million HuCCT1-494V in the left flank. Mice formed large tumors in the right flank (HuCCT1-EV) while they had very small nodules in the left flank (HuCCT1-494V, Figure 5A and B). The mice were sacrificed, and the tumors removed and analyzed histologically. All 3 HuCCT1-EV tumors were large and formed almost exclusively of cancer cells. One HuCCT1-494V mass was completely devoid of cancer cells, one HuCCT1-cells was composed mainly of inflammatory cells with no clear evidence of cancer, while the third HuCCT1-494V mass had inflammatory cells and very few cancer cells (Figure 5C, the left panel shows the histology for HuCCT1-EV and the right panel shows the histology for HuCCT1-494V).
Figure 5.
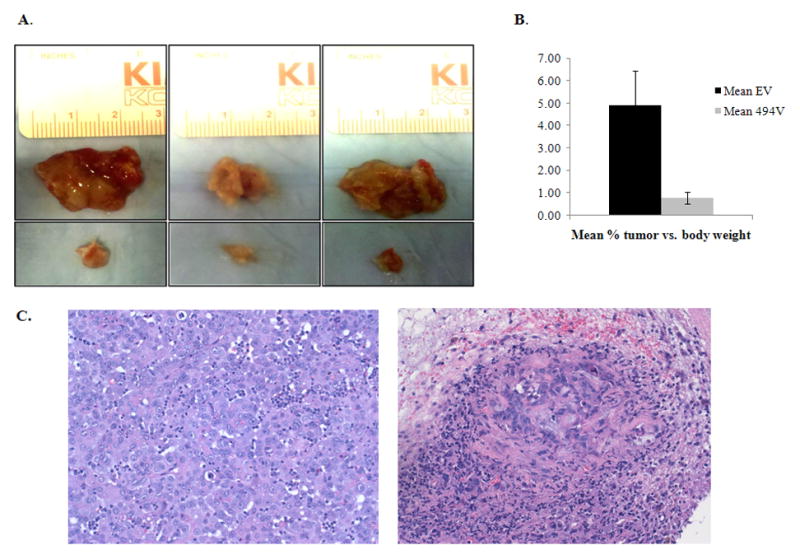
A. miR-494 induces cancer growth redardation in-vivo HuCCT1-EV and HuCCT-494V were injected in mice. The upper panel shows the tumors formed from HuCCT1-EV cells, that were significantly larger than the tumors formed from HuCCT1-494V cells (lower panel). B. HuCCT1-494V tumors were significantly smaller than HuCCT1-EV tumors. The mean percent tumor vs. mouse body weight are displayed in the figure. C. HuCCT1-494V masses had no to very few cancer cells, while the HuCCT1-EV masses were composed almost exclusively of cancer cells. The HuCCT1-EV tumors were large and composed almost entirely of viable cancer cells. Of the HuCCT1-494V masses, one had no cancer cells, the second showed no clear evidence of cancer cells, and the third (shown in the figure) demonstrates very rare cancer cells amidst inflammatory cells and fibrosis.
DISCUSSION
MicroRNAs recently emerged as salient regulators of cancer homeostasis (33). In addition, there is evidence that miRs may be valuable as in-vivo therapeutics (34–35). In the current study, we report that: 1. miR-494 is downregulated in cancer; 2. miR-494 modulates multiple key players along the canonical G1 to S progression; 3. miR-494 induces a robust G1 arrest contributing, at least in part, to decreased cancer cell growth and 4. miR-494 induces decreased tumor growth in-vivo.
Many miR-based studies published to date focused on identifying pairs of interacting miR-mRNA. Although this approach brings invaluable information, it is of somewhat limited value in characterizing the global network regulatory effects of miRs. Furthermore, the effects of a miR species on the protein level of a target mRNA is usually modest, arguing that the interaction between one miR and one target is probably not sufficient to account for the effects of miRs on cell phenotype (36). Therefore, miRs do not appear to function as on-off switches for any given target, but rather to function as rheostats to make fine-scale adjustments on multiple targets with a significant change in cell phenotype (36).
The current data put forward that the manipulation of a sole miR species results in a significant phenotypic effect, such as decreased cancer cell growth. Except for CDK6, miR-494 exerted less than 50% decrease in the level of the proteins tested (CDK4, CCND1, CCNE2, HDAC1 and phospho-RB). We believe that the effects of miR-494 are likely the end-result of simultaneous action on multiple proteins along the same canonical pathway. Our findings further solidify the theory that miRs act as signaling pathway modulators, where relatively modest input may result in large responses (37). Signaling pathways, which are highly dynamic, non-stoichiometric systems, with non-linear dose-dependent responses, thus appear to be the ideal theater for miR function (37).
The unbiased identification of regulatory molecules downstream of miR-494 by employing cDNA arrays, followed by western blot verification, unraveled a surprising coordination in the actions of miR-494. Our data suggests that miR-494 is a significant modulator of the G1-S transition canonical pathway by controlling expression of proteins involved at multiple steps. Previous data showed that exposure of murine bronchial cells to benzo(a)pyrene (known carcinogen) upregulates several miR species, including miR-494, and increases the percent of cells in the G1 phase of cell cycle (38). In the current manuscript, we demonstrate that miR-494 upregulation in human cancer cells has a direct effect on cell cycle regulation. We further demonstrate that miR-494 directly interacts with the 3’UTR of CDK6 and results in a decrease of CDK6 at protein level.
In the current manuscript we report that miR-494 acts on multiple targets involved in the regulation of the G1-S transition checkpoint. CDK6 appears to be a direct target, while the rest of the targets appear to be indirect. We believe that uncovering the rheostat qualities of miR-494 unto the G1/S transition checkpoint and understanding its downstream effectors sheds new light onto miR-dependent cell growth regulation. The understanding of the global phenotypic effects of, as well as pathway modulation induced by miR-494 is therefore crucial.
We found that while the upregulation of miR-494 in cancer cells induced G1 arrest, while in normal cells it did not. Our findings advocate for a non-linear relationship between the level of miR-494 and its effects, consistent with its involvement in cell signaling pathways. Also importantly, the lack of cell-cycle impact of miR-494 in normal cells is reassuring from the perspective of developing miR-494 based therapeutics for in-vivo delivery.
A previously published manuscript reports that miR-494 is upregulated in human retinoblastoma compared to normal retina (39). We report a downregulation of miR-494 in human cholangiocarcinoma as well as functional implications. The fact that miR-494 appears to be upregulated in retinoblastoma and downregulated in cholangiocarcinoma is not singular in the microRNA literature. Previously published studies reported contradictory expression levels, and sometimes roles, for several miRs in cancers arising in different organs. We suspect, as others, that the role of miRs is tissue and/or organ and/or context specific. Such examples include miR-31 (40–41), miR-126 (42-43), and others.
The data presented here suggests that miR-494 may represent a valuable therapeutic strategy for CCA treatment. In contrast to the more widely studied siRNA species, miRs may offer the added benefit of being intrinsic molecular species. We speculate that since miRs are naturally occurring species, identifying miRs with impact upon cellular functions may be extremely useful for utilizing their built-in, multi-pathway effects. Although their pervasive effects upon multiple mRNA species may be construed as detrimental in terms of potential off-target effects, we hypothesize that it is precisely this quality that makes miRs potent agents. In addition, we theorize that a fully developed miR-based anti-cancer therapeutic agent will be difficult to evade by cancer cells, specifically because of the wide impact of miRs on multiple molecules within a same pathway.
Supplementary Material
Acknowledgments
We would like to thank Dr. Stephen J. Meltzer for his mentorship and support, Drs. Joshua Mendell, Chi V. Dang, Victor Velculescu and James Potter for invaluable advice and guidance throughout this project. We would like to thank Dr. Ralph Hruban and Anirban Maitra for providing with CCA and normal specimens, cell lines as well as advice. H69 cells were a gift of Dr. D. Jefferson, Tufts University.
Grant support:
This work was supported by an American Gastroenterological Association grant to F.M.S. (Fellowship to Faculty Transition Award), by a Flight Attendants Medical Research Institute (FAMRI) grant (072119_YCSA) to F.M.S., by the Johns Hopkins Clinician Scientist Award to F.M.S., by a Pilot Project from the The Hopkins Conte Digestive Diseases Basic & Translational Research Core Center to F.M.S., and by a K08 Award (DK090154-01) from the NIH to F.M.S.
List of abbreviations
- miR
microRNA
- CCA
cholangiocarcinoma
- qRT-PCR
quantitative real time RT-PCR
- PSC
Primary Sclerosing Cholangitis
- UTR
3’ untranslated region
- NBD
normal biliary duct epithelia
- NSM
non-specific mimic
- IPA
Ingenuity Pathway Analysis
- CDK4
Cyclin dependent Kinase 4
- Cdk6
Cyclin dependent Kinase 6
- CCND1
Cyclin D1
- CCNE2
Cyclin E2
- HDAC1
Histone Deacetylase 1
- MIEG3
MSCV-IRES-Enhanced-GFP-3
- control HuCCT1-EV
HuCCT1-MIEG3-Empty
- HuCCT1-494V
HuCCT1-MIEG3-miR494
- DMEM
Dulbelcco’s Modified Eagle Media
- FCS
fetal calf serum
- P/S
penicillin/streptomycin
- BrdU
Bromodeoxyuridine
- APC
allophycocianin
- eGFP
enhanced green fluorescence protein
- IRES2
internal ribosome entry site 2
- μg
micrograms
Footnotes
Conflict of interests: The authors declare no competing financial interests in relation to the work described.
References
- 1.Blechacz B, Gores GJ. Cholangiocarcinoma: advances in pathogenesis, diagnosis, and treatment. Hepatology. 2008;48:308–321. doi: 10.1002/hep.22310. [DOI] [PMC free article] [PubMed] [Google Scholar]
- 2.Farley DR, Weaver AL, Nagorney DM. “Natural history” of unresected cholangiocarcinoma: patient outcome after noncurative intervention. Mayo Clin Proc. 1995;70:425–429. doi: 10.4065/70.5.425. [DOI] [PubMed] [Google Scholar]
- 3.Burak K, Angulo P, Pasha TM, Egan K, Petz J, Lindor KD. Incidence and risk factors for cholangiocarcinoma in primary sclerosing cholangitis. Am J Gastroenterol. 2004;99:523–526. doi: 10.1111/j.1572-0241.2004.04067.x. [DOI] [PubMed] [Google Scholar]
- 4.Watanapa P, Watanapa WB. Liver fluke-associated cholangiocarcinoma. Br J Surg. 2002;89:962–970. doi: 10.1046/j.1365-2168.2002.02143.x. [DOI] [PubMed] [Google Scholar]
- 5.Jaiswal M, LaRusso NF, Gores GJ. Nitric oxide in gastrointestinal epithelial cell carcinogenesis: linking inflammation to oncogenesis. Am J Physiol Gastrointest Liver Physiol. 2001;281:G626–634. doi: 10.1152/ajpgi.2001.281.3.G626. [DOI] [PubMed] [Google Scholar]
- 6.Mendell JT. MicroRNAs: critical regulators of development, cellular physiology and malignancy. Cell Cycle. 2005;4:1179–1184. doi: 10.4161/cc.4.9.2032. [DOI] [PubMed] [Google Scholar]
- 7.Croce CM, Calin GA. miRNAs, cancer, and stem cell division. Cell. 2005;122:6–7. doi: 10.1016/j.cell.2005.06.036. [DOI] [PubMed] [Google Scholar]
- 8.Negrini M, Nicoloso MS, Calin GA. MicroRNAs and cancer--new paradigms in molecular oncology. Curr Opin Cell Biol. 2009;21:470–479. doi: 10.1016/j.ceb.2009.03.002. [DOI] [PubMed] [Google Scholar]
- 9.Croce CM. Causes and consequences of microRNA dysregulation in cancer. Nat Rev Genet. 2009;10:704–714. doi: 10.1038/nrg2634. [DOI] [PMC free article] [PubMed] [Google Scholar]
- 10.Calin GA, Croce CM. MicroRNA-cancer connection: the beginning of a new tale. Cancer Res. 2006;66:7390–7394. doi: 10.1158/0008-5472.CAN-06-0800. [DOI] [PubMed] [Google Scholar]
- 11.Meng F, Henson R, Lang M, Wehbe H, Maheshwari S, Mendell JT, Jiang J, et al. Involvement of human micro-RNA in growth and response to chemotherapy in human cholangiocarcinoma cell lines. Gastroenterology. 130:2113–2129. doi: 10.1053/j.gastro.2006.02.057. [DOI] [PubMed] [Google Scholar]
- 12.Chen L, Yan HX, Yang W, Hu L, Yu LX, Liu Q, Li L, et al. The role of microRNA expression pattern in human intrahepatic cholangiocarcinoma. J Hepatol. 50:358–369. doi: 10.1016/j.jhep.2008.09.015. [DOI] [PubMed] [Google Scholar]
- 13.Meng F, Henson R, Wehbe-Janek H, Smith H, Ueno Y, Patel T. The MicroRNA let-7a modulates interleukin-6-dependent STAT-3 survival signaling in malignant human cholangiocytes. J Biol Chem. 282:8256–8264. doi: 10.1074/jbc.M607712200. [DOI] [PubMed] [Google Scholar]
- 14.Mott JL, Kobayashi S, Bronk SF, Gores GJ. mir-29 regulates Mcl-1 protein expression and apoptosis. Oncogene. 2007;26:6133–6140. doi: 10.1038/sj.onc.1210436. [DOI] [PMC free article] [PubMed] [Google Scholar]
- 15.Meng F, Wehbe-Janek H, Henson R, Smith H, Patel T. Epigenetic regulation of microRNA-370 by interleukin-6 in malignant human cholangiocytes. Oncogene. 2008;27:378–386. doi: 10.1038/sj.onc.1210648. [DOI] [PubMed] [Google Scholar]
- 16.Braconi C, Huang N, Patel T. MicroRNA-dependent regulation of DNA methyltransferase-1 and tumor suppressor gene expression by interleukin-6 in human malignant cholangiocytes. Hepatology. 51:881–890. doi: 10.1002/hep.23381. [DOI] [PMC free article] [PubMed] [Google Scholar]
- 17.Chen XM, Splinter PL, O'Hara SP, LaRusso NF. A cellular micro-RNA, let-7i, regulates Toll-like receptor 4 expression and contributes to cholangiocyte immune responses against Cryptosporidium parvum infection. J Biol Chem. 2007;282:28929–28938. doi: 10.1074/jbc.M702633200. [DOI] [PMC free article] [PubMed] [Google Scholar]
- 18.Gong AY, Zhou R, Hu G, Li X, Splinter PL, O'Hara SP, LaRusso NF, et al. MicroRNA-513 regulates B7-H1 translation and is involved in IFN-gamma-induced B7-H1 expression in cholangiocytes. J Immunol. 2009;182:1325–1333. doi: 10.4049/jimmunol.182.3.1325. [DOI] [PMC free article] [PubMed] [Google Scholar]
- 19.O'Hara SP, Splinter PL, Gajdos GB, Trussoni CE, Fernandez-Zapico ME, Chen XM, LaRusso NF. NFkappaB p50-CCAAT/enhancer-binding protein beta (C/EBPbeta)-mediated transcriptional repression of microRNA let-7i following microbial infection. J Biol Chem. 285:216–225. doi: 10.1074/jbc.M109.041640. [DOI] [PMC free article] [PubMed] [Google Scholar]
- 20.Hu G, Zhou R, Liu J, Gong AY, Eischeid AN, Dittman JW, Chen XM. MicroRNA-98 and let-7 confer cholangiocyte expression of cytokine-inducible Src homology 2-containing protein in response to microbial challenge. J Immunol. 183:1617–1624. doi: 10.4049/jimmunol.0804362. [DOI] [PMC free article] [PubMed] [Google Scholar]
- 21.Gunaratne PH, Creighton CJ, Watson M, Tennakoon JB. Large-scale integration of MicroRNA and gene expression data for identification of enriched microRNA-mRNA associations in biological systems. Methods Mol Biol. 667:297–315. doi: 10.1007/978-1-60761-811-9_20. [DOI] [PubMed] [Google Scholar]
- 22.Schnall-Levin M, Zhao Y, Perrimon N, Berger B. Conserved microRNA targeting in Drosophila is as widespread in coding regions as in 3'UTRs. Proc Natl Acad Sci USA. 107:15751–15756. doi: 10.1073/pnas.1006172107. [DOI] [PMC free article] [PubMed] [Google Scholar]
- 23.Guo H, Ingolia NT, Weissman JS, Bartel DP. Mammalian microRNAs predominantly act to decrease target mRNA levels. Nature. 466:835–840. doi: 10.1038/nature09267. [DOI] [PMC free article] [PubMed] [Google Scholar]
- 24.Hansel DE, Rahman A, Hidalgo M, Thuluvath PJ, Lillemoe KD, Shulick R, Ku JL, et al. Identification of novel cellular targets in biliary tract cancers using global gene expression technology. Am J Pathol. 2003;163:217–229. doi: 10.1016/S0002-9440(10)63645-0. [DOI] [PMC free article] [PubMed] [Google Scholar]
- 25.Grubman SA, Perrone RD, Lee DW, Murray SL, Rogers LC, Wolkoff LI, Mulberg AE, et al. Regulation of intracellular pH by immortalized human intrahepatic biliary epithelial cell lines. Am J Physiol. 1994;266:G1060–1070. doi: 10.1152/ajpgi.1994.266.6.G1060. [DOI] [PubMed] [Google Scholar]
- 26.Ghiaur G, Lee A, Bailey J, Cancelas JA, Zheng Y, Williams DA. Inhibition of RhoA GTPase activity enhances hematopoietic stem and progenitor cell proliferation and engraftment. Blood. 108:2087–2094. doi: 10.1182/blood-2006-02-001560. [DOI] [PubMed] [Google Scholar]
- 27.Wahlers A, Schwieger M, Li Z, Meier-Tackmann D, Lindemann C, Eckert HG, von Laer D, et al. Influence of multiplicity of infection and protein stability on retroviral vector-mediated gene expression in hematopoietic cells. Gene Ther. 8:477–486. doi: 10.1038/sj.gt.3301426. [DOI] [PubMed] [Google Scholar]
- 28.Bosma MJ, Carroll AM. The SCID mouse mutant: definition, characterization, and potential uses. Annu Rev Immunol. 9:323–350. doi: 10.1146/annurev.iy.09.040191.001543. [DOI] [PubMed] [Google Scholar]
- 29.Shultz LD, Schweitzer PA, Christianson SW, Gott B, Schweitzer IB, Tennent B, McKenna S, et al. Multiple defects in innate and adaptive immunologic function in NOD/LtSz-scid mice. J Immunol. 154:180–191. [PubMed] [Google Scholar]
- 30.Selaru FM, Olaru AV, Kan T, David S, Cheng Y, Mori Y, Yang J, et al. MicroRNA-21 is overexpressed in human cholangiocarcinoma and regulates programmed cell death 4 and tissue inhibitor of metalloproteinase 3. Hepatology. 49:1595–1601. doi: 10.1002/hep.22838. [DOI] [PMC free article] [PubMed] [Google Scholar]
- 31.Yoshida N, Sato M. Plasmid uptake by bacteria: a comparison of methods and efficiencies. Appl Microbiol Biotechnol. 83:791–798. doi: 10.1007/s00253-009-2042-4. [DOI] [PubMed] [Google Scholar]
- 32.Wu J, Qian J, Li C, Kwok L, Cheng F, Liu P, Perdomo C, et al. miR-129 regulates cell proliferation by downregulating Cdk6 expression. Cell Cycle. 9:1809–1818. doi: 10.4161/cc.9.9.11535. [DOI] [PubMed] [Google Scholar]
- 33.Sotiropoulou G, Pampalakis G, Lianidou E, Mourelatos Z. Emerging roles of microRNAs as molecular switches in the integrated circuit of the cancer cell. RNA. 2009;15:1443–1461. doi: 10.1261/rna.1534709. [DOI] [PMC free article] [PubMed] [Google Scholar]
- 34.Kota J, Chivukula RR, O'Donnell KA, Wentzel EA, Montgomery CL, Hwang HW, Chang TC, et al. Therapeutic microRNA delivery suppresses tumorigenesis in a murine liver cancer model. Cell. 2009;137:1005–1017. doi: 10.1016/j.cell.2009.04.021. [DOI] [PMC free article] [PubMed] [Google Scholar]
- 35.Lanford RE, Hildebrandt-Eriksen ES, Petri A, Persson R, Lindow M, Munk ME, Kauppinen S, et al. Therapeutic silencing of microRNA-122 in primates with chronic hepatitis C virus infection. Science. 327:198–201. doi: 10.1126/science.1178178. [DOI] [PMC free article] [PubMed] [Google Scholar]
- 36.Baek D, Villen J, Shin C, Camargo FD, Gygi SP, Bartel DP. The impact of microRNAs on protein output. Nature. 455:64–71. doi: 10.1038/nature07242. [DOI] [PMC free article] [PubMed] [Google Scholar]
- 37.Inui M, Martello G, Piccolo S. MicroRNA control of signal transduction. Nat Rev Mol Cell Biol. 11:252–263. doi: 10.1038/nrm2868. [DOI] [PubMed] [Google Scholar]
- 38.Duan H, Jiang Y, Zhang H, Wu Y. MiR-320 and miR-494 affect cell cycles of primary murine bronchial epithelial cells exposed to benzo[a]pyrene. Toxicol In Vitro. 24:928–935. doi: 10.1016/j.tiv.2009.11.013. [DOI] [PubMed] [Google Scholar]
- 39.Zhao JJ, Yang J, Lin J, Yao N, Zhu Y, Zheng J, Xu J, et al. Identification of miRNAs associated with tumorigenesis of retinoblastoma by miRNA microarray analysis. Childs Nerv Syst. 2009;25:13–20. doi: 10.1007/s00381-008-0701-x. [DOI] [PubMed] [Google Scholar]
- 40.Liu X, Sempere LF, Ouyang H, Memoli VA, Andrew AS, Luo Y, Demidenko E, et al. MicroRNA-31 functions as an oncogenic microRNA in mouse and human lung cancer cells by repressing specific tumor suppressors. J Clin Invest. 120:1298–1309. doi: 10.1172/JCI39566. [DOI] [PMC free article] [PubMed] [Google Scholar]
- 41.Creighton CJ, Fountain MD, Yu Z, Nagaraja AK, Zhu H, Khan M, Olokpa E, et al. Molecular profiling uncovers a p53-associated role for microRNA-31 in inhibiting the proliferation of serous ovarian carcinomas and other cancers. Cancer Res. 70:1906–1915. doi: 10.1158/0008-5472.CAN-09-3875. [DOI] [PMC free article] [PubMed] [Google Scholar]
- 42.Donnem T, Lonvik K, Eklo K, Berg T, Sorbye SW, Al-Shibli K, Al-Saad S, et al. Independent and tissue-specific prognostic impact of miR-126 in nonsmall cell lung cancer: Coexpression with vascular endothelial growth factor-A predicts poor survival. Cancer. 117:3193–3200. doi: 10.1002/cncr.25907. [DOI] [PubMed] [Google Scholar]
- 43.Li XM, Wang AM, Zhang J, Yi H. Down-regulation of miR-126 expression in colorectal cancer and its clinical significance. Med Oncol. doi: 10.1007/s12032-010-9637-6. [DOI] [PubMed] [Google Scholar]
Associated Data
This section collects any data citations, data availability statements, or supplementary materials included in this article.